
Moving Averages Explained
Moving Averages are some of the oldest technical indicators and still remain some of the most useful indicators for market analysis using the technical analysis approach. In simple terms moving average is the average price of the security at a specified point in time. A moving average tries to exhibit a trend in the prices. The purpose of moving average is to show the trend of a stock/security in a smoothed manner with a single line with less apparent volatility. Moving averages give unique signals that can be used in conjunction with other traditional chart patterns like the MACD, etc.Types of Moving Averages in Technical Analysis and Calculating Moving Averages
Common Moving averages can be classified as Simple Moving Averages, Weighted Moving Averages or Exponential Moving Averages. To calculate simple moving average whether it is 10 days or 50days one adds the price of 10 days and divides by 10 or the 50 days and divide by 50 as the case may be. For the next day calculation, drop the last data and add the latest data point and re calculate the average, in this way the average keeps on moving forward with every new data point being generated. In order to calculate the weighted moving average, the oldest data point is assigned with the weight 1 which increases incrementally for all data points which is then divided by weighted average of number of days of moving average being constructed. Exponential moving average is similar to weighted average but with slightly different calculation but keeps the core philosophy same by assigning more importance to the latest data by assigning weights in such a manner that the recent data points are assigned an exponentially higher weight that previous old data points in the series. The Exponential moving average captures recent trends faster than the simple moving average. One important factor that traders should consider while calculating moving averages is that the charts of the stocks/underlying security are adjusted for all corporate actions such as M&A, stock splits, bonuses etc otherwise the moving averages that are calculated can be distorted. Here's a moving average example of an incorrect distorted chart where the correct corporate action adjustments were not made. Moving averages can be calculated on alternative prices i.e. closing price/open/high/low/adjusted close but in most case the closing price for the day is considered. [caption id="attachment_1293" align="aligncenter" width="2472"]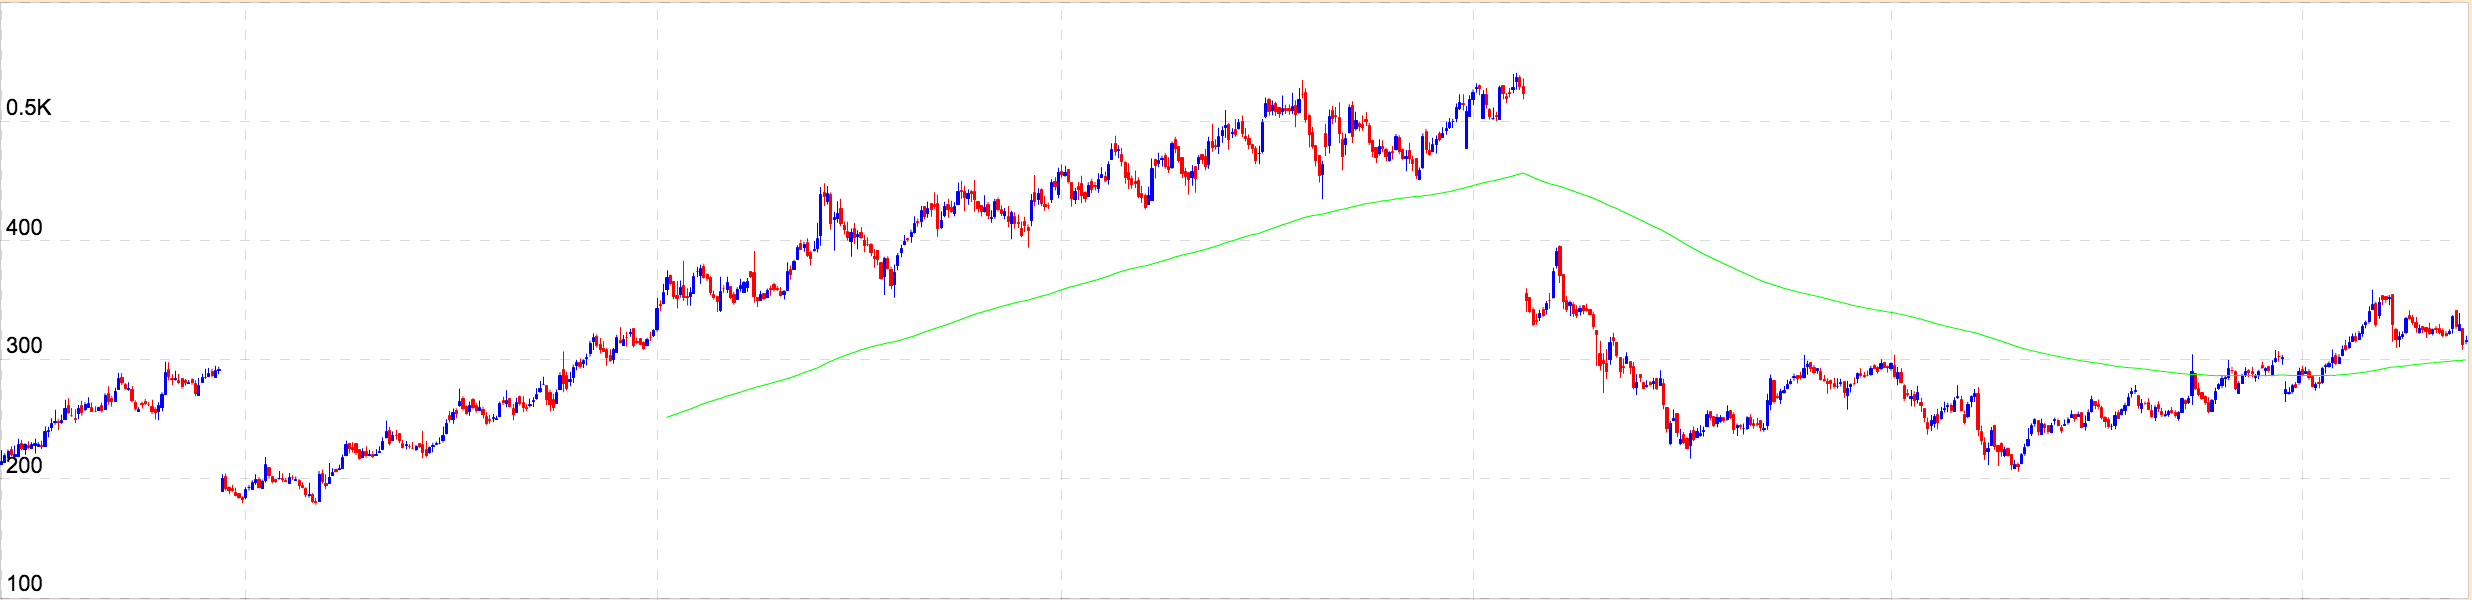 Incorrect Moving Average Example. MA line as seen in Green.[/caption]
List of the types of moving averages used in Technical Analysis
- Simple Moving Average - SMA
- Exponential Moving Average - EMA
- Weighted Moving Average
- Time Series Moving Average
- Triangular Moving Average
- Variable Moving Average
- VIDYA Moving Average
- Welles Wilder Moving Average
Sensitivity of Moving Averages
The shorter the moving average, the greater the sensitivity to the price changes. For example a 5 days moving average will be much more sensitive than a 20 days moving average. The problem with short term moving average is that a greater number of false moves will occur. For commodities short moving averages of 3 days, 6 days and 12 days are appropriate whereas for stocks 10 days, 30 days, 50 days, 100 days and 200 days are more appropriate. There isn’t just one “right” time frame. It all depends on the user of the moving average i.e. short term trader or positional trader and the type of the market i.e. trending or non-trending. The longer the holding capacity, the longer should be the period of moving average under consideration.Uses of Multiple Moving Averages
Moving average can become more powerful when multiple averages are used together. One combination is 9 days and 18 days simple moving average. A buy signal is generated when 9 days moving average crosses above the 18 days moving average and both moving averages are in upward direction. Multiple moving averages appeal to many technical analysts. Research shows using two moving averages tend to be most effective as a complete trading system. Generally in Algorithmic trading some form of moving averages are used to make the system more robust and effective.Disadvantages of the Moving Averages
The biggest assumption for using moving averages is that markets are often in the trending mode. But in reality markets spend more time in consolidations. Second, quick turning markets will always be well ahead of the moving averages thus giving delayed signals for entry and exit by which time the best part of the move is probably over. In the example below the moving average cross over system has captured big moves during trending phase whereas during the non trending phase there were whipsaw losses in the Nifty50. [caption id="attachment_973" align="aligncenter" width="1301"]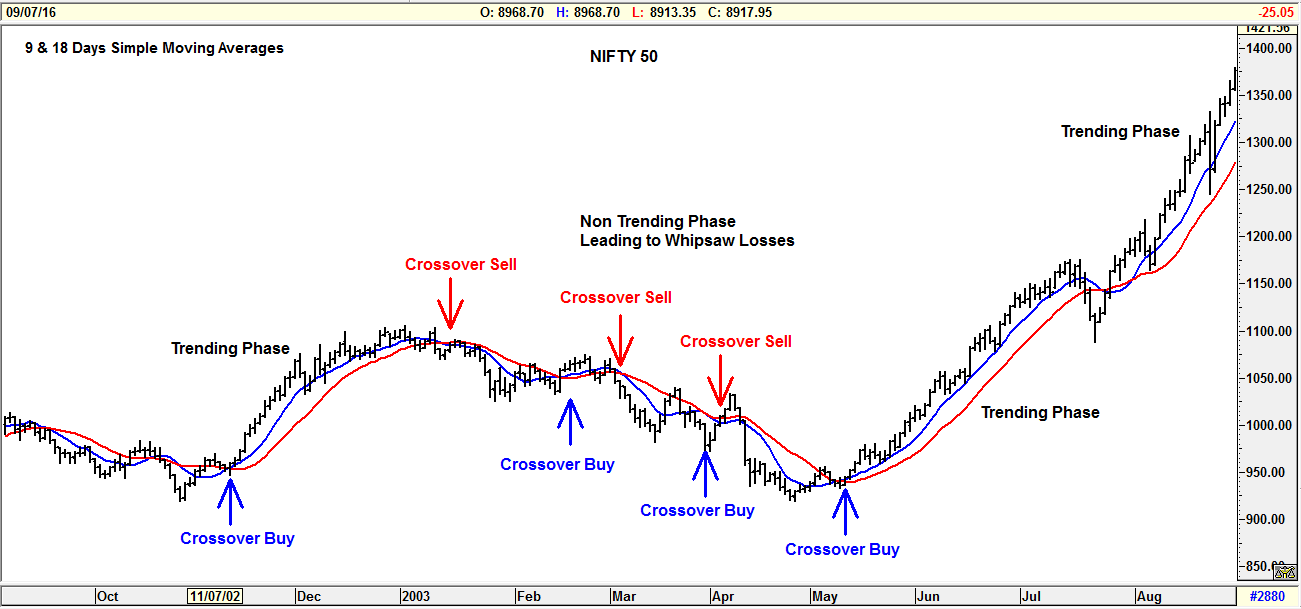 Moving Average Example[/caption]
Conclusion
Moving averages are one of the simplest yet powerful tools in the arsenal of technical analyst. Sometimes the moving averages itself acts as an area of support and resistance e.g. 200 Days Moving Average. Stocks in secular bull markets tend to hold above the 200 DMA and those in a secular bear market usually trade below the 200 DMA for extended periods of time. The more times a moving average is touched the greater the significance of a violation. A penetration of a moving average is a signal that a change in trend may be taking place. Signals generated from the moving averages are infallible, but sometimes due to whipsaws losses during the sideways market the traders abandon the moving average system due to lack of conviction but however after every phase of sideways correction, the time for major move does and always come which is the best time for generating profits but by that time the trader has already abandoned the system lamenting why he did so. Thus traders and investors must have the iron rod discipline to follow the moving average system diligently for superior risk adjusted returns. Some of the most consistent Hedge Fund Managers use only moving averages to generate superior returns year after year for decades. Moving Average is the founding pillar for effective and profitable technical Analysis.
Additional Reference Links
Moving Average Example[/caption]
Conclusion
Moving averages are one of the simplest yet powerful tools in the arsenal of technical analyst. Sometimes the moving averages itself acts as an area of support and resistance e.g. 200 Days Moving Average. Stocks in secular bull markets tend to hold above the 200 DMA and those in a secular bear market usually trade below the 200 DMA for extended periods of time. The more times a moving average is touched the greater the significance of a violation. A penetration of a moving average is a signal that a change in trend may be taking place. Signals generated from the moving averages are infallible, but sometimes due to whipsaws losses during the sideways market the traders abandon the moving average system due to lack of conviction but however after every phase of sideways correction, the time for major move does and always come which is the best time for generating profits but by that time the trader has already abandoned the system lamenting why he did so. Thus traders and investors must have the iron rod discipline to follow the moving average system diligently for superior risk adjusted returns. Some of the most consistent Hedge Fund Managers use only moving averages to generate superior returns year after year for decades. Moving Average is the founding pillar for effective and profitable technical Analysis.
Additional Reference Links


Leave A Comment?