
Preface
On behalf of entire Samco team I would like wish you a wonderful Diwali and a Prosperous New Year.
These days no discussion about market is complete without gold and silver. Precious metals have acted as a true hedge against uncertainty when equities failed to deliver.
 Nifty closed at an all-time high on 26th September 2024 at 26,277. Nifty is down by about 4-5% from its highs. However, when you look beneath the hood, you will realize All Izz Not Well.
Out of the Top 750 stocks by market capitalization today, 721 were listed on 26 Sep 2024. Only 252 stocks are trading on a positive note as on 10 October. 469 stocks are still trading in the red after more than a year.
The average gains are -4.23% and median gains are -10.79%. Stocks that lost more than 20% in last 13 months are 240 while those that gained are only 121.
Total count | 750 |
Listed on 26 Sep 2024 | 721 |
Stocks with Gains > 0% | 252 |
Stocks with Gains < 0% | 469 |
Median Gain | -10.79% |
Average Gains | -4.23% |
Stocks gaining more than 20% | 121 |
Stocks losing more than 20% | 240 |
So by all counts the performance of stock market has not been great in the last one year. If your portfolio has outperformed the market returns then you have done a really good job.
As a part of our mission to help every market participant consistently ace the index, we have handpicked a few stocks from our live recommendations across categories that we believe can do well in Samvat 2082.
At Samco we believe in growing wealth the scientific way - no noise, no guesswork, just logic-led compounding. It’s because of this scientific process that our last Samvat’s picks have done well in a turbulent market.
While we may not know how this Samvat’s picks will perform, we’re confident that our systems and processes have only evolved — becoming sharper, stronger, and better than ever before.
Best wishes for Samvat 2082.
This Diwali special market note from Apurva Sheth, Head of Market Perspectives & Research at Samco, presents a structured Samvat 2082 outlook with a transparent review of last year’s Muhurat Picks, a data-driven take on market breadth and risks, and a curated list of Muhurat Picks 2025 aligned to Samco’s logic-led compounding approach. Readers will find a quick index for easy navigation covering performance, outlook, and stock ideas plus a clear summary and disclaimer for complete context and compliance. Crafted for investors seeking clarity amid narrow breadth, it blends insight, accountability, and actionable ideas in one guide.
Invest with the blessings of Diwali! View the hand-picked Muhurat 2025 Stock Basket in the app.
Muhurat Picks 2024 Performance
Total Recommendations | 12 | Winners | 8 |
Win Rate | 67% | Average Gains | 18.04% |
Stock Name | Recommendation | Holding Period | Recommendated Price (25 October 2024) | Current Price (13 October 2025) | Returns % |
Piramal Pharma | Buy | 1 Year | 244 | 197 | -19.07% |
Cholamandalam FInancial Holdings | Buy | 1 Year | 1,790 | 1,836 | 2.57% |
Deepak Fertilizers | Buy | 1 Year | 1,134 | 1,480 | 30.53% |
PG Electroplast # | BUY | 6 Month | 566 | 871 | 54% |
Persistent Systems # | BUY | 6 Month | 5,671 | 5,274 | -7% |
HDFC Bank | Buy | 1 Year | 871 | 977 | 12.17% |
Vindhya Telelinks | Buy | 1 Year | 1,898 | 1,381 | -27.24% |
Ramco Industries | Buy | 1 Year | 234 | 340 | 45.30% |
Hikal ## | Buy | 3 Months | 342 | 349 | 2.05% |
Tube Investments of India Ltd ## | Buy | 3 Months | 4,627 | 3,232 | -30.15% |
Gold Bees | Buy | 1 Year | 65 | 105 | 61% |
Silver Bees | Buy | 1 Year | 92 | 178 | 93% |
# Closing price of 6 month ending 25 April 25 |
## Closing price of 3 month ending 24 Jan 25 |
Market Outlook for Samvat 2082
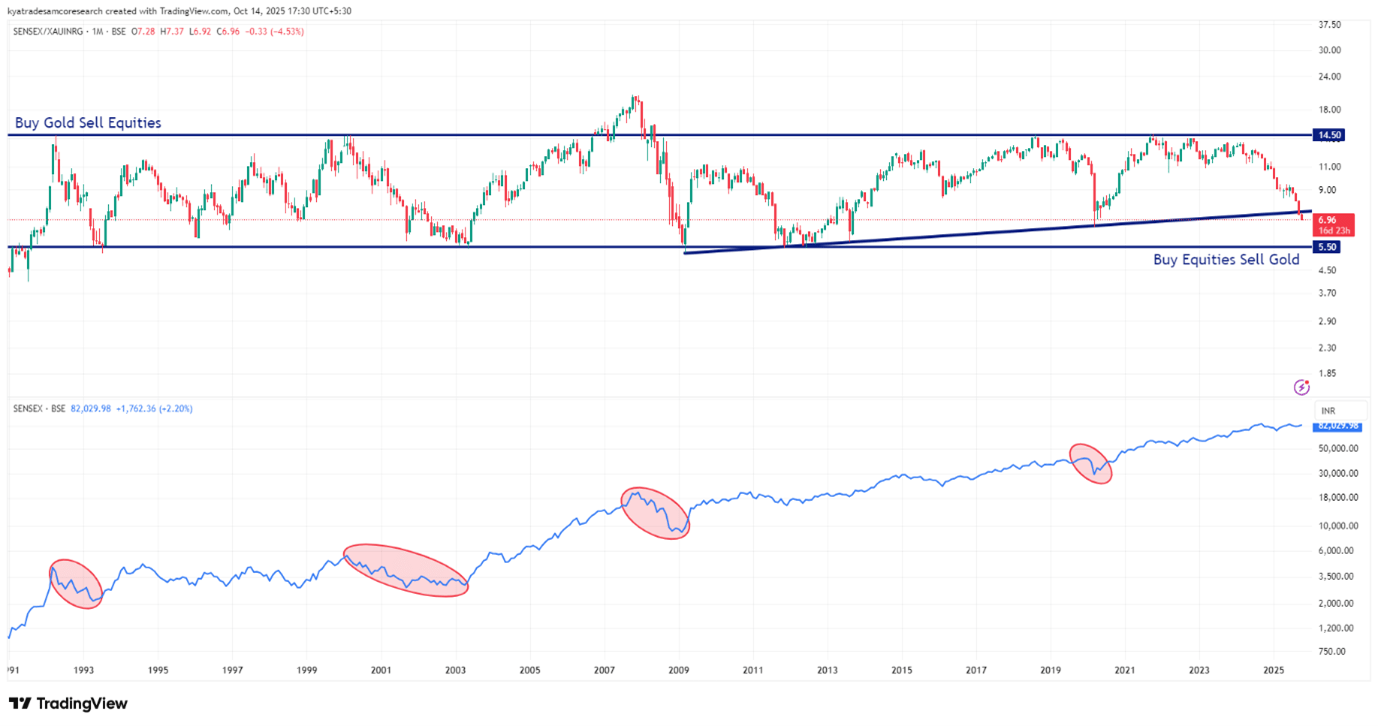
In the above panel, Sensex-to-Gold ratio compares the performance of Indian equities to gold since 1990. A rising ratio means equities are outperforming gold — signaling optimism, growth, and risk-taking — while a falling ratio shows gold outperforming equities, indicating fear, caution, or capital preservation. This single chart perfectly captures the market’s long-term mood cycle: greed versus fear, risk taking versus safety.
The Sensex-to-Gold ratio has moved in a range of 5.5 to 14.5 over the last 35 years. All the major top (1992, 2000, 2008, 2018) in equity markets have preceded or coincided by a top in this ratio.
While major bottoms in equities (1991, 2001, 2009, 2011, 2020) coincided with sharp falls close to 5.5 in this ratio. Those panic phases were followed by massive equity upcycles as risk appetite revived and gold’s relative appeal faded.
Now the ratio has been falling sharply over the last one year. However, much of this fall in this ratio is because of gold’s outperformance rather than a fall in Sensex. In other words, this is a soft rotation towards safety rather than a fear-led equity washout. For investors, this means the signal is not yet fully complete.
Historically, durable bottoms in this ratio have emerged after a phase of equity capitulation. The red ovals highlighted in the bottom panel are the bear markets in Sensex which created the bottom in the ratio above.
Currently, Sensex is down only about 2-3% from its all-time highs. Unless the Sensex undergoes a deeper time or price correction this Samvat, the next big equity cycle may still be farther away.
Until then, we recommend to stay diversified and patient: gold continues to hold its defensive edge, while equities may offer better entry points later in the year as the ratio stabilizes around this long-term support.
Muhurat Picks 2025
While Samvat 2081 may not go down as a blockbuster year for the markets, it will always hold special significance for Samco. This was the year we took a bold step forward and launched our Scientific Trading & Recommendations App — a platform designed to help investors trade and invest with discipline, data and process, not emotions.
Starting with 12 well-researched categories covering equities, ETFs, futures and options, the app has already gained traction among investors who prefer science over sattabaazi. Many more categories, each rooted in rule-based and process-driven frameworks, are in the pipeline as we continue to simplify decision-making for retail investors.
As we usher in Samvat 2082, our focus shifts from system building to wealth building. We have carefully shortlisted a basket of stocks from auto, agriculture, metal, mining, power, and transmission sector. We believe that these industries are poised for both cyclical recovery and structural growth. These sectors are benefiting from strong domestic demand, policy tailwinds, and the ongoing capex cycle, creating an attractive blend of value and growth.
At Samco, our philosophy remains unchanged — to help investors make the right choices backed by robust research, clear risk management, and disciplined execution. As the new Samvat begins, we invite you to continue this journey with us — where recommendations are scientific, systematic, and sustainable.
Here are our handpicked ideas for Samvat 2082 — a year of compounding opportunities and scientific recommendations.
Gold Bees
Category Name | Holding Period | CMP | Buying Range | Stoploss | Target | Expected Gains % | |
Tactical ETF Bets | 1 Year | 105.2 | 100-108 | 80 | 150 | 43% |
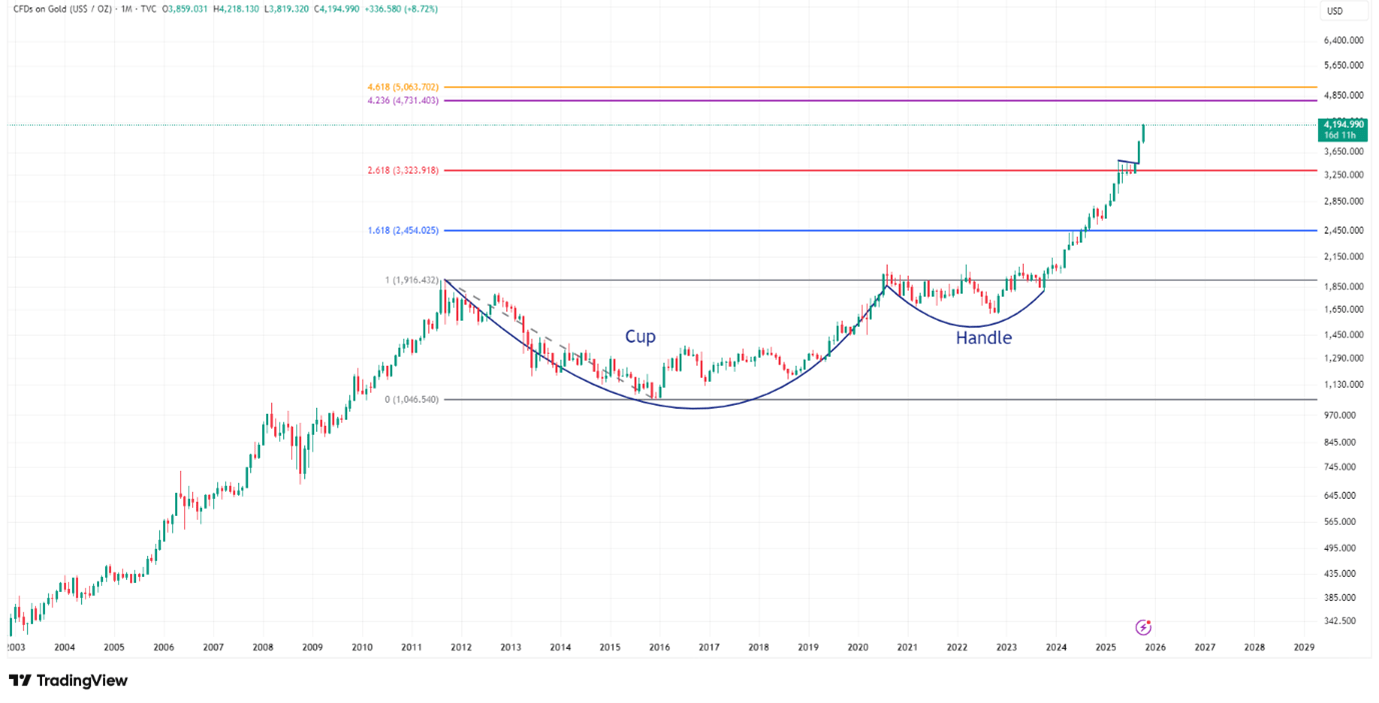
Gold’s story in Samvat 2082 isn’t about glitter — it’s about protection. After delivering a 61% rally since last Samvat, many investors are wondering if the bull run is over. But history suggests otherwise — gold bull markets rarely end with central banks still buying and real interest rates still near neutral levels.
Global Shifts Favour Gold
The U.S. dollar has peaked after an aggressive tightening cycle. With inflation still sticky and the Federal Reserve expected to ease rates further, the next leg of liquidity will find its way into hard assets like gold and silver. The BRICS bloc’s de-dollarization due to tariffs and rising geopolitical tensions in the Middle East and Eastern Europe only strengthen gold’s role as the world’s preferred “neutral reserve”.
India’s Own Tailwinds
India is the world’s second-largest consumer of gold. With the rupee under structural pressure, imported gold prices could continue to make new highs even if global gold prices consolidate as rupee weakens. A strong wedding and festival season through Samvat 2082 ensures steady demand. Gold is also witnessing demand from ETF’s globally as investors who feel left out are rushing to buy gold.
Portfolio Insurance, Not Emotion
Gold remains the ultimate portfolio hedge against unexpected drawdowns. A portfolio that includes gold has delivered better risk adjusted returns than one with only equities over long run. If you are concerned about entering in gold now after a sharp rally than you can even do a SIP…but for heaven’s sake have gold in your portfolio.
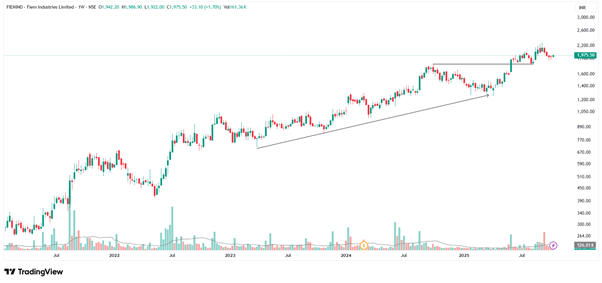
Fiem Industries Ltd.
Category Name | Holding Period | CMP | Buying Range | Stoploss | Target | Expected Gains % | |
Mid/Small caps to Buy for 3 Months | 3 months | 1,975 | 1,950-2,000 | 1,780 | 2,400 | 22% |
Company Overview:
Fiem Industries Ltd is a leading auto ancillary manufacturer specializing in automotive lighting systems, rear-view mirrors, and plastic molded components, with a growing focus on LED and EV lighting solutions. It supplies major OEMs in the two-wheeler and passenger vehicle space and continues to strengthen its export presence. Fiem is well placed to benefit from the rising demand for premium and energy-efficient lighting systems in the automotive sector.
Fundamental View:
The company posted healthy FY25 results with revenue up 19% YoY and PAT rising 24%, driven by strong volumes and operational efficiency. EPS improved to ₹77.86 from ₹63.00 in FY24, while ROE stood at a robust 21%. With negligible debt, consistent dividends, and improving profitability, Fiem enjoys solid financial health. Trading at around 24x P/E, valuations appear reasonable considering its steady earnings momentum and strong positioning in the auto-ancillary space.
Technical View & Recommendation:
Technically, the stock remains in a strong uptrend, forming higher highs and higher lows after breaking out of a saucer pattern. Key support lies near ₹1,850–₹1,870, with bullish signals from RSI and MACD supported by rising volumes. We recommend to buy at ₹1,950–₹2,000 with a target of ₹2,400 and stop-loss at ₹1,780 for a 3-month view.
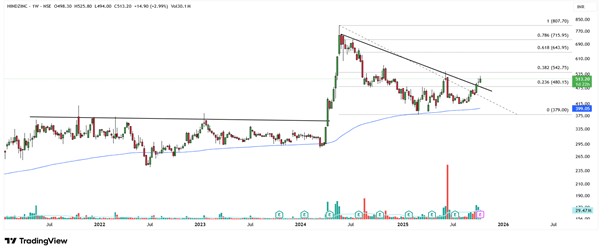
Hindustan Zinc Ltd
Category Name | Holding Period | CMP | Buying Range | Stoploss | Target | Expected Gains | |
Mid/Small caps to Buy for 3 Months | 3 Month | 513 | 505-515 | 400 | 700 | 36% |
Company Overview:
Hindustan Zinc Ltd (HZL), a Vedanta Group company, is India’s largest and the world’s second-largest integrated zinc-lead producer, as well as the fourth-largest silver producer globally. It operates 100% underground mines across Rajasthan and a silver refinery in Uttarakhand, HZL maintains a fully integrated value chain from mining to smelting.
Fundamental View:
With silver currently in a strong uptrend, benefiting from its dual nature as both an industrial and safe-haven metal, the company is well-positioned to gain from higher price realizations, potentially enhancing its revenue and profitability. The alignment of strong technical cues with favorable macro- tailwinds provides a timely opportunity for investors.
Technical View & Recommendation:
Hindustan Zinc presents an attractive technical setup as a Diwali pick, offering a potential upside toward the ₹700–₹720 zone. The stock recently underwent a correction followed by a robust multi-year breakout and has now established a solid base near the ₹400–₹410 range, a key confluence area of the previous swing low and the 200-week moving average. This zone has reaffirmed strong support at lower levels. Moreover, the price has reclaimed and sustained above its 20-week EMA, indicating a resurgence of bullish momentum and the possibility of a fresh impulse wave unfolding. We recommend Buy at ₹ 505 – ₹ 515 with a target of ₹700 and stop-loss at ₹ 400 for a 3-month view.
Manorama Industries Ltd
Category Name | Holding Period | CMP | Buying Range | Stoploss | Target | Expected Gains % | |
Stocks to Buy for 6 Months | 6 months | 1,537 | 1,500-1,570 | 1,200 | 2,100 | 37% |
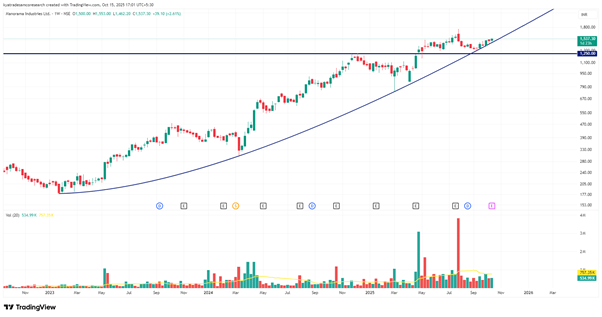
Company Overview:
Manorama Industries Ltd is a global leader in specialty fats and butters, serving the chocolate, confectionery, bakery, and personal care industries. The company processes exotic raw materials such as sal, shea, and mango kernels sourced from India and West Africa to produce high-value cocoa butter equivalents and custom fat blends for leading global FMCG players. Its sustainable sourcing, backward integration, and advanced processing gives it a strong edge in a niche, high-entry-barrier segment.
Fundamental View:
The company has delivered strong financial growth with FY25 revenue up 69% YoY to ₹771 crore and PAT nearly tripling to ₹112 crore, driven by operating leverage and cost efficiency. With low debt and a robust balance sheet, Manorama maintains a superior return profile and premium valuation supported by consistent performance and global demand for plant-based fats.
Outlook & Recommendation:
In Q1 FY26, revenue surged 117% YoY to ₹290 crore, while PAT jumped 274% YoY to ₹51 crore, aided by higher realizations and improved capacity utilization. Backed by niche leadership, strong fundamentals, and capacity expansion, we recommend Buy on Manorama Industries with an entry range of ₹1,500–₹1,570, target price of ₹2,100, and stop-loss at ₹1,200 for a 6-month horizon.
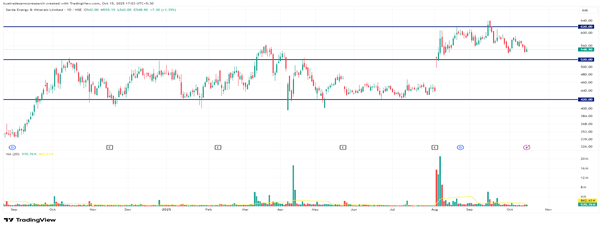
Sandur Manganese & Iron Ores Ltd
Category Name | Holding Period | CMP | Buying Range | Stoploss | Target | Expected Gains | |
Stocks to Buy for 6 Months | 6 Months | 230 | 220 - 240 | 162 | 305 | 33% |
Company Overview:
Sandur Manganese & Iron Ores Ltd is a leading integrated manganese and iron ore producer in India with operations spanning Mining, Ferroalloys and Renewable energy. The company benefits from backward integration, cost efficiency, and strong demand from steel and battery industries, reinforcing its position in the metal value chain.
Fundamental View:
Sandur Manganese trades at a P/E of 26x and EV/EBITDA of 16x, reasonable given its over 50% YoY growth in sales and PAT, far exceeding industry averages. The company maintains robust profitability with gross margins of 82%, EBITDA margin of 37%, and PAT margin of 22%. Its strong ROE (18%) and ROCE (22%), along with a healthy Debt/Equity ratio of 0.39, underline financial prudence and efficient capital management. The lower P/B of 3.7 compared to the Industry average highlights relative undervaluation and room for multiple re-rating as earnings momentum sustains.
Outlook and Recommendation:
We recommend a Buy on Sandur Manganese & Iron Ores Ltd in the range of ₹220 - ₹240, with a target price of ₹305 and a stop-loss at ₹162. Strong earnings visibility, operational efficiency, and attractive valuations make it a compelling pick for investors seeking exposure to India’s metals and mining upcycle.
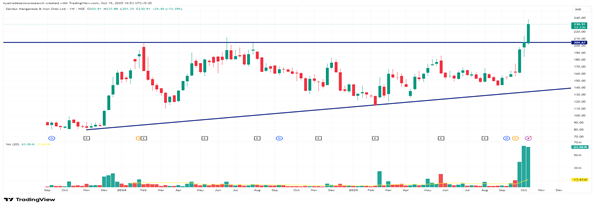
Sarda Energy & Minerals Ltd
Category Name | Holding Period | CMP | Buying Range | Stoploss | Target | Expected Gains | |
Stocks to Buy for 6 Months | 6 month | 548 | 540-560 | 446 | 943 | 72% |
Company Overview:
Sarda Energy & Minerals Ltd is an integrated metals and energy conglomerate engaged in steel, ferro alloy, mining, and captive renewable and thermal power generation. Its operations include sponge iron, steel billets, manganese alloys, and captive power supply, providing strong cross-segment synergies and cost advantages. The company benefits from its integrated model, diversified product mix, and focus on value-added steel and alloy production.
Fundamental View:
The company has delivered strong financial performance in FY25 revenue growing 20% YoY, supported by higher volumes and better realizations. In FY25, consolidated net profit rose 34% YoY to ₹702 crore, driven by operational efficiency and cost optimization. The balance sheet remains healthy with low leverage and robust asset backing, while the stock trades at around 21x P/E indicating fair valuation given its integrated operations and steady cash flows.
Outlook and Recommendation:
In Q1 FY26, Sarda reported revenue of ₹1,633 crore, up 76% YoY, and PAT of ₹437 crore, up 121% YoY, aided by strong realizations and margin expansion. With solid demand from steel, mining, and power sectors, Sarda is well-positioned for continued growth. We recommend Buy with an entry range of ₹540–₹560, target of ₹943, and stop-loss at ₹446
Epigral Ltd
Category Name | Holding Period | CMP | Buying Range | Stoploss | Target | Expected Gains | |
Mid - Small Caps for a Year | 1 Year | 1,670 | 1,650-1,700 | 1,500 | 2,400 | 44% |
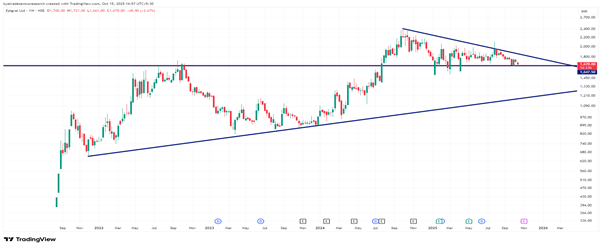
Company Overview:
Epigral Ltd (formerly Meghmani Finechem Ltd), incorporated in 2007, is one of India’s leading integrated chemical manufacturers, producing a diversified portfolio that includes Caustic Soda, Caustic Potash, Chloromethanes, Hydrogen Peroxide, Chlorine, and Hydrogen. The company is strategically transitioning its business model toward higher-margin, value-added products, leveraging its base chemicals largely for captive use to strengthen integration and profitability.
Fundamental View:
Currently, 46% of Epigral’s revenue comes from value-added products, which has propelled revenue growth by 32% and expanded EBITDA margins by 300 bps in the recent fiscal year. The management aims to increase this share to 70% of total revenue over the medium term through continuous capacity expansion and downstream integration. The company’s fixed assets have risen by nearly 25%, reflecting its focused investment in new value-added facilities and product diversification.
Outlook and Recommendation:
At the current P/E of 17x, the stock trades at nearly half the industry average and remains below its 3-year and 5-year median valuations, offering an attractive entry point. With strong earnings visibility from its expansion pipeline and improving margin mix, investors may consider accumulating the stock. We recommend buying in the range of ₹1,650–1,700 with a target of ₹2,400–2,500 with a stop-loss of ₹1,500
Subros Ltd.
Category Name | Holding Period | CMP | Buying Range | Stoploss | Target | Expected Gains % | |
Mid - Small Caps for a Year | 1 Year | 1,056 | 1,030-1,090 | 887 | 2,040 | 93% |
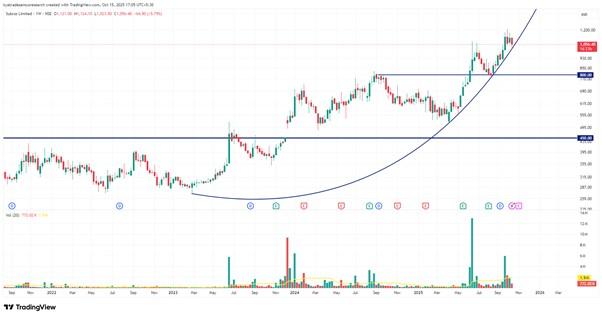
Company Overview:
Subros is a leading Indian manufacturer of thermal systems and components, serving the auto and HVAC sectors through OEM partnerships. In collaboration with global firms like Denso, it develops integrated thermal solutions for passenger vehicles, commercial vehicles, and home air-conditioning applications. Its strengths include product engineering capability, backward integration, and long-term OEM relationships, enabling better pricing and product stickiness.
Fundamental View:
Subros has delivered moderate but consistent growth. In FY25 (consolidated), revenue rose 9.7% to ₹3,368 cr from ₹3,071 cr, while PAT increased nearly 54% to ₹151 cr on strong operating leverage. EPS grew from ₹14.96 in FY24 to ₹23.00 in FY25. The company maintains low leverage and minimal interest burden, providing financial flexibility. The stock trades at 43x P/E and 6x P/B, implying moderate valuation versus auto components peers.
Outlook & Recommendation:
In Q1 FY26, Subros posted revenue of ₹878 cr, up 8.4% YoY, and net profit of ₹41 cr, a rise of 17% YoY. Margins remained stable. With the global auto and EV wave expected to accelerate demand for efficient thermal systems, Subros is well-positioned to benefit. We recommend Buy at ₹1,030–1,090 with a target of ₹2,040 and stop-loss ₹887.
Techno Electric & Engineering Company Ltd
Category Name | Holding Period | CMP | Buying Range | Stoploss | Target | Expected Gains | |
Mid - Small Caps for a Year | 1 Year | 1,357 | 1,350-1400 | 1,200 | 2,000 | 47% |
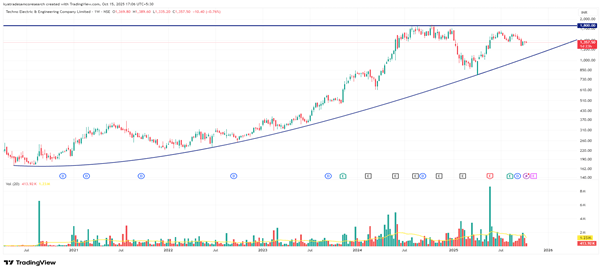
Company Overview:
Techno Electric & Engineering Company Ltd (TEECL) is a well-established player in the power infrastructure space, providing EPC services in the power transmission and distribution (T&D) segment, along with a growing presence in smart metering and data centre solutions.
Fundamental View:
The company has delivered a 31% revenue CAGR and 17% profit CAGR over the past three years, driven by strong project execution and diversification into emerging digital infrastructure. For FY25, management has guided 50% revenue growth and 37% profit growth, reflecting a healthy order book and traction in newer business verticals. TEECL is strategically positioned in two high-growth sectors — smart metering and data centres. With the government mandating 225 million smart meters, of which only 10% has been executed, the opportunity pipeline remains large. On the data centre front, the company plans to develop over 250 MW of AI-ready hyperscale and edge facilities over the next five years, potentially transforming its earnings profile while providing long-term visibility and margin expansion.
Outlook & Recommendation:
At current P/E of 36x it is trading below its 3-year median, the stock offers valuation comfort. Investors can consider accumulating at ₹1,350–1,400, with an upside target of ₹2,000–2,100 and a stop-loss at ₹1,180–1,200.
Adani Power Ltd
Category Name | Holding Period | CMP | Buying Range | Stoploss | Target | Expected Gains | |
Bluechips to Buy for a Year | 1 Year | 157 | 145-152 | 120 | 240 | 53% |
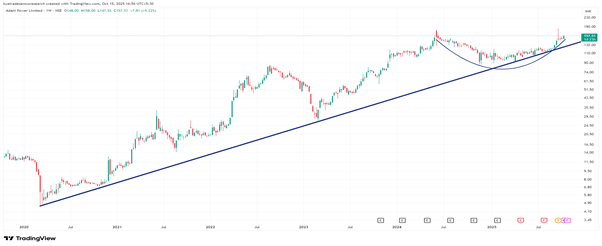
Company Overview:
Adani Power Ltd stands as one of India’s largest private-sector thermal power producers, with an installed capacity of 18,150 MW spread across strategically located plants. The company operates primarily through long-term power purchase agreements (PPAs) ensuring steady base-load revenues, while its participation in merchant power sales adds an element of flexibility and upside during periods of strong demand.
Fundamental View:
In FY25, the company reported consolidated revenue of ₹56,203 crore, reflecting 11.6% YoY growth, while EBITDA surged 17.5% YoY to ₹21,418 crore, supported by improved fuel cost optimization and higher plant load factors. Margins saw modest expansion as operational efficiencies improved, and the company’s leverage profile strengthened through cash flow monetization and disciplined debt reduction, easing interest cost pressures.
Outlook & Recommendation:
From a valuation standpoint, Adani Power trades at a trailing P/E of 22–23x and EV/EBITDA of 14–15x — a premium to public-sector peers, justified by its superior earnings visibility, balance sheet improvement, and growth trajectory. The company remains well positioned to benefit from rising power demand and capacity expansion in renewable and hybrid projects over the medium term. One must look to add in a range of 145-152 with a target of 230-240 and a stop loss of 120.
Maithan Alloys Ltd
Category Name | Holding Period | CMP | Buying Range | Stoploss | Target | Expected Gains % | |
Stocks for Long Term | 1 Year | 1,107 | 1,090-1,130 | 832 | 1,700 | 54% |
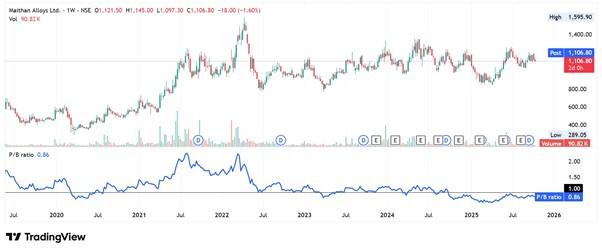
Company Overview:
Maithan Alloys Limited is one of India’s leading manufacturers and exporters of niche value-added manganese alloys. It continues to exhibit strong financial resilience backed by prudent capital allocation.
Fundamental View:
The company has delivered an impressive PAT CAGR of 30% over the past decade, underscoring its operational efficiency and industry leadership.
It operates with minimal leverage with a debt-to-equity ratio of 0.16. It maintains a robust balance sheet and strong liquidity position. With a market capitalization of ₹3,206 crore, the company holds investments exceeding ₹3,056 crore, almost equivalent to its entire market value offering substantial value for investors.
Outlook & Recommendation:
At current levels, the stock trades at compelling valuations, with a P/E of 4.51 and P/B of 0.86, reflecting a 50% discount to its 10-year average P/B multiple. The historical trend, as seen in the attached chart, highlights the cyclical nature of its Price-to-Book movements, where valuations below 1 P/B have historically preceded strong price rebounds. Given the company’s healthy financials, strong investment portfolio, and attractive valuation metrics, Maithan Alloys emerges as a classic value opportunity. We recommend Buy at ₹1,090–1,130 with a target of ₹1,700 and stop-loss ₹832.
Summary
Stock Name | Category Name | Holding Period | Current Market Price | Buying Range | Stoploss | Target | Expected Gains % |
Gold Bees | Tactical ETF Bets | 1 Year | 105 | 100-108 | 90 | 150 | 43% |
Fiem Industries Ltd. | Mid/Small caps to Buy for 3 Months | 3 months | 1,975 | 1,950-2,000 | 1,780 | 2,400 | 22% |
Hindustan Zinc | Mid/Small caps to Buy for 3 Months | 3 months | 513 | 505-515 | 400 | 700 | 36% |
Manorama | Stocks to Buy for 6 Months | 6 months | 1,537 | 1,500-1570 | 1,200 | 2,100 | 37% |
Sandur Manganese & Iron Ores Ltd. | Stocks to Buy for 6 Months | 6 months | 230 | 220 - 240 | 162 | 305 | 33% |
Sarda Energy & Minerals Ltd. | Stocks to Buy for 6 Months | 6 months | 548 | 540-560 | 446 | 943 | 72% |
Epigral Ltd | Mid - Small Caps for a Year | 1 Year | 1,670 | 1650-1700 | 1,500 | 2,400 | 44% |
Subros Ltd. | Mid - Small Caps for a Year | 1 Year | 1,056 | 1,030-1,090 | 887 | 2,040 | 93% |
Techno Electric and Engineering | Mid - Small Caps for a Year | 1 Year | 1,357 | 1350-1400 | 1,200 | 2,000 | 47% |
Adani Power | Bluechips to Buy for a Year | 1 Year | 157 | 145-152 | 120 | 240 | 53% |
Maithan Alloys Ltd. | Stocks for Long Term | 1 Year | 1,107 | 1090-1130 | 832 | 1,700 | 54% |


 Easy & quick
Leave A Comment?