


What are Chart Patterns?
Chart Patterns are graphical representations of the price action of different stocks and securities in the market. These patterns are created using various types of charts, which is why there are many different types of chart patterns in the stock market.
If you are trading in the market, learning to read chart patterns can give you a clearer understanding of recent price movements. This helps you to assess potential future trends, enabling to make informed trading decisions based on expected price behaviour.
Types of Chart Patterns
Depending on the type of chart used to represent price movement, the following are the main types of chart patterns available to traders:
- Line Chart Patterns
Line chart patterns are among the simplest and most commonly used tools to identify trends in the stock market. They are formed by connecting the closing prices over a specific period, resulting in a smooth line that reflects price direction.
You can use line charts to identify trend reversals, continuation patterns, support and resistance zones, and overall market direction. They work particularly well for swing trading, where spotting long-term trends and breakout levels is key.
- Bar Chart Patterns
Bar chart patterns offer a more detailed view of price action by showing the open, high, low, and close for each time period. Each bar provides more information than a line chart and can help traders read market structure more closely.
These patterns are useful in identifying market sentiment, trend continuation, and potential reversals. Chart patterns for options trading and swing trading often rely on bar charts to time entries and exits more precisely. They are ideal for traders who prefer a more structured, analytical approach.
- Candlestick Chart Patterns
Candlestick patterns are widely popular because they provide deep insights into price action and trader psychology in a visually intuitive format. Each candlestick shows the open, high, low, and close, with colored bodies indicating bullish or bearish sentiment.
Popular candlestick formations include Doji, Engulfing, Hammer, and Morning Star. These patterns help traders identify trend reversals, continuation setups, and breakout opportunities. Candlestick analysis is especially effective for options and intraday trading, where timing and precision matter most.
The Importance of Chart Patterns in Trading
The different types of chart patterns are important because they help you make informed decisions about trading. Here are the key reasons such patterns are crucial for traders.
Predicting Market Trends
Chart patterns play a crucial role in identifying market trends and anticipating potential price movements. Recognising the different types of chart patterns in the stock market can make it easier for you to trade smartly, whether you are looking for breakouts, reversals or trend continuations. This, in turn, enhances risk management and improves the timing of trades.
Improving Swing Trading Strategies
Chart patterns for swing trading help spot entry and exit points with precision, so you can capitalise on short-term and medium-term price movements more effectively. You can identify patterns like flags, pennants and triangles — and frame strategies that maximise gains and minimise potential losses by providing clear indications of trend strength and reversals.
Optimising Intraday Trading Decisions
Intraday traders rely on quick and accurate pattern recognition to make fast trading decisions. Chart patterns for intraday trading make it easier to gauge market momentum and strategies quickly. By analysing these patterns, one can take advantage of short-term price fluctuations and execute timely trades that have a higher probability of success.
Chart Patterns for Swing Trading
Cup and Handle Pattern
Definition:
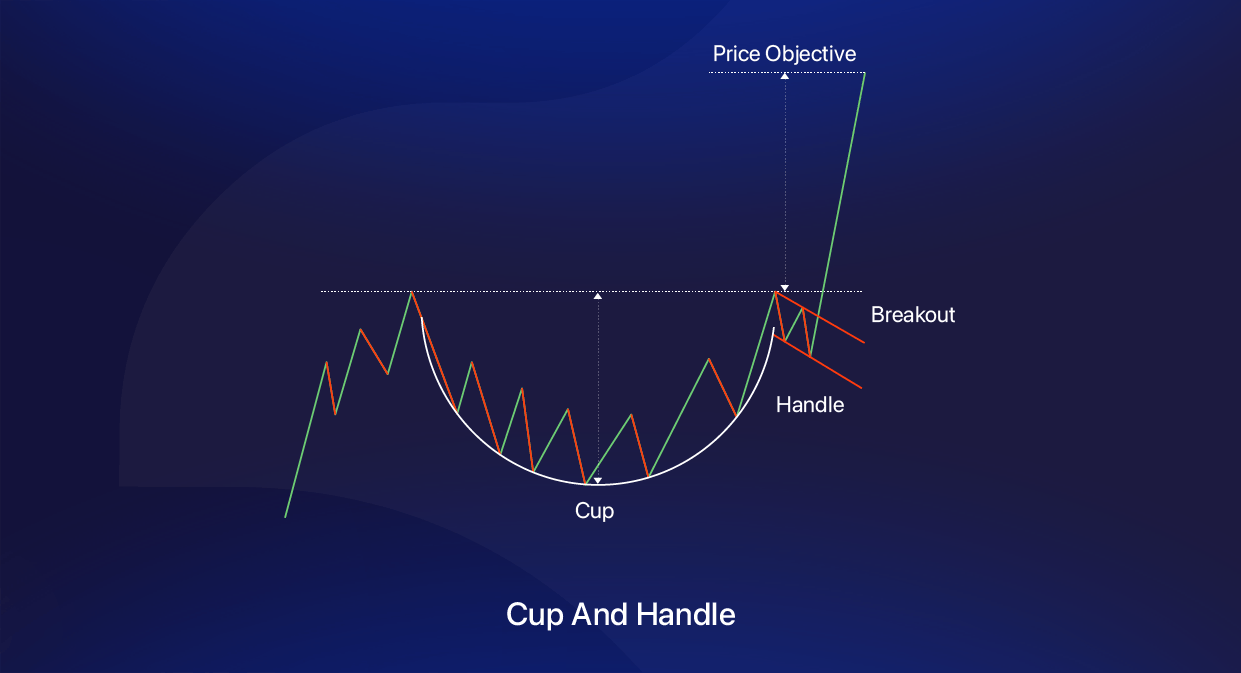
The Cup and Handle is a classic bullish continuation chart pattern that resembles the shape of a teacup. It is characterized by a “U”-shaped base (the cup) followed by a slight downward or sideways consolidation (the handle), eventually culminating in a breakout to the upside.
Visual Structure:
Cup: A smooth, rounded bottom that reflects a phase of accumulation, where selling pressure gradually subsides and buyers start to dominate. It often takes weeks to months to form, especially on higher time frames.
Handle: A short consolidation phase that slightly drifts downward or sideways, representing a pause before the next bullish leg. This often forms due to mild profit booking or market hesitation before a breakout.
Breakout: The breakout occurs when price decisively moves above the handle's resistance, confirming the pattern and triggering a bullish move.
Key Characteristics:
- The cup should ideally be rounded and not V-shaped, indicating a healthy base formation.
- The handle should not retrace more than 1/3rd of the cup’s height.
- Volume generally contracts during the cup and handle formation and expands on the breakout, adding conviction.
Trading Strategy:
Entry: Initiate a long position when the price breaks above the handle’s resistance with strong volume.
Stop-loss: Place it just below the lower end of the handle to manage risk.
Target: The minimum price target is calculated by adding the depth of the cup to the breakout level, though it can often exceed this in trending markets.
Use in Multiple Time Frames
This pattern is most reliable on daily and weekly charts, but intraday traders also use it with shorter durations like 15-minute or hourly charts—especially when aligned with broader bullish trends.
Rounding Bottom / Saucer Bottom Pattern
Definition:
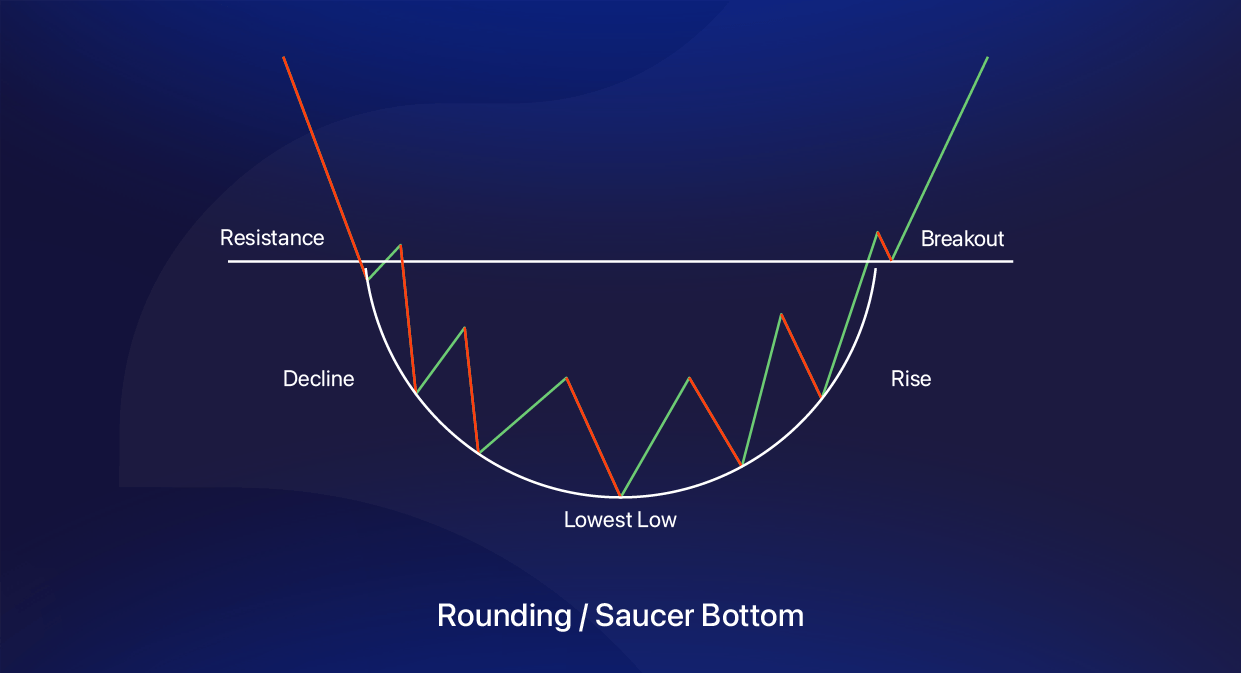
The Rounding Bottom is a bullish reversal chart pattern that indicates a gradual shift from a downtrend to an uptrend. It features a smooth, bowl-like shape that represents slow accumulation over time, eventually leading to a breakout. This pattern is often seen after prolonged declines and signals a long-term change in trend.
Visual Structure:
The pattern begins with a slow decline, flattens out at the bottom, and then transitions into a gradual rise. It forms a wide “U” shape. The breakout happens when the price crosses above the resistance created by the initial high on the left side of the base. Post-breakout, price often accelerates higher with increased participation.
Key Characteristics:
• Lacks sharp swings; price movement is smooth and rounded
• Volume is typically low during the formation and increases near the breakout
• The resistance or neckline is usually flat or slightly descending
Trading Strategy:
Entry: Enter long when the price breaks out above the neckline (resistance) with a noticeable increase in volume
Stop-loss: Place just below the midpoint or lower third of the base to protect against false breakouts
Target: Measure the depth from the base to the neckline and project the same distance above the breakout level
Use in Multiple Time Frames:
Most reliable on daily and weekly charts, indicating long-term bottom formation. On lower time frames like hourly or 15-minute charts, it can suggest intraday base building before a directional move.
Head and Shoulders Pattern
Definition:
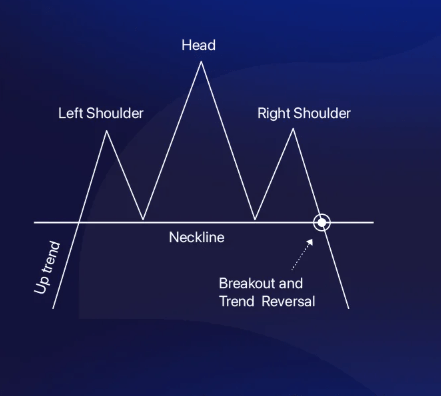
The Head and Shoulders is a bearish reversal pattern that appears after an uptrend and signals a potential trend change. It consists of three peaks: a higher peak (head) between two lower and similar peaks (shoulders). The pattern is completed when the price breaks below the neckline, indicating the start of a downtrend.
Visual Structure:
The pattern starts with a rise to form the left shoulder, followed by a higher high forming the head. Then, a third rise forms the right shoulder, which is typically similar in height to the left shoulder. A horizontal or slightly sloped support line connects the lows between these peaks, known as the neckline. A breakdown below this neckline confirms the pattern.
Key Characteristics:
• Clearly visible left shoulder, head, and right shoulder formation
• The neckline acts as a critical support; breaking it confirms the pattern
• Volume generally declines during the formation and increases on breakdown
• The right shoulder should ideally form on lighter volume compared to the left
Trading Strategy:
Entry: Enter a short trade once the price breaks below the neckline with increased volume
Stop-loss: Place above the right shoulder to manage risk
Target: Measure the vertical distance from the head to the neckline and subtract it from the breakout point
Use in Multiple Time Frames:
Highly effective on daily and weekly charts for spotting medium-to-long term trend reversals. Works on lower time frames too, especially when aligned with broader trend weakness.
Inverse Head and Shoulders Pattern
Definition:
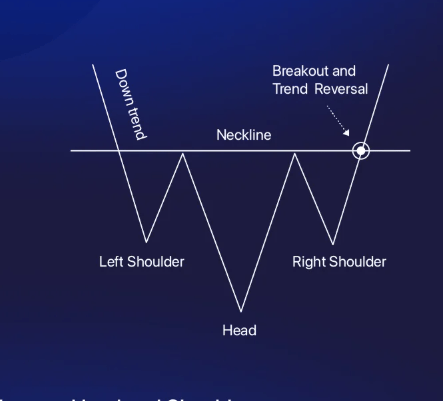
The Inverse Head and Shoulders is a bullish reversal pattern that forms after a downtrend and signals a shift to an uptrend. It mirrors the traditional head and shoulders pattern but in an inverted form, featuring three troughs instead of peaks.
Visual Structure:
The pattern begins with a decline forming the left shoulder, followed by a deeper low (the head), and then a higher low forming the right shoulder. A resistance line connects the highs between the troughs — this is the neckline. A breakout above this neckline confirms the reversal.
Key Characteristics:
• Consists of three troughs with the head being the lowest point
• The neckline serves as key resistance; a breakout confirms the pattern
• Volume tends to contract during the formation and expand on breakout
• Right shoulder often forms on reduced selling pressure, hinting at a shift in sentiment
Trading Strategy:
Entry: Go long when price breaks out above the neckline on strong volume
Stop-loss: Set just below the right shoulder low
Target: Measure the distance from the head to the neckline and project it upward from the breakout point
Use in Multiple Time Frames:
Best suited for daily and weekly time frames to capture long-term trend reversals. Intraday traders can also apply this pattern on 15-minute to hourly charts when near key support zones or after significant downtrends.
Triangle Patterns
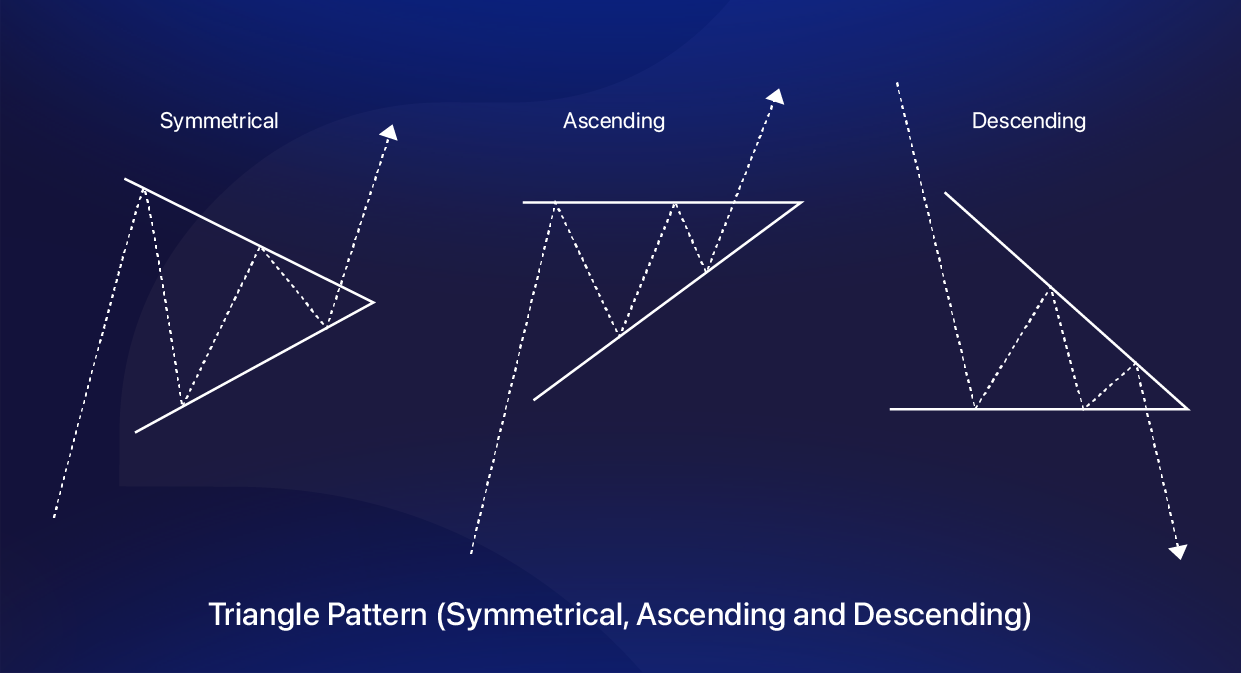
Symmetrical Triangle
A neutral pattern formed by two converging trendlines—lower highs and higher lows—indicating a consolidation phase. It represents market indecision, with a breakout likely in the direction of the prior trend but not guaranteed.
Ascending Triangle
A bullish continuation pattern formed by a flat upper resistance line and a rising support line. It reflects increasing demand and typically resolves in an upward breakout as buyers gain control.
Descending Triangle
A bearish continuation pattern with a flat support line and a falling resistance line. It suggests persistent selling pressure and often breaks down below the support line, signaling trend continuation.
Visual Structure
All triangle patterns are formed by converging trendline that narrow the price range over time. In a symmetrical triangle, both trendlins slope toward each other. In an ascending triangle, the upper line is horizontal while the lower line slopes upward. In a descending triangle, the lower line is flat while the upper line slopes downward. Volume tends to decrease as the pattern develops and rises sharply on breakout.
Key Characteristics
• Price compresses toward the apex of the triangle
• Volume usually fades during formation and increases sharply during breakout
• Breakouts often occur between the two-thirds and three-quarters point of the pattern
• Ascending triangles usually resolve higher, descending triangles lower, while symmetrical triangles may break in either direction
• The potential price target is estimated by measuring the height of the base and projecting it from the breakout point
Trading Strategy
Entry: For ascending triangles, go long above resistance breakout. For descending triangles, short below support breakdown. For symmetrical triangles, trade in the direction of the breakout confirmed by volume.
Stop-loss: Can be placed just outside the opposite end of the triangle—below the breakout point in bullish patterns and above it in bearish ones.
Target: Project the vertical height of the triangle from the breakout point in the direction of the move.
Use in Multiple Time Frames
Triangle patterns are versatile and appear across all time frames. They are especially effective when aligned with the broader trend. Symmetrical triangles often signal volatility contraction, ascending triangles signal bullish accumulation, and descending triangles indicate distribution or bearish pressure.
Double Top / Triple Top Patterns
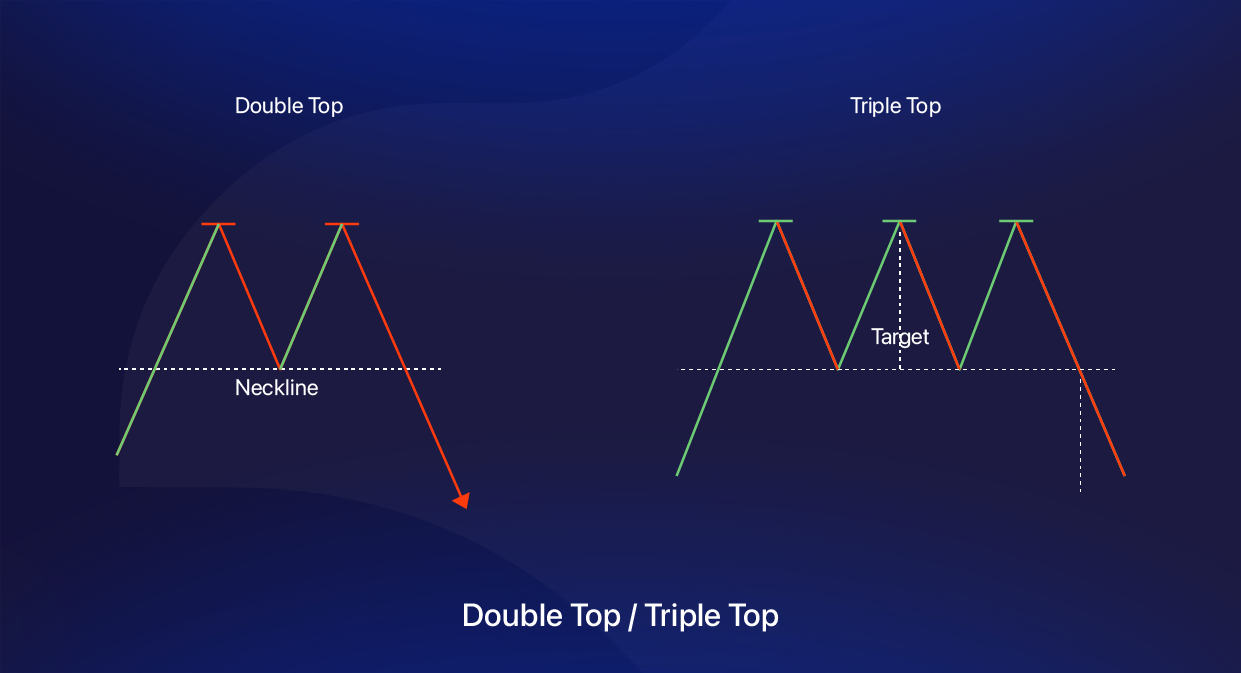
Double Top
The Double Top is a bearish reversal pattern that forms after an extended uptrend. It consists of two peaks at nearly the same level, separated by a moderate trough. The pattern is confirmed when the price breaks below the intermediate support (the neckline), suggesting a shift from buying to selling pressure.
Triple Top
The Triple Top is a more extended bearish reversal pattern featuring three peaks at a similar level, divided by two intermediate lows. It signifies a stronger resistance zone and prolonged distribution, with confirmation occurring when the price breaks below the support level created between the troughs.
Visual Structure
Both patterns represent an inability to break through a resistance zone despite multiple attempts. The price forms either two (Double Top) or three (Triple Top) peaks, creating a horizontal resistance. The neckline or support is drawn through the lows between these peaks. Once price breaches this neckline, the pattern is considered complete, indicating a trend reversal.
Key Characteristics
• Appears after a sustained uptrend, signaling exhaustion of buying interest
• Peaks in both patterns occur at nearly the same level, showing strong resistance
• Volume generally decreases on each rally attempt and rises on the breakdown
• The more time taken to form the tops, the stronger the reversal signal
• Triple tops offer higher reliability due to more failed attempts at resistance
Trading Strategy
Entry: Enter short after the price breaks below the neckline with confirmation via increased volume
Stop-loss: Place just above the last peak (second top in Double Top, third in Triple Top)
Target: Measure the distance from the peak to the neckline and subtract it from the breakout level to estimate the downside objective.
Double Bottom / Triple Bottom Patterns
Double Bottom
The Double Bottom is a bullish reversal pattern that appears after a prolonged downtrend. It features two distinct troughs at a similar price level, separated by a peak or resistance zone. The pattern is confirmed once the price breaks above the resistance formed between the bottoms, indicating a shift from supply to demand.
Triple Bottom
The Triple Bottom is a more prolonged bullish reversal pattern formed by three similar lows, with two intervening rallies in between. It reflects sustained accumulation and buyer resilience, with a breakout above the resistance confirming the end of the downtrend.
Visual Structure
Both patterns show repeated failures to break below a key support level. In a Double Bottom, price declines, rebounds, tests the support again, and then rallies above the neckline. In a Triple Bottom, the price tests the same support zone three times, forming a stronger base. The breakout occurs once the neckline or horizontal resistance is breached with volume support.
Key Characteristics
• Appears after a significant downtrend, signaling potential trend reversal
• Troughs form near the same support level, showing strong buying interest
• Volume often rises during the rallies and especially on the breakout
• The more retests of support, the stronger the base and the reliability of the pattern
• Momentum indicators like RSI or MACD often show bullish divergence during the second or third bottom
Trading Strategy
Entry: Go long once the price breaks above the neckline or resistance with high volume
Stop-loss: Place below the lowest bottom (second in Double, third in Triple) to limit downside risk
Target: Measure the vertical distance between the bottoms and the neckline, and project the same distance above the breakout point.
Flag Patterns
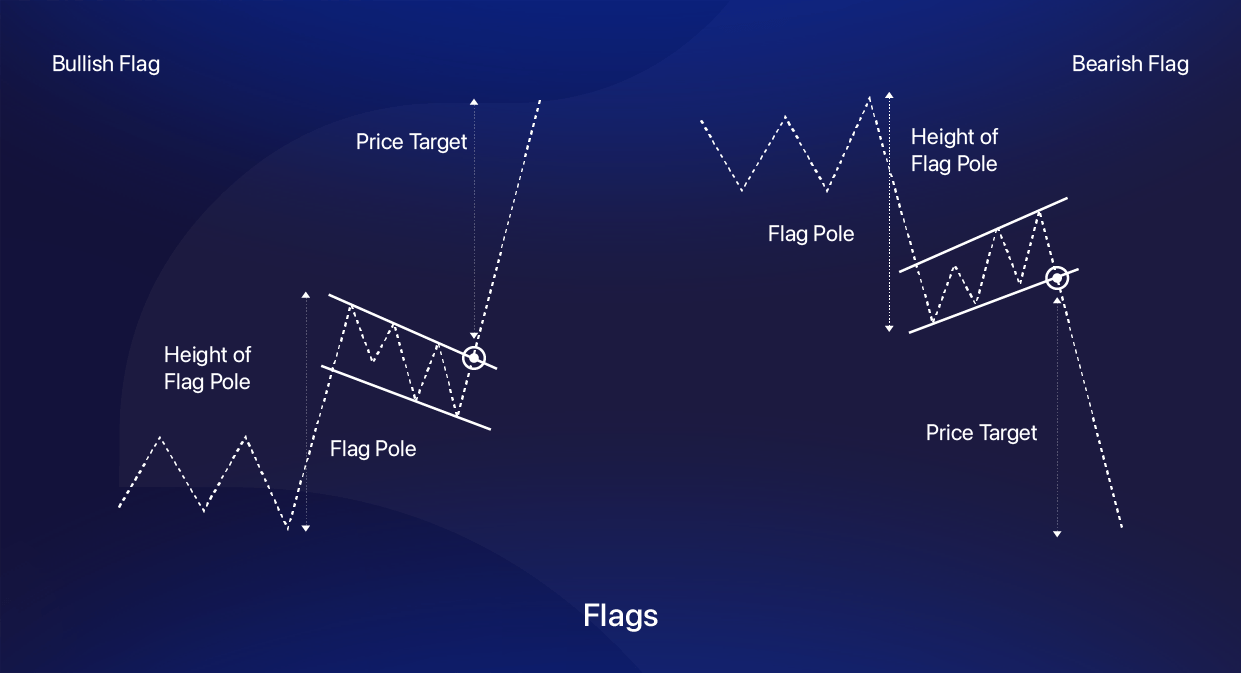
Bullish Flag
A Bullish Flag is a continuation pattern that forms after a sharp upward price move. It represents a brief consolidation phase where the price trends slightly downward or sideways, enclosed within parallel lines. The breakout above the upper boundary signals the continuation of the uptrend.
Bearish Flag
A Bearish Flag is the bearish counterpart that forms after a steep downward price move. It shows a temporary upward or sideways retracement before the price breaks below the lower boundary, indicating trend continuation to the downside.
Visual Structure
The pattern begins with a strong directional move known as the flagpole. This is followed by a brief consolidation that moves against the trend but remains contained within two parallel trendlines, forming the flag. The breakout occurs when price resumes the direction of the initial trend, breaking out of the flag range with momentum and volume.
Key Characteristics
• Sharp, impulsive flagpole sets the tone for trend strength
• The flag portion tilts slightly against the prevailing trend — downward in bullish flags and upward in bearish flags
• Volume usually declines during the flag formation and expands during breakout
• Flags are generally short-term patterns but highly reliable when well-formed
• The breakout should be accompanied by a surge in volume for confirmation
Trading Strategy
Entry: For bullish flags, enter on a breakout above the upper boundary; for bearish flags, enter on a breakdown below the lower boundary
Stop-loss: Place below the lower end of the flag in bullish patterns or above the upper end in bearish setups
Target: Measure the length of the flagpole and project it from the breakout point in the direction of the trend.
Pennant Patterns
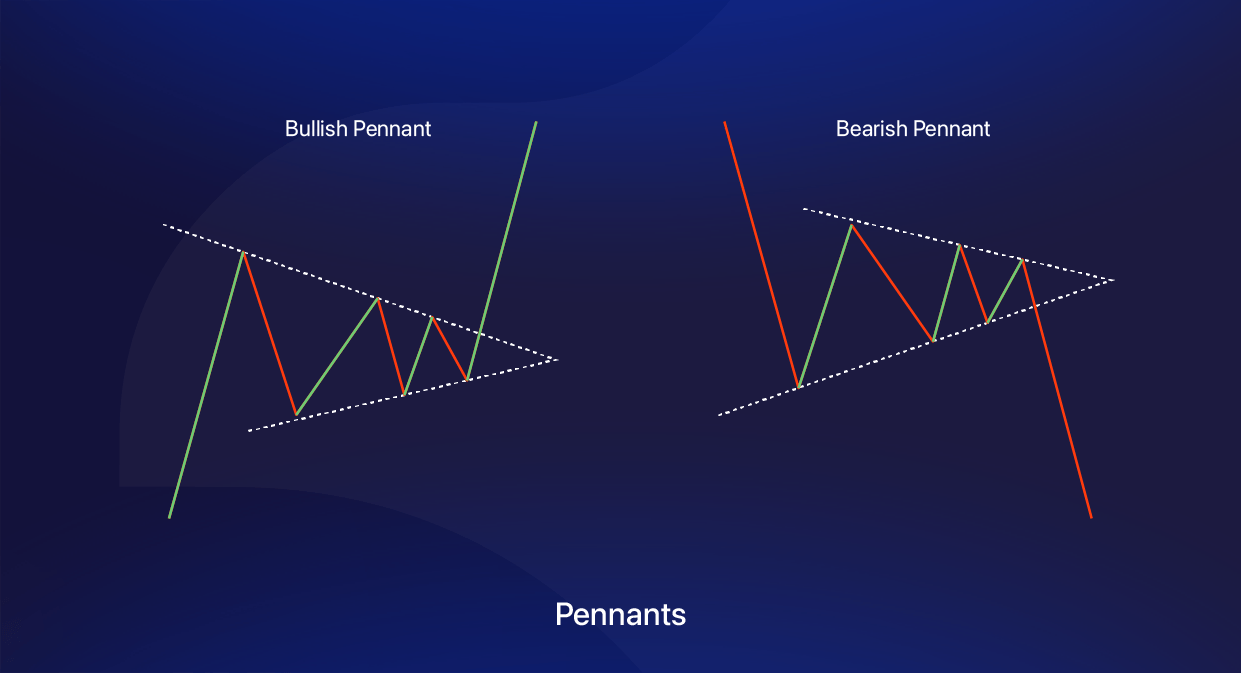
Bullish Pennant
A Bullish Pennant is a continuation pattern that forms after a sharp price rally. It represents a brief consolidation where the price compresses within converging trendlines, forming a small symmetrical triangle. A breakout above the upper boundary confirms the continuation of the prior uptrend.
Bearish Pennant
A Bearish Pennant appears after a sharp price decline and takes the form of a narrow, symmetrical triangle sloping slightly upward or sideways. A breakdown below the lower boundary signals the resumption of the downtrend.
Visual Structure
Pennants begin with a strong directional move called the flagpole. This is followed by a short consolidation phase where price coils within converging trendlines. Unlike flags, which are rectangular, pennants are triangular and reflect tightening price action. The breakout or breakdown happens quickly and usually leads to another strong leg in the direction of the prior move.
Key Characteristics
• Preceded by a sharp price move (the flagpole)
• The consolidation is brief and bounded by converging trendlines, forming a small triangle
• Volume diminishes during the formation and spikes on breakout
• Pattern is generally short-term and appears during strong trends
• Considered more explosive than flags due to the tight range and rapid resolution
Trading Strategy
Entry: For bullish pennants, enter on breakout above the upper trendline; for bearish pennants, enter on breakdown below the lower trendline
Stop-loss: Place just outside the opposite side of the pennant (below for bullish, above for bearish)
Target: Measure the height of the flagpole and project it from the breakout or breakdown point
Wedge Pattern
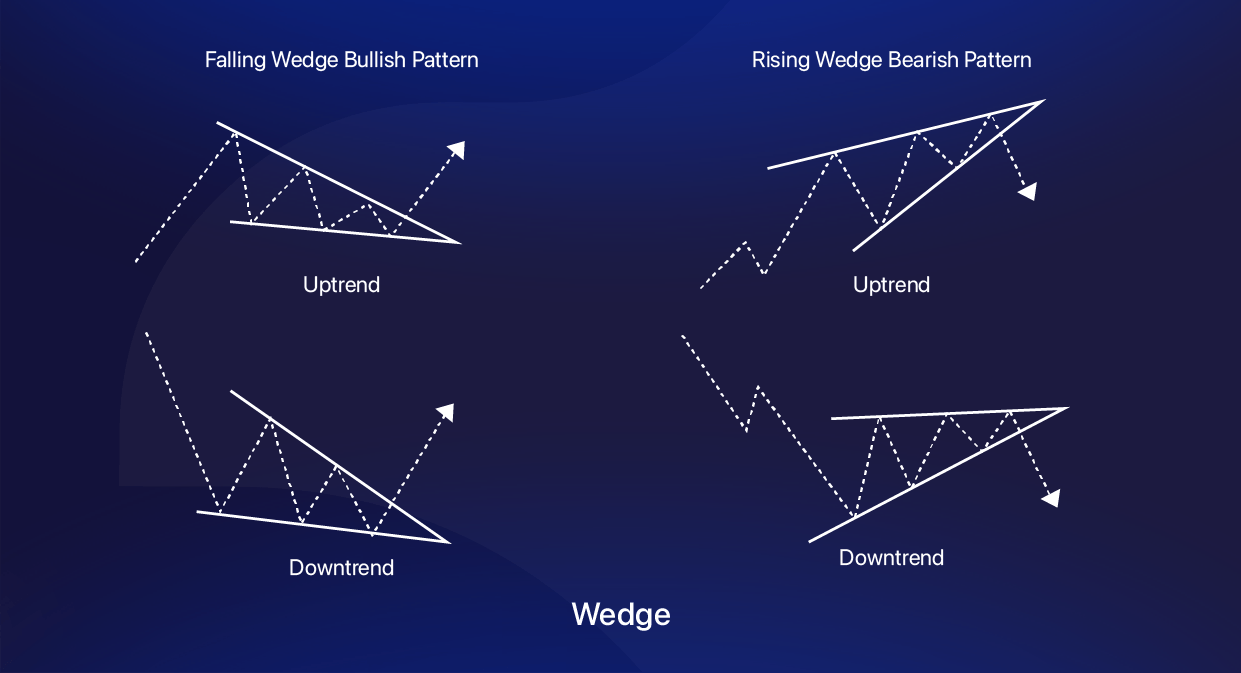
Rising Wedge – Bearish Pattern
This is the more common interpretation of a rising wedge. It forms after an uptrend or during a bounce in a downtrend. The price contracts between two upward-sloping trendlines, with the lower trendline rising more steeply. It signals weakening bullish momentum and often results in a breakdown, or continuation of a downtrend.
Rising Wedge – Bullish Pattern
In certain contexts, especially within strong, sustained uptrends or during consolidation phases, a rising wedge can act as a bullish continuation pattern. In such cases, indicating trend acceleration rather than exhaustion.
Visual Structure
The price makes higher highs and higher lows within two converging, upward-sloping trendlines. The wedge narrows as buying pressure slows. In bearish setups, the breakdown below the lower trendline confirms the pattern. In bullish scenarios, a breakout above the upper line suggests renewed strength. Volume typically dries up within the wedge and expands on breakout or breakdown.
Key Characteristics
• The wedge tilts upward, with contracting price action
• Volume decreases as the pattern develops and rises sharply on the breakout/breakdown
• Often forms near resistance zones or after steep rallies or pullbacks
Trading Strategy
Entry:
- Bearish: Enter short on breakdown below the support trendline
- Bullish: Enter long on breakout above the resistance trendline
Stop-loss:
How to Use Chart Patterns Effectively in Trading
Now that you're familiar with key chart patterns for options trading and swing trading, it’s essential to understand how to apply them with precision. Below are some crucial tips to help you use these patterns more effectively in real-market scenarios.
Align Patterns with Your Trading Strategy
Each pattern serves a purpose—some signal reversals, others continuation. Recognizing the type of pattern that suits your trading style (whether swing, options, or intraday) ensures better alignment with market conditions. This strategic fit enhances accuracy and helps you avoid reacting to random price fluctuations.
Pair Patterns with Technical Indicators
Chart patterns gain strength when used alongside indicators. Tools like Moving Averages, RSI, and MACD offer valuable confirmation, helping filter out false signals. This combination improves the reliability of your trades and boosts your decision-making confidence.
Enhance Entry and Exit Timing
Especially in options trading, timing can make or break your strategy. Chart patterns like triangles or flags can help you anticipate breakouts, improving your entry precision. This edge can be crucial when selecting strike prices and expiry dates to capitalize on price swings and volatility.
Apply Patterns for Fast-Paced Intraday Moves
In intraday trading, speed and clarity are everything. Recognizing high-probability setups like double tops, head and shoulders, or bearish flags allows you to react swiftly to shifts in momentum. With proper mastery, these patterns can guide your stop-loss placement and profit-taking decisions in real-time.
NOTE:
- Chart patterns should not be traded in isolation. Always confirm with volume, indicators, or trend context. Some patterns may fail- this is why risk management and confirmation are key.
- By mastering key chart patterns and combining them with sound technical indicators, traders can improve timing, enhance strategy precision, and increase the odds of success in volatile markets.


 Easy & quick
Leave A Comment?