


The Sensex-to-Gold ratio is back at long‑term support, historically a zone where equities have outperformed gold in subsequent months, suggesting a favorable risk‑reward skew toward equities if the support holds.
What the ratio signals
- The ratio measures equity strength versus gold; at support, equities appear relatively attractive on a multi‑year view.
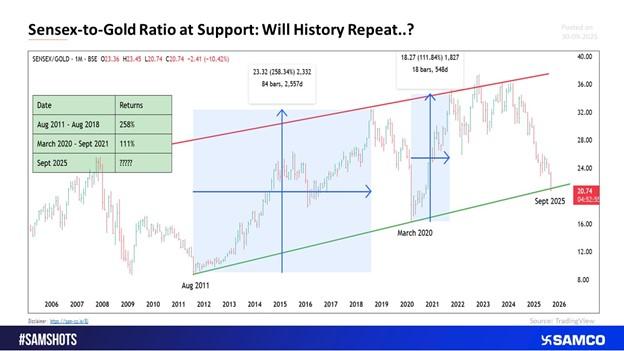
- Prior rebounds from this zone in 2011 and 2020 preceded strong equity leadership phases.
What history shows
- August 2011 touchpoint: A multi‑year advance followed, aligning with a powerful equity cycle.
- March 2020 touchpoint: A swift post‑pandemic equity outperformance phase unfolded through 2021.
September 2025 setup
- The ratio has returned to the same rising trendline support, creating a technically similar backdrop to prior cycles.
- If support holds and the channel persists, equities are positioned to gain relative to gold.
How to act prudently
- Staggered rotation: Gradually tilt toward equities while the ratio bases at support to reduce timing risk.
- Confirmation cues: Prefer a higher low in the ratio and a break above recent swing highs in equities before increasing risk.
- Invalidations: A decisive weekly close below the trendline argues for patience or hedges.
Portfolio ideas
- Core equity exposure: Add via broad large‑cap allocation, scaling entries over several weeks.
- Quality barbell: Overweight profitable, high‑ROCE leaders; keep a selective cyclical sleeve for potential breadth.
- Gold stance: Shift from overweight to neutral/underweight tactically, but retain a strategic ballast for hedging.
Risks to track
- Earnings and growth: Sustained EPS upgrades support equity leadership; disappointments could cap the signal.
- Currency and real yields: A stronger dollar or rising real yields can buoy gold and blunt equity relative gains.
- Liquidity and policy: Domestic liquidity, fiscal cadence, and flow events can amplify or fade the signal.
Practical trading plan
- Entries: 3–4 tranches—on weakness near support and on confirmation higher.
- Review cadence: Reassess weekly; tighten risk if the ratio fails to bounce in 2–4 weeks or closes below support.
Key caveats
- Past performance is not a guarantee; macro drivers in 2011–2018 and 2020–2021 were unique.
- The ratio is relative: equities can “outperform” even if both assets fall—position sizing and risk control remain essential.


 Easy & quick
Leave A Comment?