
 Nifty 50 Price to Earnings (PE) ratio helps you understand the real value of the stock market. Is the market overvalued? Should you book your profits in the market? Or is it undervalued and a great buying opportunity?
Nifty 50 PE ratio is the amount paid by investors to earn one rupee of earnings in Nifty 50 companies. It compares current market price with total earnings of all the fifty companies. The PE ratio of Nifty on 20th May 2021 was 29.59. This means that investors are paying Rs 29.59 to earn one rupee of earnings.
Seems quite high, doesn’t it?
Historically, a Nifty 50 PE ratio of more than 25 means the market is overvalued. Before the 2008 market crash, the Nifty PE ratio was 28.29.
And we all know what happened next.
Nifty fell from 6,288 on 8th January 2008 to 2,524 on 27th October 2008. That’s a fall of 60% in nine months!
With a PE ratio of 29.59, Nifty is already in the overvalued zone. So, what should investors do next? Is this the time to book profits? Will history repeat itself? Is a correction in the Nifty around the corner?
You will be able to answer all these questions once you learn to analyse the PE ratio of Nifty.
Nifty 50 Price to Earnings (PE) ratio helps you understand the real value of the stock market. Is the market overvalued? Should you book your profits in the market? Or is it undervalued and a great buying opportunity?
Nifty 50 PE ratio is the amount paid by investors to earn one rupee of earnings in Nifty 50 companies. It compares current market price with total earnings of all the fifty companies. The PE ratio of Nifty on 20th May 2021 was 29.59. This means that investors are paying Rs 29.59 to earn one rupee of earnings.
Seems quite high, doesn’t it?
Historically, a Nifty 50 PE ratio of more than 25 means the market is overvalued. Before the 2008 market crash, the Nifty PE ratio was 28.29.
And we all know what happened next.
Nifty fell from 6,288 on 8th January 2008 to 2,524 on 27th October 2008. That’s a fall of 60% in nine months!
With a PE ratio of 29.59, Nifty is already in the overvalued zone. So, what should investors do next? Is this the time to book profits? Will history repeat itself? Is a correction in the Nifty around the corner?
You will be able to answer all these questions once you learn to analyse the PE ratio of Nifty.
In this article:
| 1. What is Nifty 50 PE Ratio? 2. How to Analyse Nifty 50 PE Ratio?. 3. Four Key Indicators to Decipher Market Valuations. 4. FAQs on Nifty 50 PE ratio. |
What is Nifty 50?
Nifty 50 is the benchmark index of the National Stock Exchange of India (NSE). It contains 50 of the biggest stocks in the country. These stocks belong to sectors like – Financial Services, Information & Technology (IT), Banking etc. [Read More: Nifty 50 Companies List]What is Price to Earnings Ratio?
PE ratio of a company is a comparison between its market price and earnings per share (EPS). It is also known as price multiple or earnings multiple. It tells you how much money investors are paying to earn one rupee of the company’s earnings. It is calculated by dividing a company’s current market price by its EPS. For example: The share price of Amara Raja Batteries Ltd is Rs 744 on 29th May 2021. Its EPS is Rs 37.90. So, its PE ratio is (Rs 744/ Rs 37.90). This means that investors are paying 19.63 rupees to earn one rupee of Amara Raja Batteries Ltd.’s earnings. In comparison, the PE ratio of BOSCH Ltd is 44. So, Amara Raja Batteries Ltd looks undervalued. This is how PE ratio helps you decide a stock’s true value. Similarly, the PE ratio of Nifty or Sensex tells you how the index is valued. [Read More: How to Use Sensex PE Ratio to Master the Stock Market – A Guide to Sensex PE]What is Nifty 50 PE Ratio?
The average Nifty 50 PE ratio is 20. A Nifty 50 PE ratio of more than 25 means an expensive market and investors often book profits at such high levels.| Nifty 50 PE Ratio | Market Valuations | What Should Investors Do? |
| 25-30 | Extremely Expensive | Investors should book profits and wait for a fall to re-enter the market |
| 20-25 | Expensive | Investors should book 80% profits and shift to cash/debt |
| 15-20 | Average | Investors can continue buying or hold existing investments |
| 12-15 | Inexpensive | Strong Buy Signal. Investors should invest greedily in fundamentally strong stocks. |
| Below 12 | Cheap | Extremely rare event. Hasn’t happened in the last 21 years (since 2000) |
How to Calculate Nifty PE Ratio?
Nifty 50 PE Ratio Formula = Total Free Float Market Capitalisation of all 50 companies / Total Free Float Profit after Tax (PAT) of last four quarters of all 50 companies. Looks scary, doesn’t it? Don’t worry, you can find Nifty’s PE ratio since inception on NSE India’s website. Earlier standalone earnings were used to calculate Nifty’s PE ratio. But April 2021 onwards, consolidated earnings are used. This is great news as it shows a complete picture. Standalone earning includes income earned by only the parent company. Whereas consolidated earnings include income earned by both parent and its subsidiaries. The below table shows the monthly Nifty 50 PE ratio since 1999.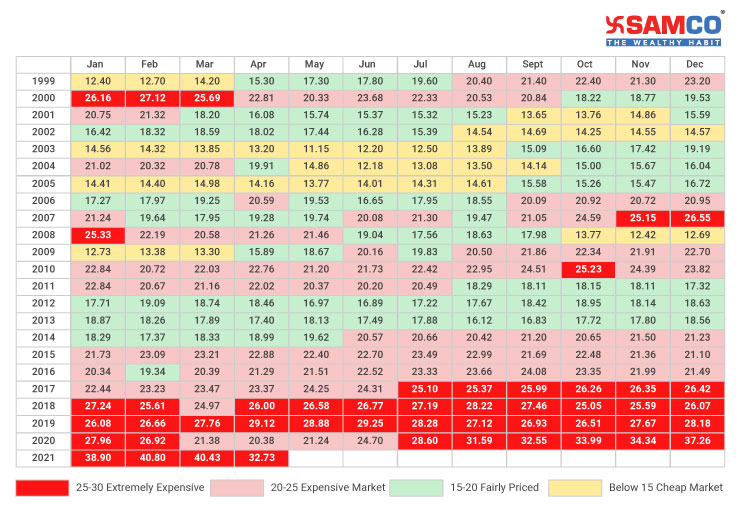 Let us map the above data on a chart and analyse how Nifty 50 PE works.
Nifty 50 Vs Nifty 50 PE Chart
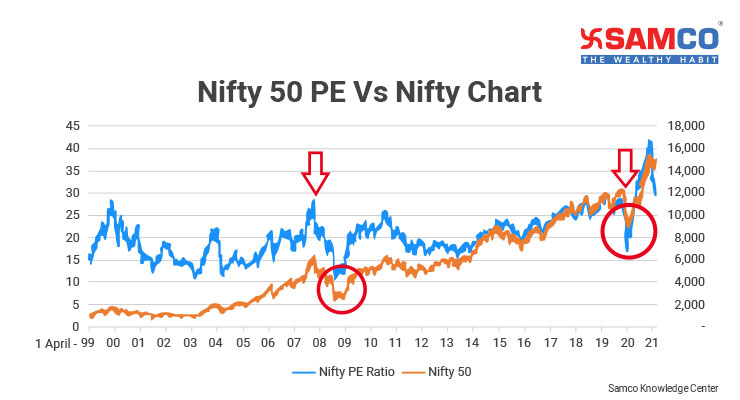 The average Nifty 50 PE ratio lies in the 19-20 range.
Notice that every time the Nifty 50 PE ratio is near 30, the market falls. This is because intelligent investors start booking profits at this stage.
Whereas every time Nifty 50 PE falls below 15, the market bounces back. This is where intelligent investors start buying undervalued stocks.
The current PE ratio is 29.59. That’s 48% higher than the average.
Why did this happen?
Why did Nifty 50 PE Ratio hit a lifetime high of 42 in February 2021? Let’s find out.
We know that PE ratio is a function of two things –
The average Nifty 50 PE ratio lies in the 19-20 range.
Notice that every time the Nifty 50 PE ratio is near 30, the market falls. This is because intelligent investors start booking profits at this stage.
Whereas every time Nifty 50 PE falls below 15, the market bounces back. This is where intelligent investors start buying undervalued stocks.
The current PE ratio is 29.59. That’s 48% higher than the average.
Why did this happen?
Why did Nifty 50 PE Ratio hit a lifetime high of 42 in February 2021? Let’s find out.
We know that PE ratio is a function of two things –
- Price
- Earnings
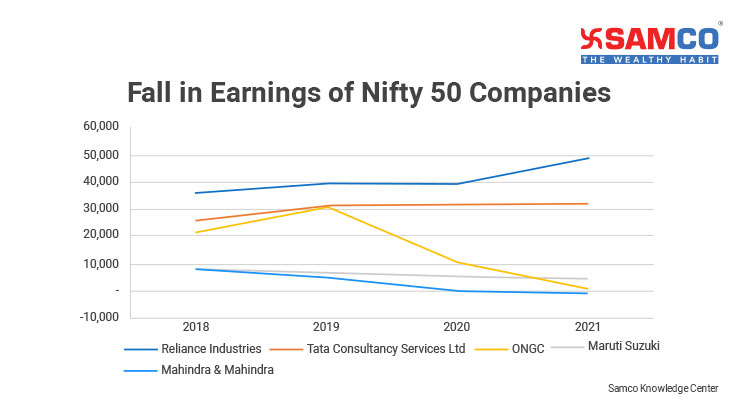 Reliance Industries and TCS have shown steady growth. But there has been a steep fall in earnings of companies like ONGC, Maruti Suzuki etc. This has caused an unnatural increase in Nifty 50 PE ratio.
But there is some good news. The sales and earnings of many Nifty 50 stocks is back to pre-pandemic levels. Over time, this will automatically correct Nifty PE to sustainable levels.
Another reason for high Nifty PE ratio is the cash influx by foreign institutional investors (FII). During the pandemic, central banks of various countries printed currencies in trillions as stimulus. The US Fed (central bank of the United States of America), reduced interest rate to as low as 0.25% during the pandemic.
FIIs started searching for growth opportunities elsewhere. This is when they started investing in emerging markets like India.
The below chart shows the FII inflow in Indian markets since 2020.
Reliance Industries and TCS have shown steady growth. But there has been a steep fall in earnings of companies like ONGC, Maruti Suzuki etc. This has caused an unnatural increase in Nifty 50 PE ratio.
But there is some good news. The sales and earnings of many Nifty 50 stocks is back to pre-pandemic levels. Over time, this will automatically correct Nifty PE to sustainable levels.
Another reason for high Nifty PE ratio is the cash influx by foreign institutional investors (FII). During the pandemic, central banks of various countries printed currencies in trillions as stimulus. The US Fed (central bank of the United States of America), reduced interest rate to as low as 0.25% during the pandemic.
FIIs started searching for growth opportunities elsewhere. This is when they started investing in emerging markets like India.
The below chart shows the FII inflow in Indian markets since 2020.
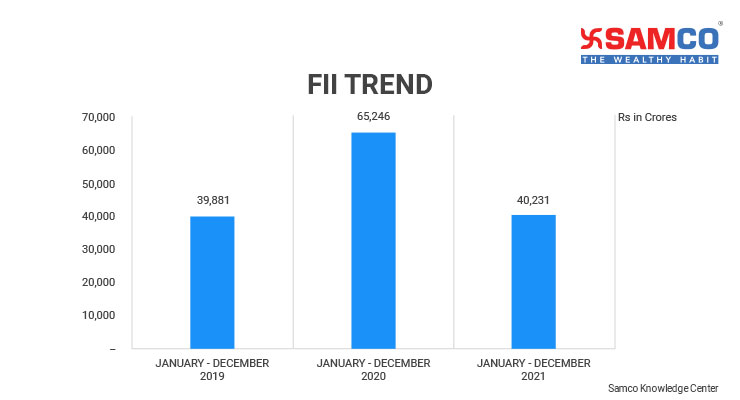 As you can see, FIIs have increased their investment by 64% between 2019 and 2020. This was due to excess liquidity.
We might witness a correction in Nifty when these FIIs pull money out of the markets.
Nifty PE ratio is the primary indicator which can help you decide whether the markets are overpriced or under-priced. But it’s not the only indicator.
Let us look at four other nifty based secondary indicators that can help you decide true market valuations.
As you can see, FIIs have increased their investment by 64% between 2019 and 2020. This was due to excess liquidity.
We might witness a correction in Nifty when these FIIs pull money out of the markets.
Nifty PE ratio is the primary indicator which can help you decide whether the markets are overpriced or under-priced. But it’s not the only indicator.
Let us look at four other nifty based secondary indicators that can help you decide true market valuations.
Market Valuations Indicator #1: Nifty Price to Book Value (PB).
Price to Book Value (PB) ratio is the proportion of assets you own when you buy shares of a company. It is calculated by dividing a company’s current market price by its book value. Book value is nothing but a company’s assets minus its liabilities. For example: The PB ratio of Tata Consultancy Services Ltd (TCS) is 13.5. This means that investors are paying Rs 13.5 for one rupee of TCS’s assets. If you think this is high, the PB ratio of Adani Green Energy Ltd is 89.90. While its industry PB ratio is 0.95 only. This clearly shows that the stock is extremely overvalued. Similarly, we can use Nifty price to book ratio to determine if the markets are overvalued.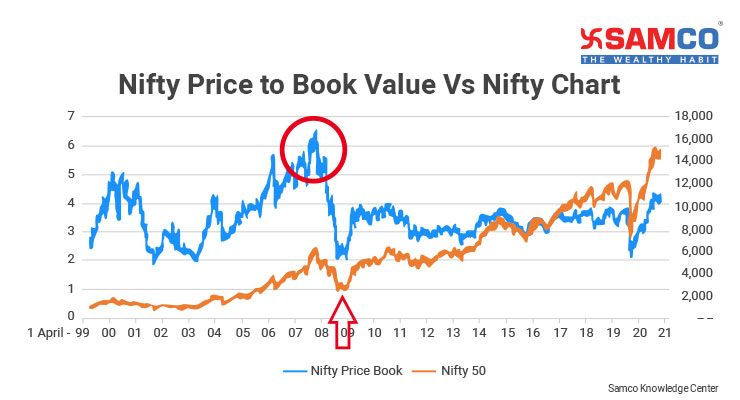 The average long-term Nifty PB ratio is 3.50.
Majority of the time, Nifty PB ratio stays in the 2-4 range. It hit a peak of 6.55 in 2008. Shortly after, the markets witnessed heavy corrections.
So, it’s safe to assume that a Nifty PB ratio between 3-3.5 signals a fairly priced market.
The average long-term Nifty PB ratio is 3.50.
Majority of the time, Nifty PB ratio stays in the 2-4 range. It hit a peak of 6.55 in 2008. Shortly after, the markets witnessed heavy corrections.
So, it’s safe to assume that a Nifty PB ratio between 3-3.5 signals a fairly priced market.
| Nifty 50 PB Ratio | Market Valuations | What Should Investors Do? |
| Greater than 4 | Extremely Expensive | Investors should book profits. |
| Between 2.75 and 3.5 | Fairly Priced | Investors can continue buying or hold existing investments |
| Less than 2 | Cheap | Strong Buy Signal. Investors should invest greedily in fundamentally strong stocks. |
Market Valuations Indicator #2: Nifty Dividend Yield Ratio
While not a direct valuation ratio, Nifty Dividend Yield Ratio indirectly points out if the market is overvalued. In a fairly valued market, dividend yield ratio stays in the range of 1 and 2. Just before the 2008 stock market crash, Nifty’s dividend yield was 0.82. That’s the lowest level in the new millennium.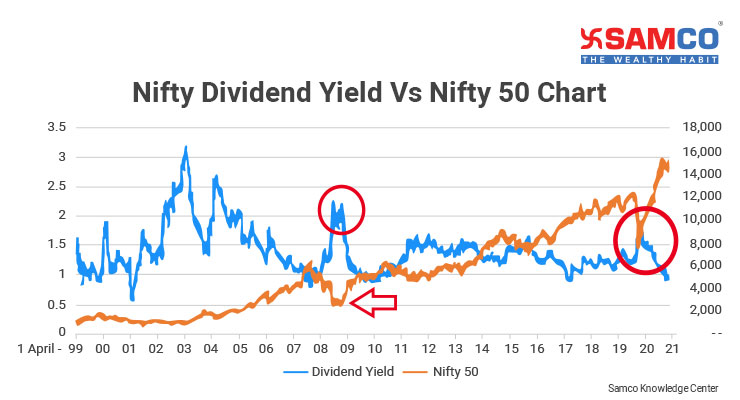 The average dividend yield of Nifty is 1.41. A higher dividend yield means the market is undervalued. This is a good buying opportunity for investors.
The dividend yield of Nifty 50 on 20th May 2021 is 1. So, from a dividend yield point of view, Nifty 50 is in still in the overvalued zone.
The average dividend yield of Nifty is 1.41. A higher dividend yield means the market is undervalued. This is a good buying opportunity for investors.
The dividend yield of Nifty 50 on 20th May 2021 is 1. So, from a dividend yield point of view, Nifty 50 is in still in the overvalued zone.
Market Valuation Indicator #3: Market Capitalisation (Market Cap) to GDP Ratio
Market Cap to GDP is also known as the Warren Buffett Indicator. It compares the market capitalisation of the entire market to India’s Gross Domestic Product (GDP).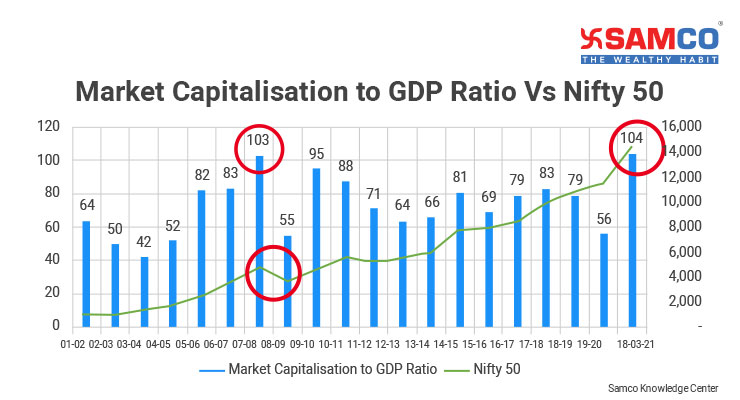 Historically, India’s market cap to GDP ratio is 75%. A ratio of 100% is a sign of an expensive market. Here is the market capitalisation to GDP ratio of India since 2001.
Before the stock market crash of 2008, the market cap to GDP ratio was 103%. Then there was a cool-off period where the ratio was range-bound between 60% and 80%. The long-term average ratio is 75%.
Historically, India’s market cap to GDP ratio is 75%. A ratio of 100% is a sign of an expensive market. Here is the market capitalisation to GDP ratio of India since 2001.
Before the stock market crash of 2008, the market cap to GDP ratio was 103%. Then there was a cool-off period where the ratio was range-bound between 60% and 80%. The long-term average ratio is 75%.
| Market Capitalisation to GDP Ratio | Market Valuations | What Should Investors Do? |
| 50%-75% | Under Valued | Buy fundamentally strong stocks |
| 75% - 95% | Fairly Priced | Hold existing stocks |
| 90% - 115% | Over Valued | Book partial profits |
Market Valuation Indicator #4: Debt to GDP Ratio
The fourth indicator is the Debt to GDP ratio. In our detailed article on Debt to Equity ratio, we saw how high debt can ruin companies. Similarly, a high debt to GDP ratio means that the market is highly leveraged. In 2019, India’s debt to GDP ratio was 74% of GDP. In 2020, it is 90%! This shows a highly leveraged stock market.To summarise:
| Valuation Indicator | Current Ratio | Ideal Ratio | Market Valuations |
| Nifty 50 PE Ratio | 32.73 | 19-20 | Overvalued |
| Nifty Price to Book Value | 4.27 | 3-3.50 | Overvalued |
| Nifty Dividend Yield | 1 | More than 1.40 | Overvalued |
| Market Capitalisation to GDP | 104 | 75% | Overvalued |
| Debt to GDP Ratio | 90% | 50% | Overvalued |
- If Nifty 50 PE is more than 25, maintain 75% in Debt and 25% in Equities.
- If Nifty 50 PE is between 20 to 25, maintain 50% in Debt and 50% in Equities.
- If Nifty 50 PE is below 20, invest 75% in Equities and 25% in Debt.
FAQs on Nifty 50 PE Ratio
- What is Nifty PE Ratio?
- What is an ideal Nifty PE Ratio?
- How to calculate Nifty PE Ratio?
- What is the ideal Nifty Price to Book Value ratio?
- What is the Warren Buffet Indicator?
- What is PE Ratio?
- Where can I find Nifty PE Ratio?


Leave A Comment?