

 Debt to Equity ratio (DE) is a popular leverage ratio. It is used by both investors and creditors to determine the financial strength of a company. A company raises capital in two ways –
Debt financing is taking loan from a creditor in exchange for fixed interest payments. Equity financing is issuing equity shares to the general public. This is done via an initial public offering (IPO) or a follow on public offering (FPO). Equity financing is costly, time consuming and dilutes earnings per share (EPS). This is why companies prefer debt financing. It requires minimum regulations and is pocket-friendly. Interest payments is the primary cost of debt financing. But companies deduct the interest paid from their overall tax liability. So, it’s a win-win situation for both. Company gets cheaper capital without diluting shareholder’s equity. Investors enjoy guaranteed interest income. But debt financing has a critical risk – Credit Risk. What happens if the borrower fails to pay interest or repay the loan? Investors are left with nowhere to go. Debt to Equity ratio helps investors understand how much of a company’s assets are financed by debt. This helps them measure the credit risk in case of liquidation.
What is Debt to Equity (DE) Ratio? – Meaning of Debt to Equity (DE) Ratio
Debt to Equity ratio is a company’s total debt against its equity. It helps you understand quantum of assets financed by debt. DE ratio is also known as risk ratio or gearing ratio. For example: You want to open a Tea stall in Mumbai. You need seed capital of Rs 1 Lakh. You have Rs 50,000. You borrow the remaining Rs 50,000 from your friend. In this case, the Debt to Equity ratio is 1:1. This means that for every 1 Re of Equity, there is a 1 Re of debt. Debt to Equity ratio is calculated by dividing a company’s total liabilities by shareholders equity. Debt to Equity Ratio Formula = Total Liabilities Shareholder’s Equity You should only include long-term debt while calculating total liabilities. The minimum maturity period of long-term debt is more than 5 years. It is reflected as non-current liabilities in the balance sheet. Short term debt should not be taken into account while calculating Debt to Equity ratio. Current Ratio or Quick Ratio is a better barometer to judge a company’s ability to repay short term liabilities. [Read More: Learn How to Analyse a Company’s Balance Sheet] Below is the balance sheet of Infosys Ltd since March 2016. Let us calculate the Debt to Equity ratio of Infosys Ltd. 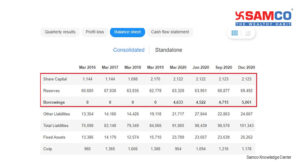 Focus only on the cells marked in red to calculate Debt to Equity ratio – Share Capital, Reserves and Borrowings. Ignore ‘other liabilities’ as these are short term liabilities. Debt to Equity Ratio = Total Liabilities (borrowings in the above screenshot) Shareholder’s Equity (Share Capital + Reserves) Infosys had no long term debt in financial years (FY) 2016 through 2019. So, let’s directly jump to March 2020. DE Ratio = 4,633/ (63,328+2,122) = 0.0708 Similarly, the DE ratio for quarter ending Dec 2020 = 0.0707. In majority of financial ratios, the higher the ratio, the better it is. But in case of DE ratio, a lower ratio is ideal. Ideal Debt to Equity Ratio
- The ideal Debt to Equity ratio is 1:1. It means the company has equal equity for debt. Companies with DE ratio of less than 1 are relatively safer.
- A DE ratio of more than 2 is risky. It means for every Rs 1 in equity, the company owes Rs 2 of Debt.
- DE ratio can also be negative. The DE ratio of Spicejet is -3.16. A negative DE ratio occurs when a company pays high interest on debt while earning lower returns on equity. Another reason for negative DE can be company’s negative networth.
Low DE ratio does not necessarily mean that a company is a great investment. 3m India Limited’s DE ratio is 0.02. The company has almost zero debt on its books. Yet the stock fails on other aspects. A low DE ratio can also mean that the company is not taking advantage of financial leverage to increase its profits. Find out Samco’s Stock Rating on 3m India Limited Likewise, assuming that a company with Zero Debt is always best is also wrong.
List is of companies with zero debt but poor fundamentals.
| Stock | DE Ratio | Samco Stock Rating |
| GM Breweries | 0.00 | 1 Star |
| Balaxi Pharma Ltd | 0.00 | 1 Star |
| Bharat Electronics Ltd | 0.00 | 1 Star |
| Nesco Ltd | 0.00 | 1 Star |
High DE means a bad company is also a wrong assumption. Capital intensive industry like Power and Banks have high Debt to Equity ratios. Hence while comparing, you should consider average industry DE ratio. For example: Banking is a capital intensive sector. The DE ratio of some of the top banks is as follows:
| Stock | DE Ratio |
| State Bank of India | 14.37 |
| Bank of India | 13.25 |
| Punjab National Bank | 12.10 |
| Axis Bank | 9.23 |
| HDFC Bank Ltd | 7.56 |
| Kotak Mahindra Bank | 4.90 |
Notice how public sector banks like SBI, BOI and PNB have higher DE ratios than private sector banks. Similar patterns can be seen in power, metals and capital goods stocks.
| Stock | DE Ratio | Industry |
| Adani Power Ltd | 6.64 | Power |
| Tata Power Co. Ltd | 2.06 | Power |
| Reliance Power Ltd | 2.40 | Power |
| PowerGrid Corporation Ltd | 2.18 | Power |
TATA Power Ltd’s DE ratio of 2.06 might seem high. But compare this to Adani Power’s DE ratio of 6.64. Hence, always evaluate DE ratio against industry average. An important aspect of DE ratio is Interest Coverage Ratio. When companies borrow money, they have an obligation to pay regular interest. Interest coverage ratio measures a company’s ability to pay interest on borrowed funds.
- A high interest coverage ratio is a good sign for lenders and creditors.
- An interest coverage ratio of below 1.5 is considered to be bad. It means the company might default on its payment obligations.
- A high DE ratio is okay, if the company’s interest coverage ratio is also high.
Here’s a list of top 5 companies with Highest Debt and their interest coverage ratio.
| Stock | Debt (Crores) | DE Ratio | Interest Coverage Ratio |
| State Bank of India | 35,56,276 | 14.4 | 1.16 |
| Reliance Industries Ltd | 2,34,145 | 0.42 | 3.06 |
| Vodafone Idea | 1,24,788 | 19.44 | -0.36 |
| SAIL | 40,369 | 1.17 | 3.26 |
| L&T | 8,001 | 2.06 | 2.65 |
Vodafone India’s DE ratio is 19.44. This is much higher than Bharti Airtel’s DE ratio of 2.82. The worst part is that its Interest coverage ratio is -0.36. This clearly indicates that its probability of default is high. Companies with low or negative interest coverage ratio should be avoided.
Is Debt Always Bad? – High DE Ratio
In a perfect world, investors will only invest in companies with Zero Debt. Unfortunately, all companies cannot be Google or Apple. So majority of companies do have substantial debt on their balance sheets. Debt is not particularly bad if it helps companies earn higher profits. For example: Infosys Ltd had zero debt on its balance sheet between 2016 and 2019. It added debt in 2020. 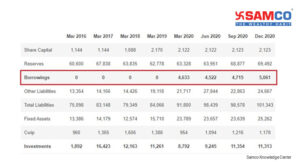 This is the profit and loss (P&L) statement of Infosys Ltd during the same time period.
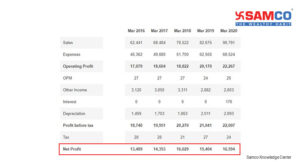 Note that alongside debt, Infosys Ltd also increased their profits year on year. So, maybe Debt isn’t bad if it increases your profits. An isolated view of DE ratio leads to poor stock selection. Happiest Minds Technologies Ltd has a DE ratio of 0.18. But the stock is a 1-star rated stock! A low DE ratio is no guarantee for a fundamentally sound stock. Similarly, a high DE ratio is not necessarily a bad thing if backed by higher earnings. The Debt to Equity ratio of REC Ltd is 7.45. This is way above our range of 0-2. However REC Ltd is still a 4-star rated stock! To conclude, DE ratio should not be viewed in isolation. You should always compare a stock’s DE with its peers and industry.
What Does a High DE Ratio Mean? - Implications of High Debt to Equity Ratio
- Reduced Equity Ownership: A high DE ratio means creditors have a bigger claim on company’s assets and earnings than equity shareholders. So, a major portion of earnings is spent on servicing debt. This leaves very little money for equity shareholders. For example Suzlon Energy Ltd. Its Debt to Equity ratio is -1.33. This means its paying higher interest on debt than its interest income.
- High Credit Risk: When a company’s DE ratio rises, it becomes more difficult for the company to pay off its debt obligations. Such companies often declare bankruptcy and entire equity shareholder’s value is lost. For example: Reliance Communications Ltd’s total debt stands at Rs 30,737 Crores! With high debt and no revenue, the company carries high credit risk.
- Difficulty in Financing Additional Debt: While giving debt, creditors always look at a company’s DE and interest coverage ratio. A high DE but low interest coverage ratio will deter creditors from giving additional loans. A high DE ratio also raises red flag for equity investors. So, a high DE ratio affects both equity and debt financing. A high DE ratio is acceptable only if it increases return on equity (ROE).
Return on Equity is the return generated by equity shareholders of a company. Suppose I and my friend start a business. We both contribute Rs 100. Our company’s total equity is Rs 200. We earn Rs 10 in the first year. Our return on equity is 5%. There is a direct connection between Debt to Equity ratio and Return on Equity ratio. If the borrowed capital is used efficiently, then high DE ratio can lead to higher ROE. Let us understand this with a simple example.
| Particulars | Company A | Company B |
| Total Assets | ₹ 1,00,000 | ₹ 1,00,000 |
| Return on Assets | 10% | 10% |
| Total Debt | ₹ 60,000 | ₹ 70,000 |
| Rate of Interest Payable on Debt | 5% | 5% |
| ROA | 7.00% | 6.50% |
| Leverage | 2.50 | 3.33 |
| Return on Equity | 18% | 22% |
Both companies A and B have the same assets. Even their return on assets (ROA) is the same. In fact company B has higher debt than company A. But still company B’s return on equity is much higher at 22%. High DE led to higher ROE. While investing in any stock, pay close attention to a company’s Debt to Equity ratio, interest coverage ratio and return on equity ratio. A high DE ratio should be accompanied by a high ROE. We at Samco have shortlisted some of the best stocks in India keeping the above and two million more parameters in mind. Discover the list of best long-term stocks in India and invest in them with Samco Securities. Open a FREE Samco Demat account and invest in best long term stocks today!


 Easy & quick
Leave A Comment?