In this article, we will discuss
- What is Andekha Sach?
- What are the Different Trading Insights Available Under Andekha Sach?
- What Benefits Does Andekha Sach Offer to Traders?
- Conclusion
Trading in the Indian share market is one of the many ways to create wealth in the short term. However, it is not as easy as it may seem. The movement of the financial markets can be unpredictable since it is dependent on a lot of micro and macro factors. Here’s where access to trading insights can help.
With the right trading insights, you can gain the knowledge and information required to make well-informed trading decisions. Moreover, assessing and managing the various market risks also becomes easier. The importance of these insights and their potential to transform the trading experience is what led us at Samco Securities to create Andekha Sach or Unseen Insights.
What is Andekha Sach?
Andekha Sach or Unseen Insights is a one-of-a-kind feature of the Samco trading app. It provides trade-related and market-related insights in an easy-to-understand format for both beginners and experienced traders alike. Samco’s proprietary engine uses artificial intelligence to analyse and process millions of data points to provide valuable and actionable insights based on your trading performance.
The primary objective of providing Andekha Sach to traders using the Samco trading platform is to help exponentially improve their trading performance and ace the markets. The insights provided by the Samco trading app can help you learn from both your mistakes and your successes so that you become a better trader.
What are the Different Trading Insights Available Under Andekha Sach?
The Samco trading app offers a plethora of unseen trading insights under two sections - My Trade Story and My Trade Spreadsheet. Here’s an overview of some of the key information you can find under these two sections of the app.
-
My Trade Story
My Trade Story is a section in the Samco trading app designed to provide you with a comprehensive report of your trading performance. It thoroughly analyses all your previous trades to identify profitable patterns and areas that need improvement. This data is then presented to you in a simple and clean format. Some trading insights you can find under the ‘My Trade Story’ section of the app are as follows.
-
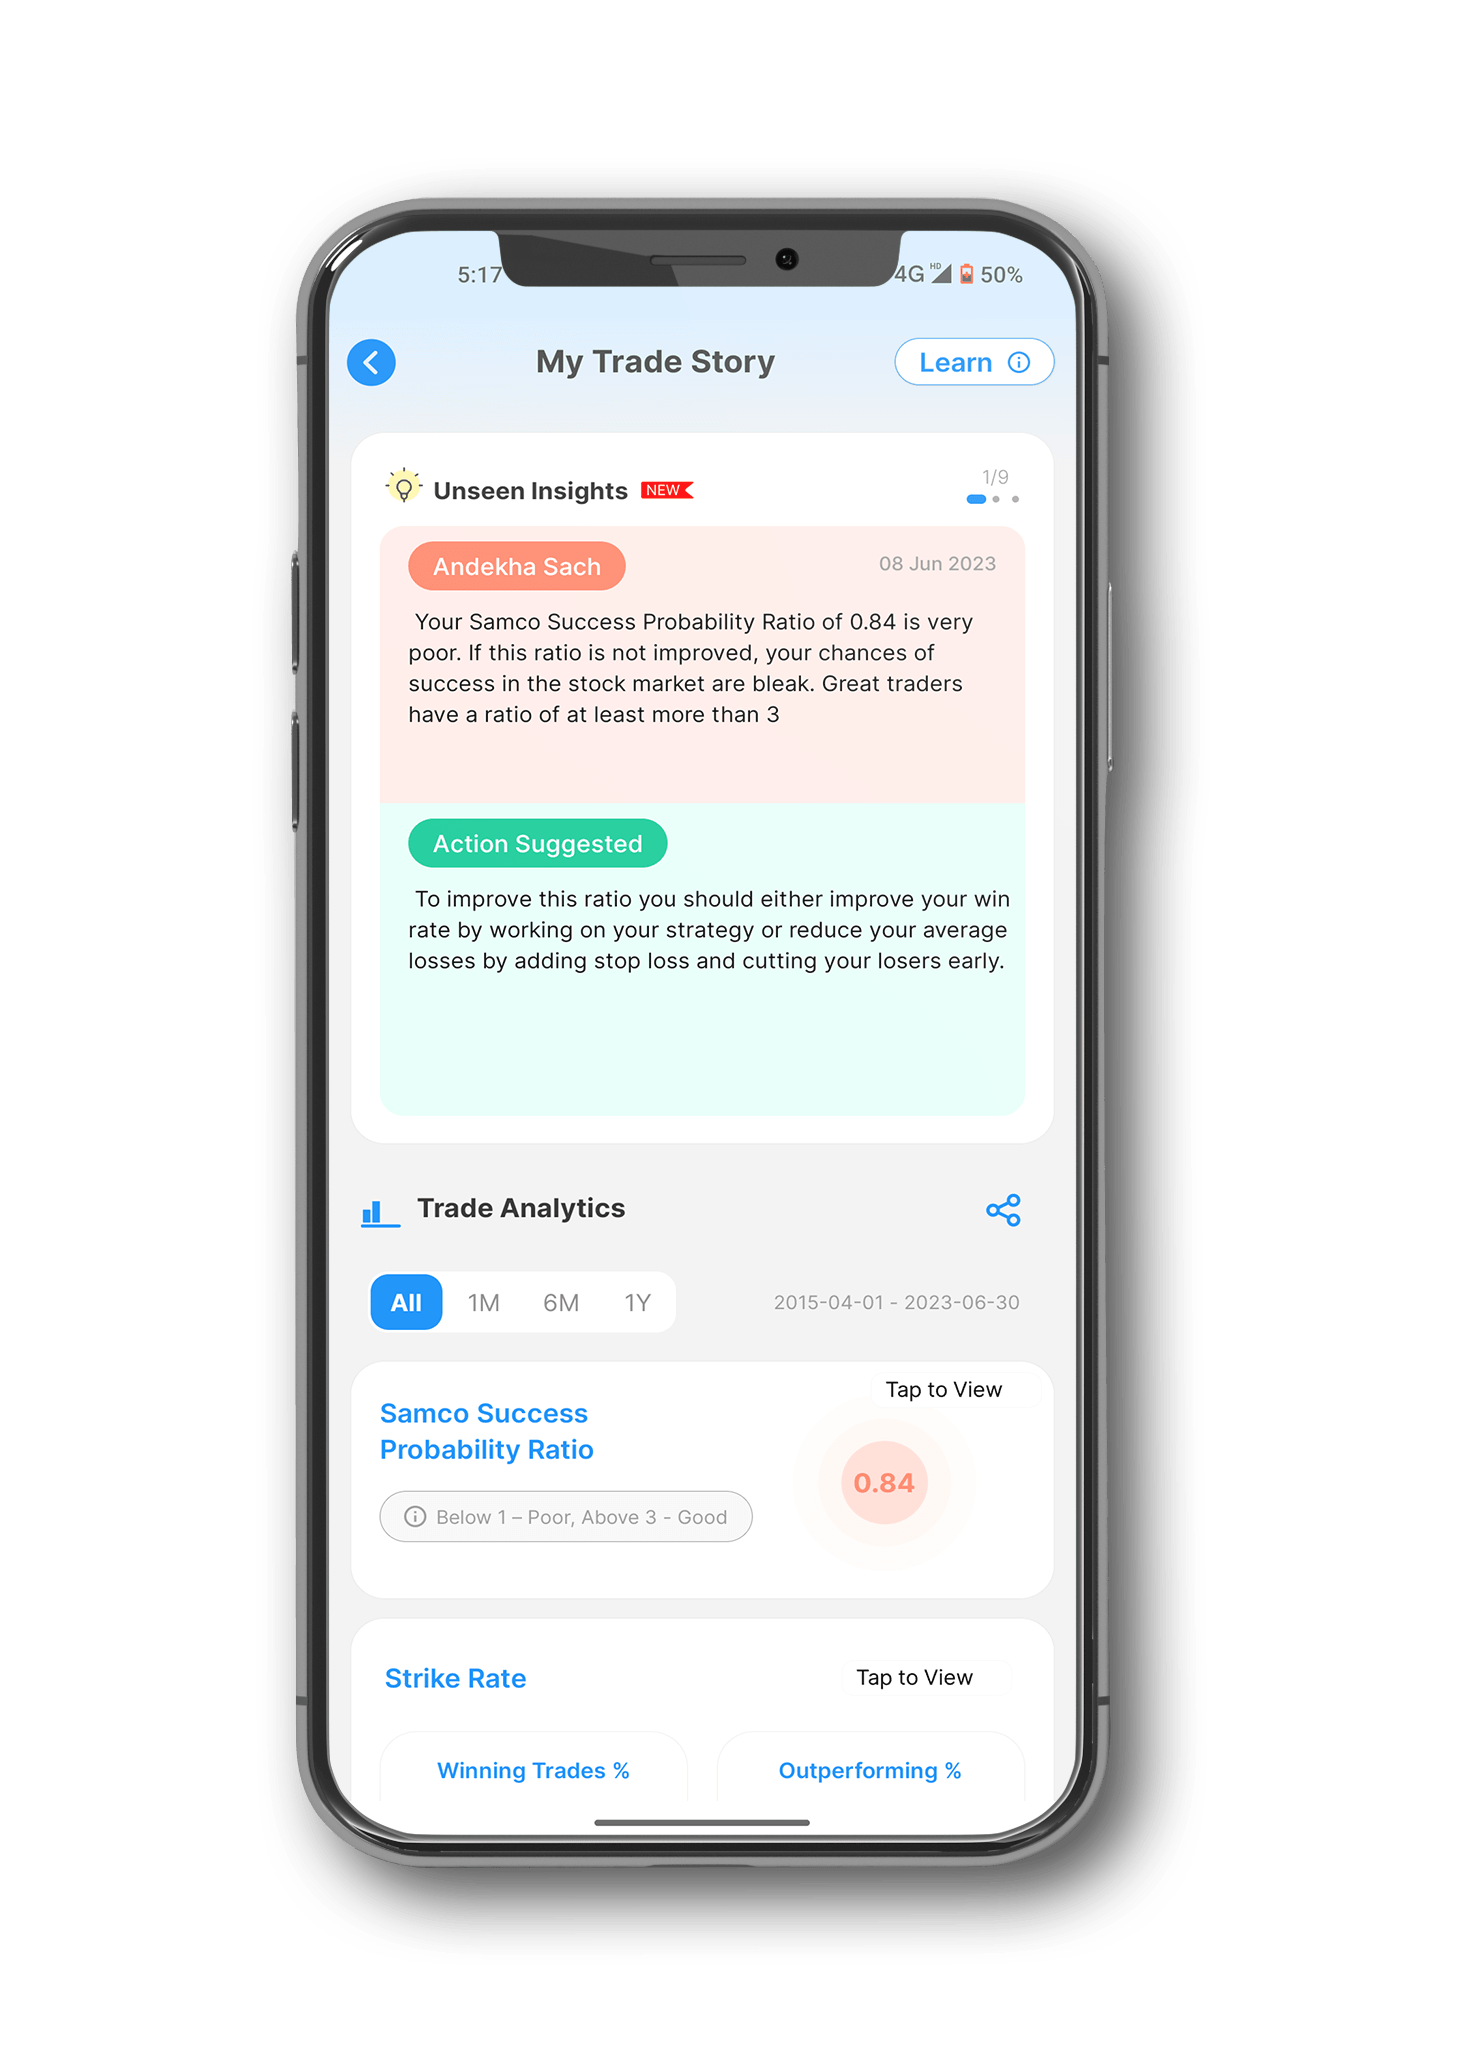
Andekha Sach (Unseen Insights)
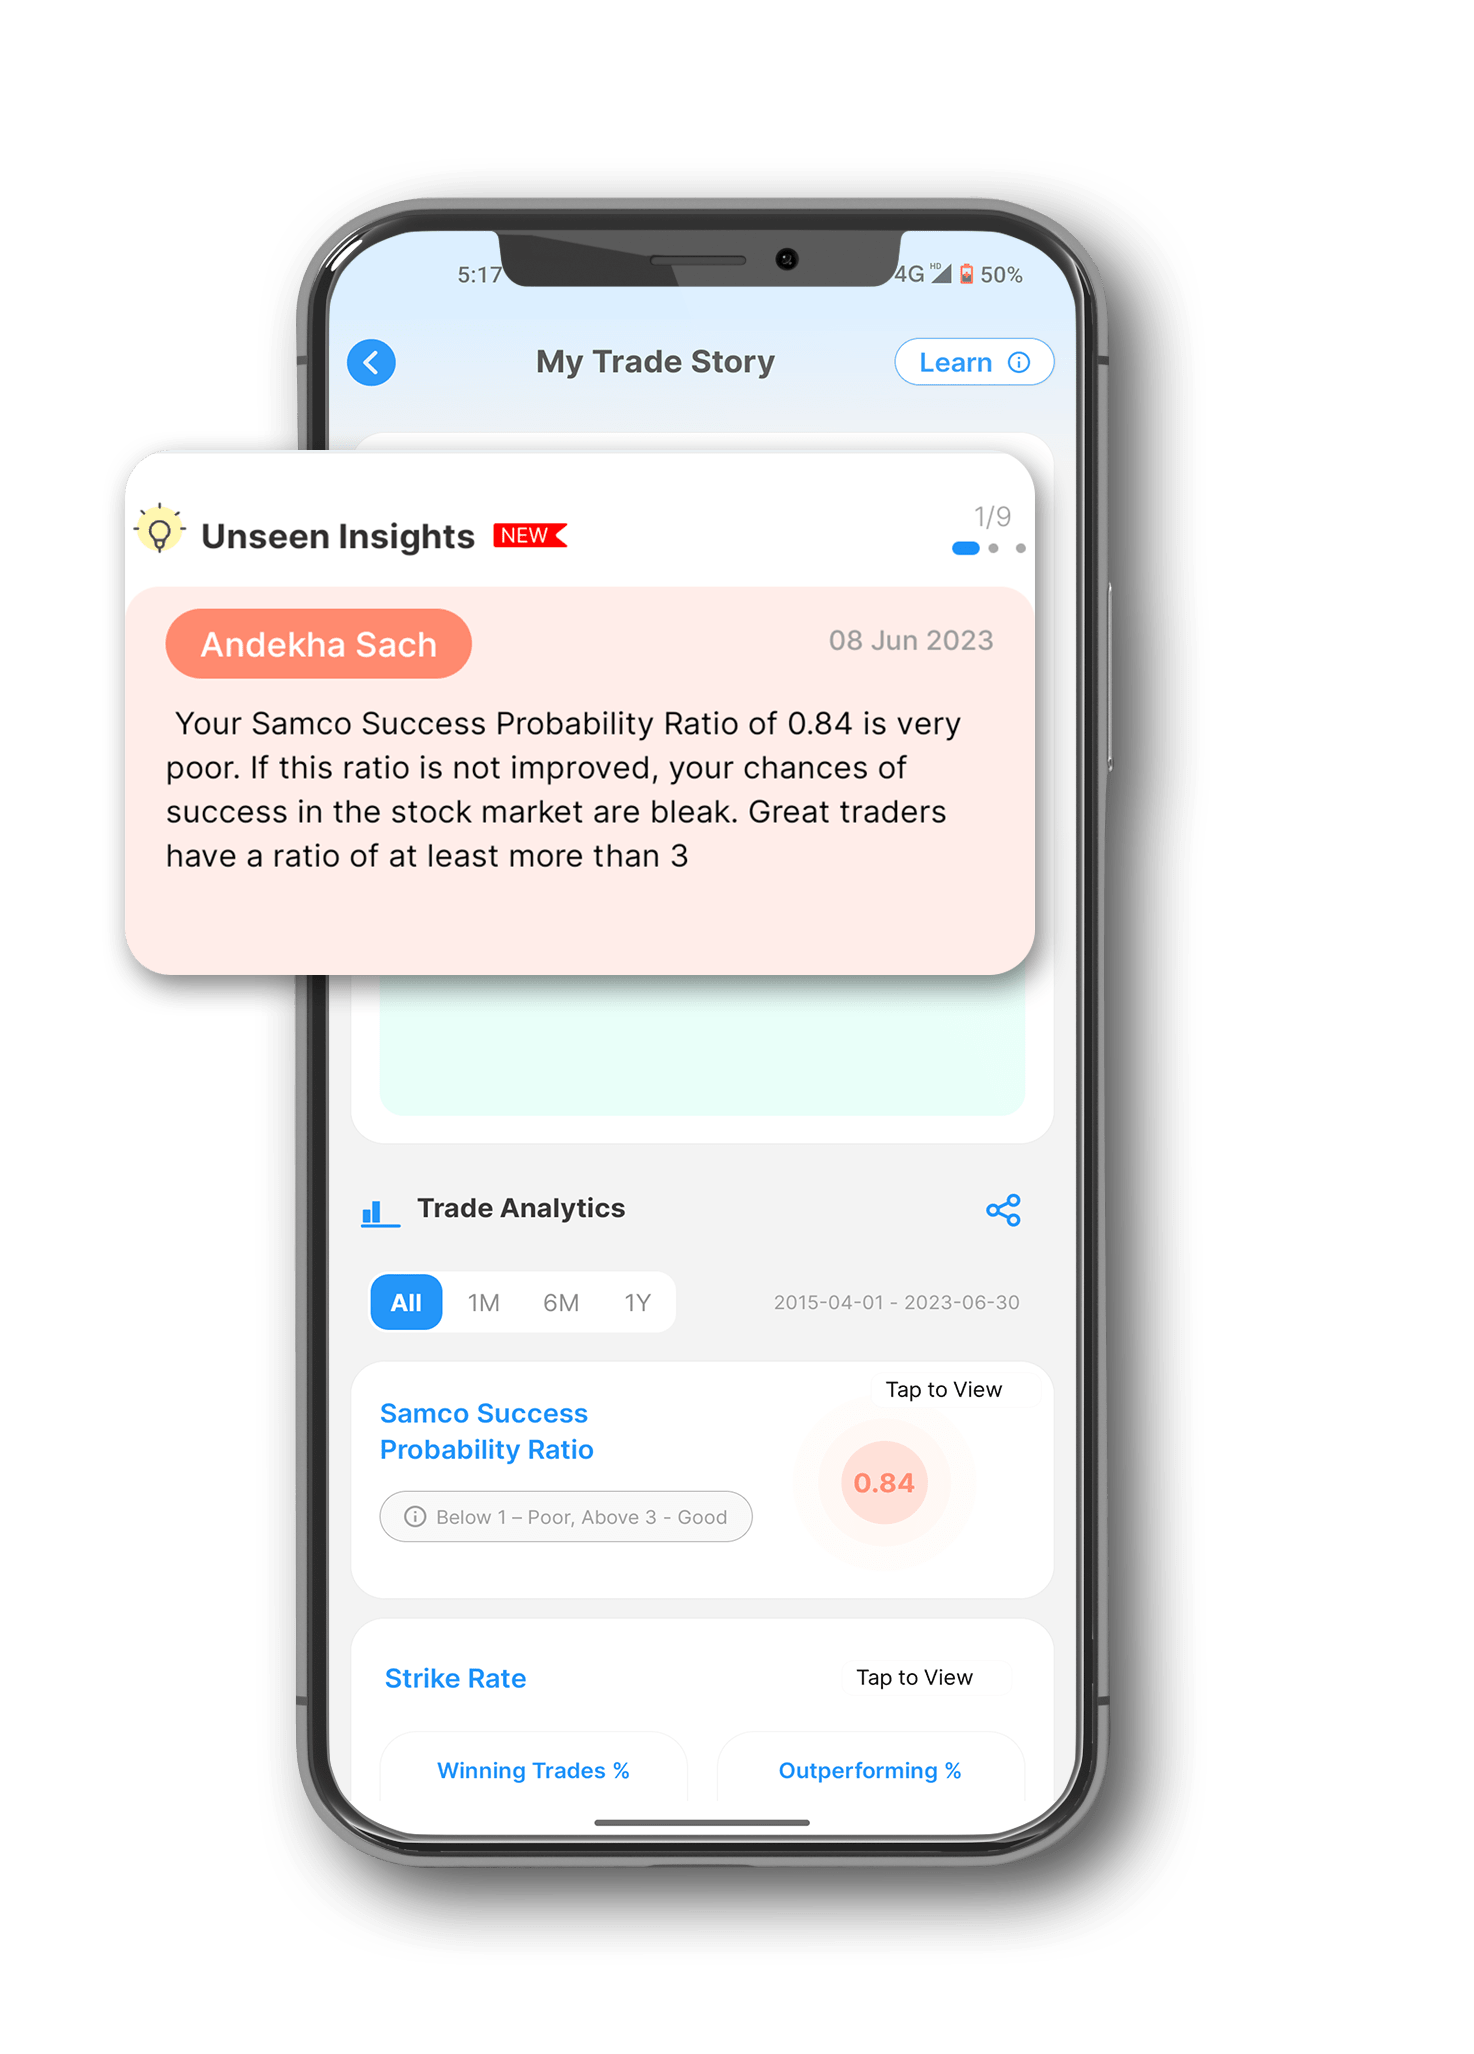
When you visit My Trade Story in the Samco trading app, you get access to a section known as Andekha Sach or Unseen Insights. Here, you can find trading insights generated based on your past trading performance. For instance, if you don’t have the habit of placing any stop-loss orders when executing trades, Andekha Sach may display the same as an insight.
-
Actionable Insights

Under the Andekha Sach section, you can find Actionable Insights. This section suggests appropriate actions you need to take to improve your trading performance. For instance, it may suggest tweaks to your trading strategy or in the case of the previous example, suggest placing stop-loss orders to limit downsides during adverse market movements.
-
Strike Rate
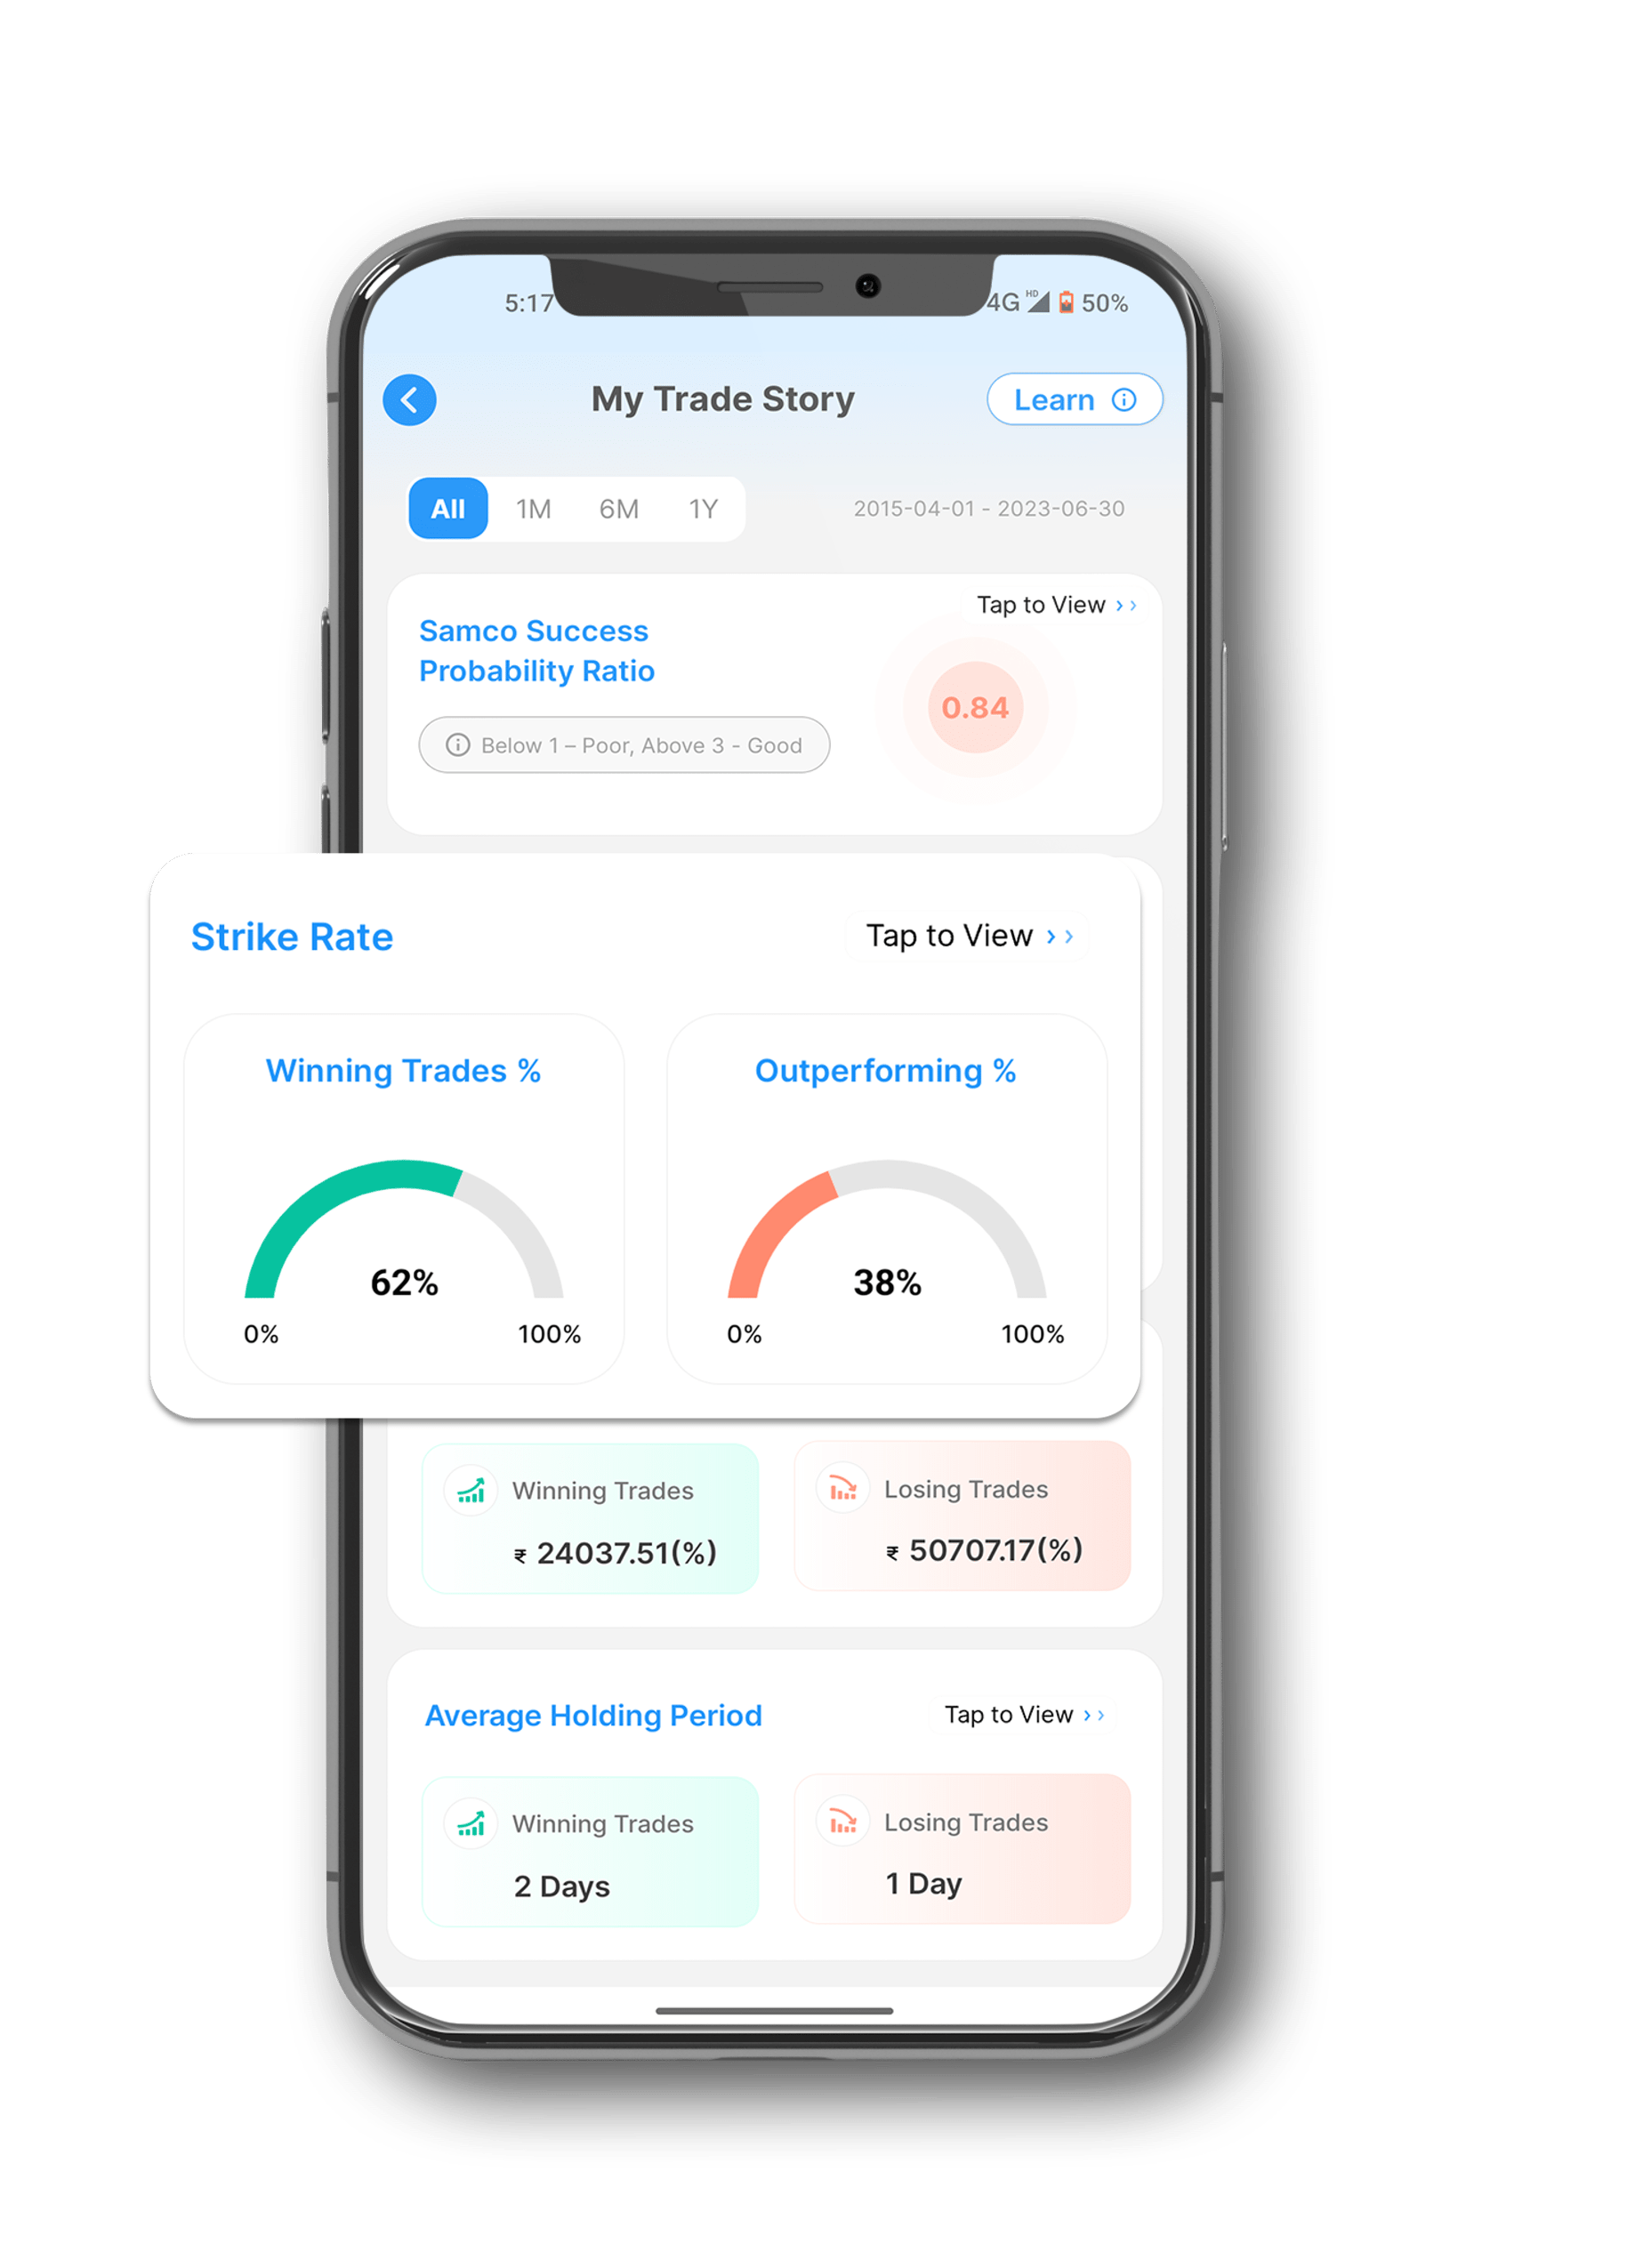
Another very useful Andekha Sach you get under the My Trade Story section of the Samco trading app is the strike rate. It shows you the percentage of winning and losing trades out of the total trades you made during a specific period.
For instance, if you’ve made 100 trades during the past month, out of which 36 were profitable, the winning trade percentage would be 36%. In addition to this, you also get a percentage of outperforming trades. This metric indicates the percentage of trades that have outperformed your benchmark index.
-
Average Profit or Loss Size
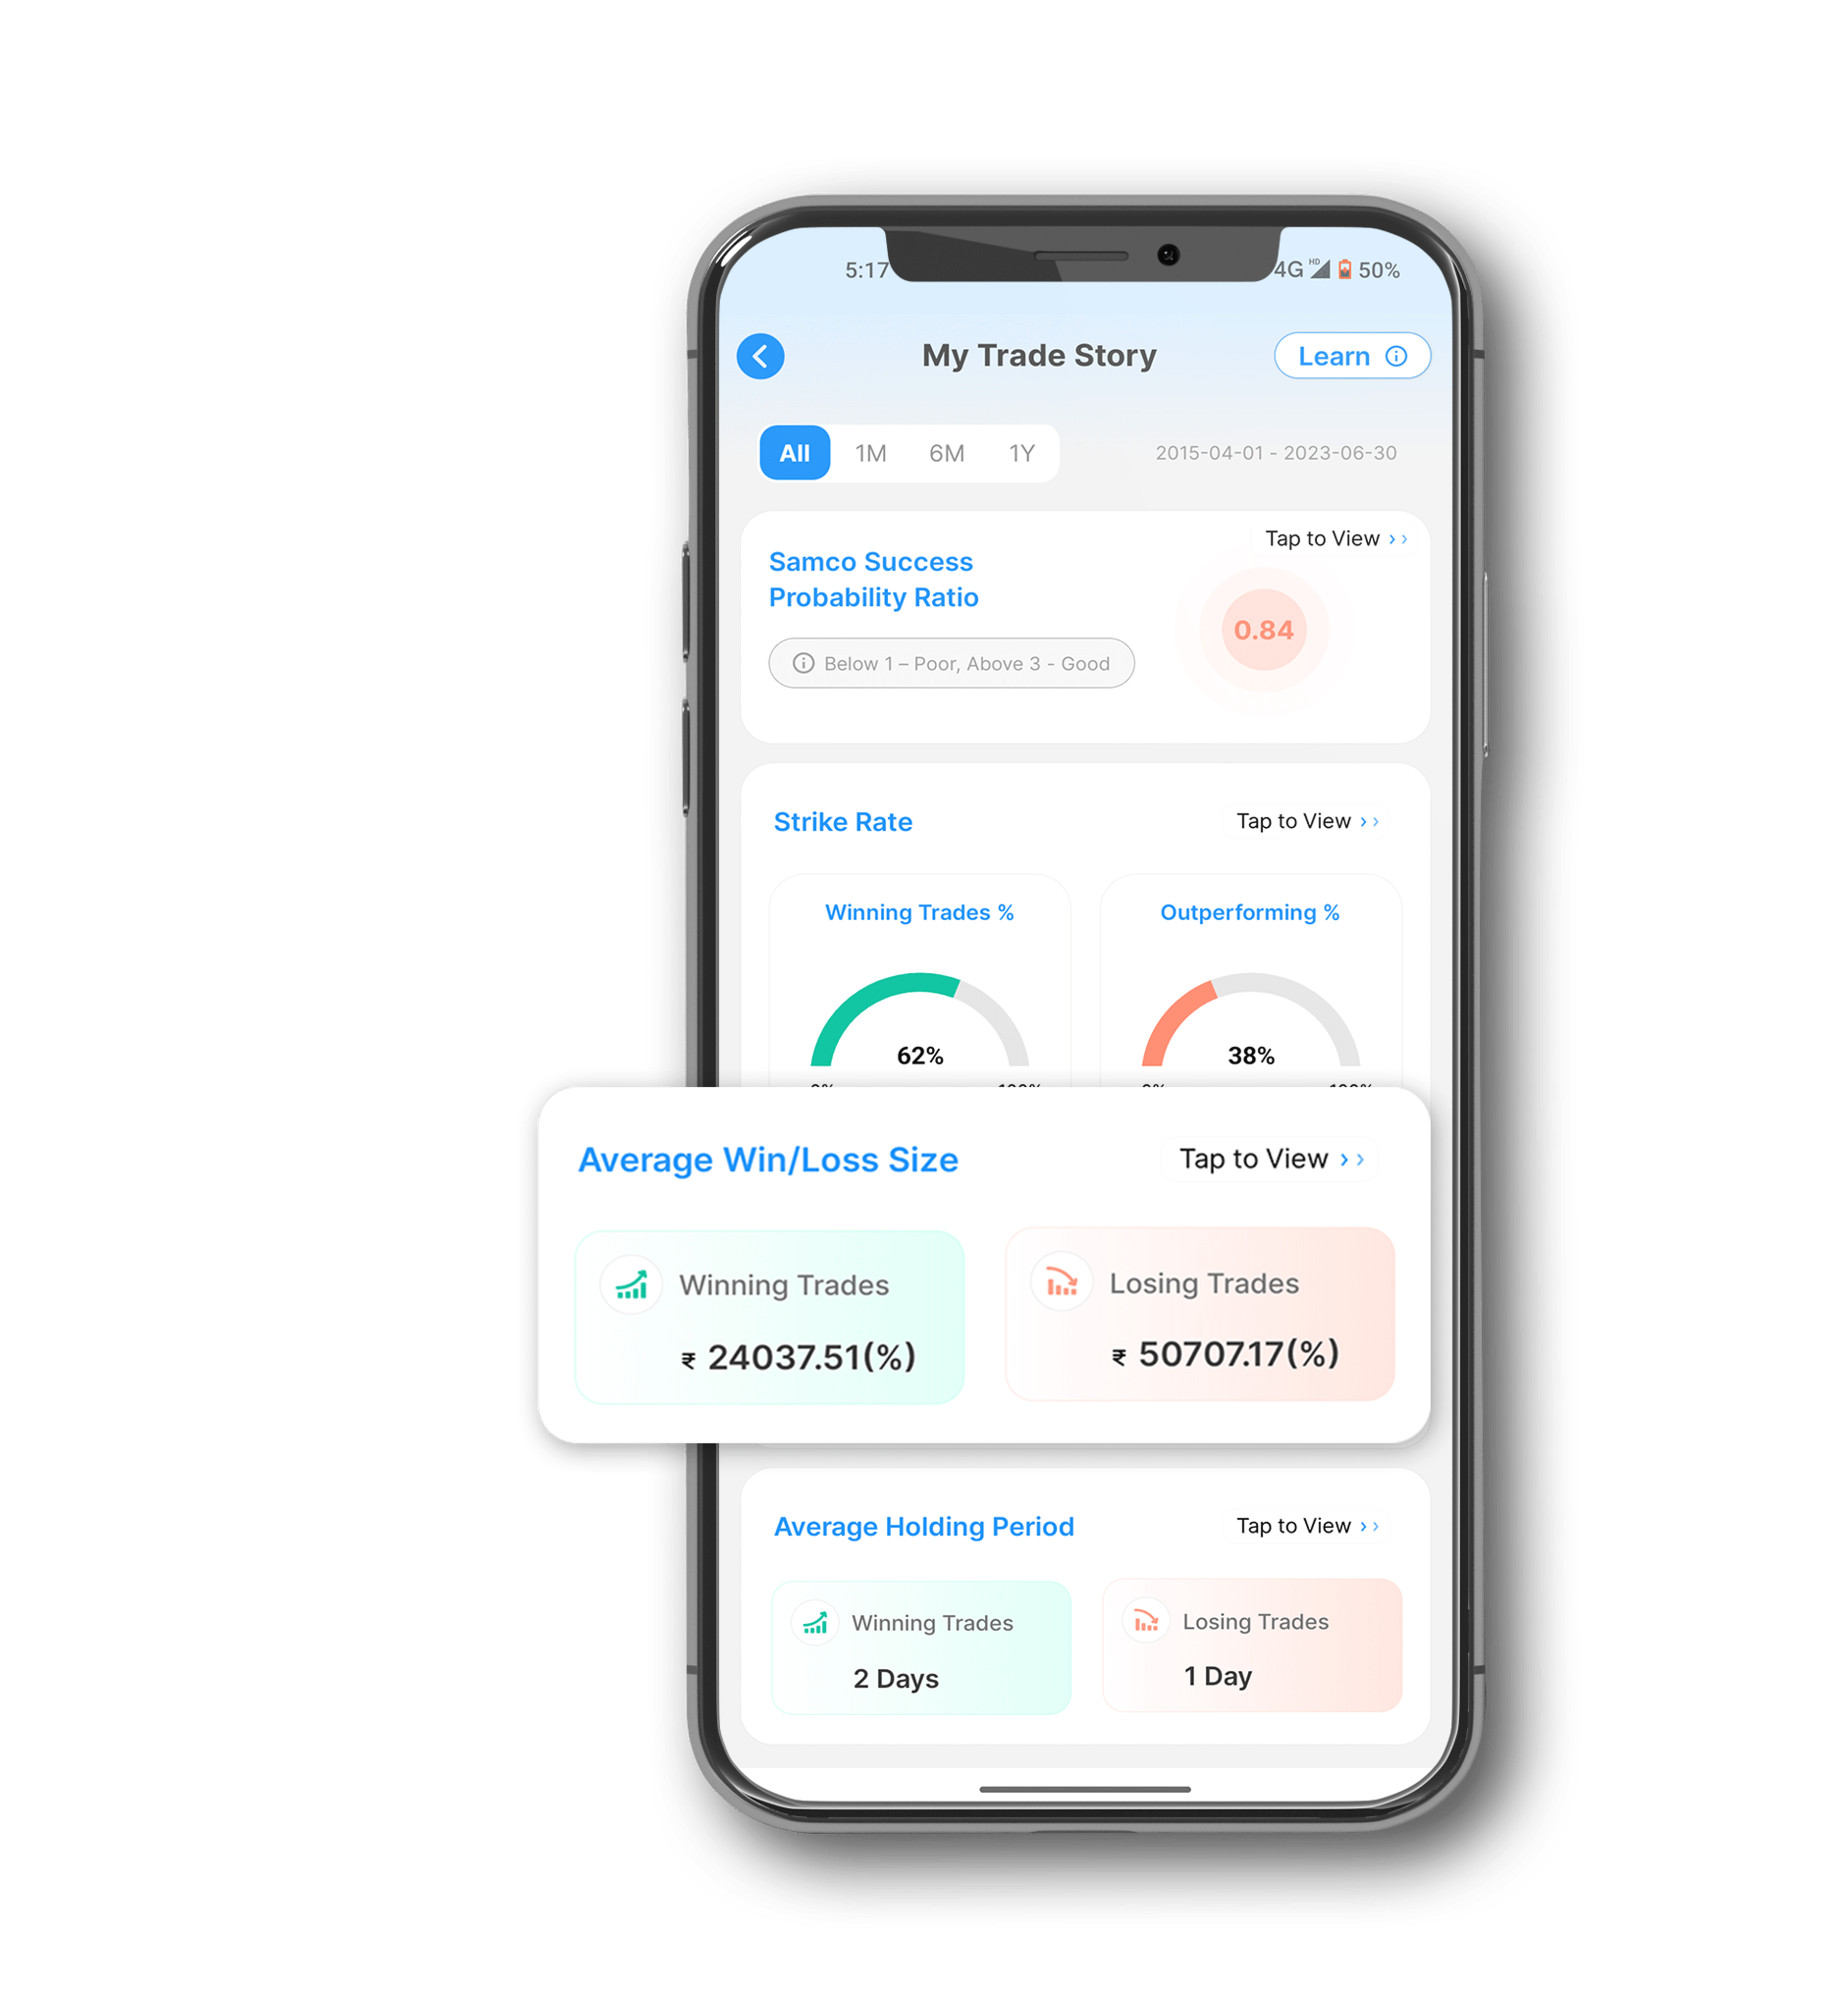
This section of the My Trade Story displays the average profit or loss you’ve generated during a certain period. It displays the average profit and loss in absolute numbers as well as on a percentage basis.
For instance, let's say you’ve made four trades in the last month. Out of these four, two were profitable and two were loss-making. Through the two profitable trades, you generated returns of Rs. 2,000 and Rs. 7,500 respectively. Similarly, through the two loss-making trades, you lost Rs. 4,000 and Rs. 1,800 respectively. The average profit during the last month would be Rs. 4,750 [(Rs. 2,000 + Rs. 7,500) ÷ 2] and the average loss during the same period would be Rs. 2,900 [(Rs. 4,000 + Rs. 1,800) ÷ 2].
-
Average Holding Period
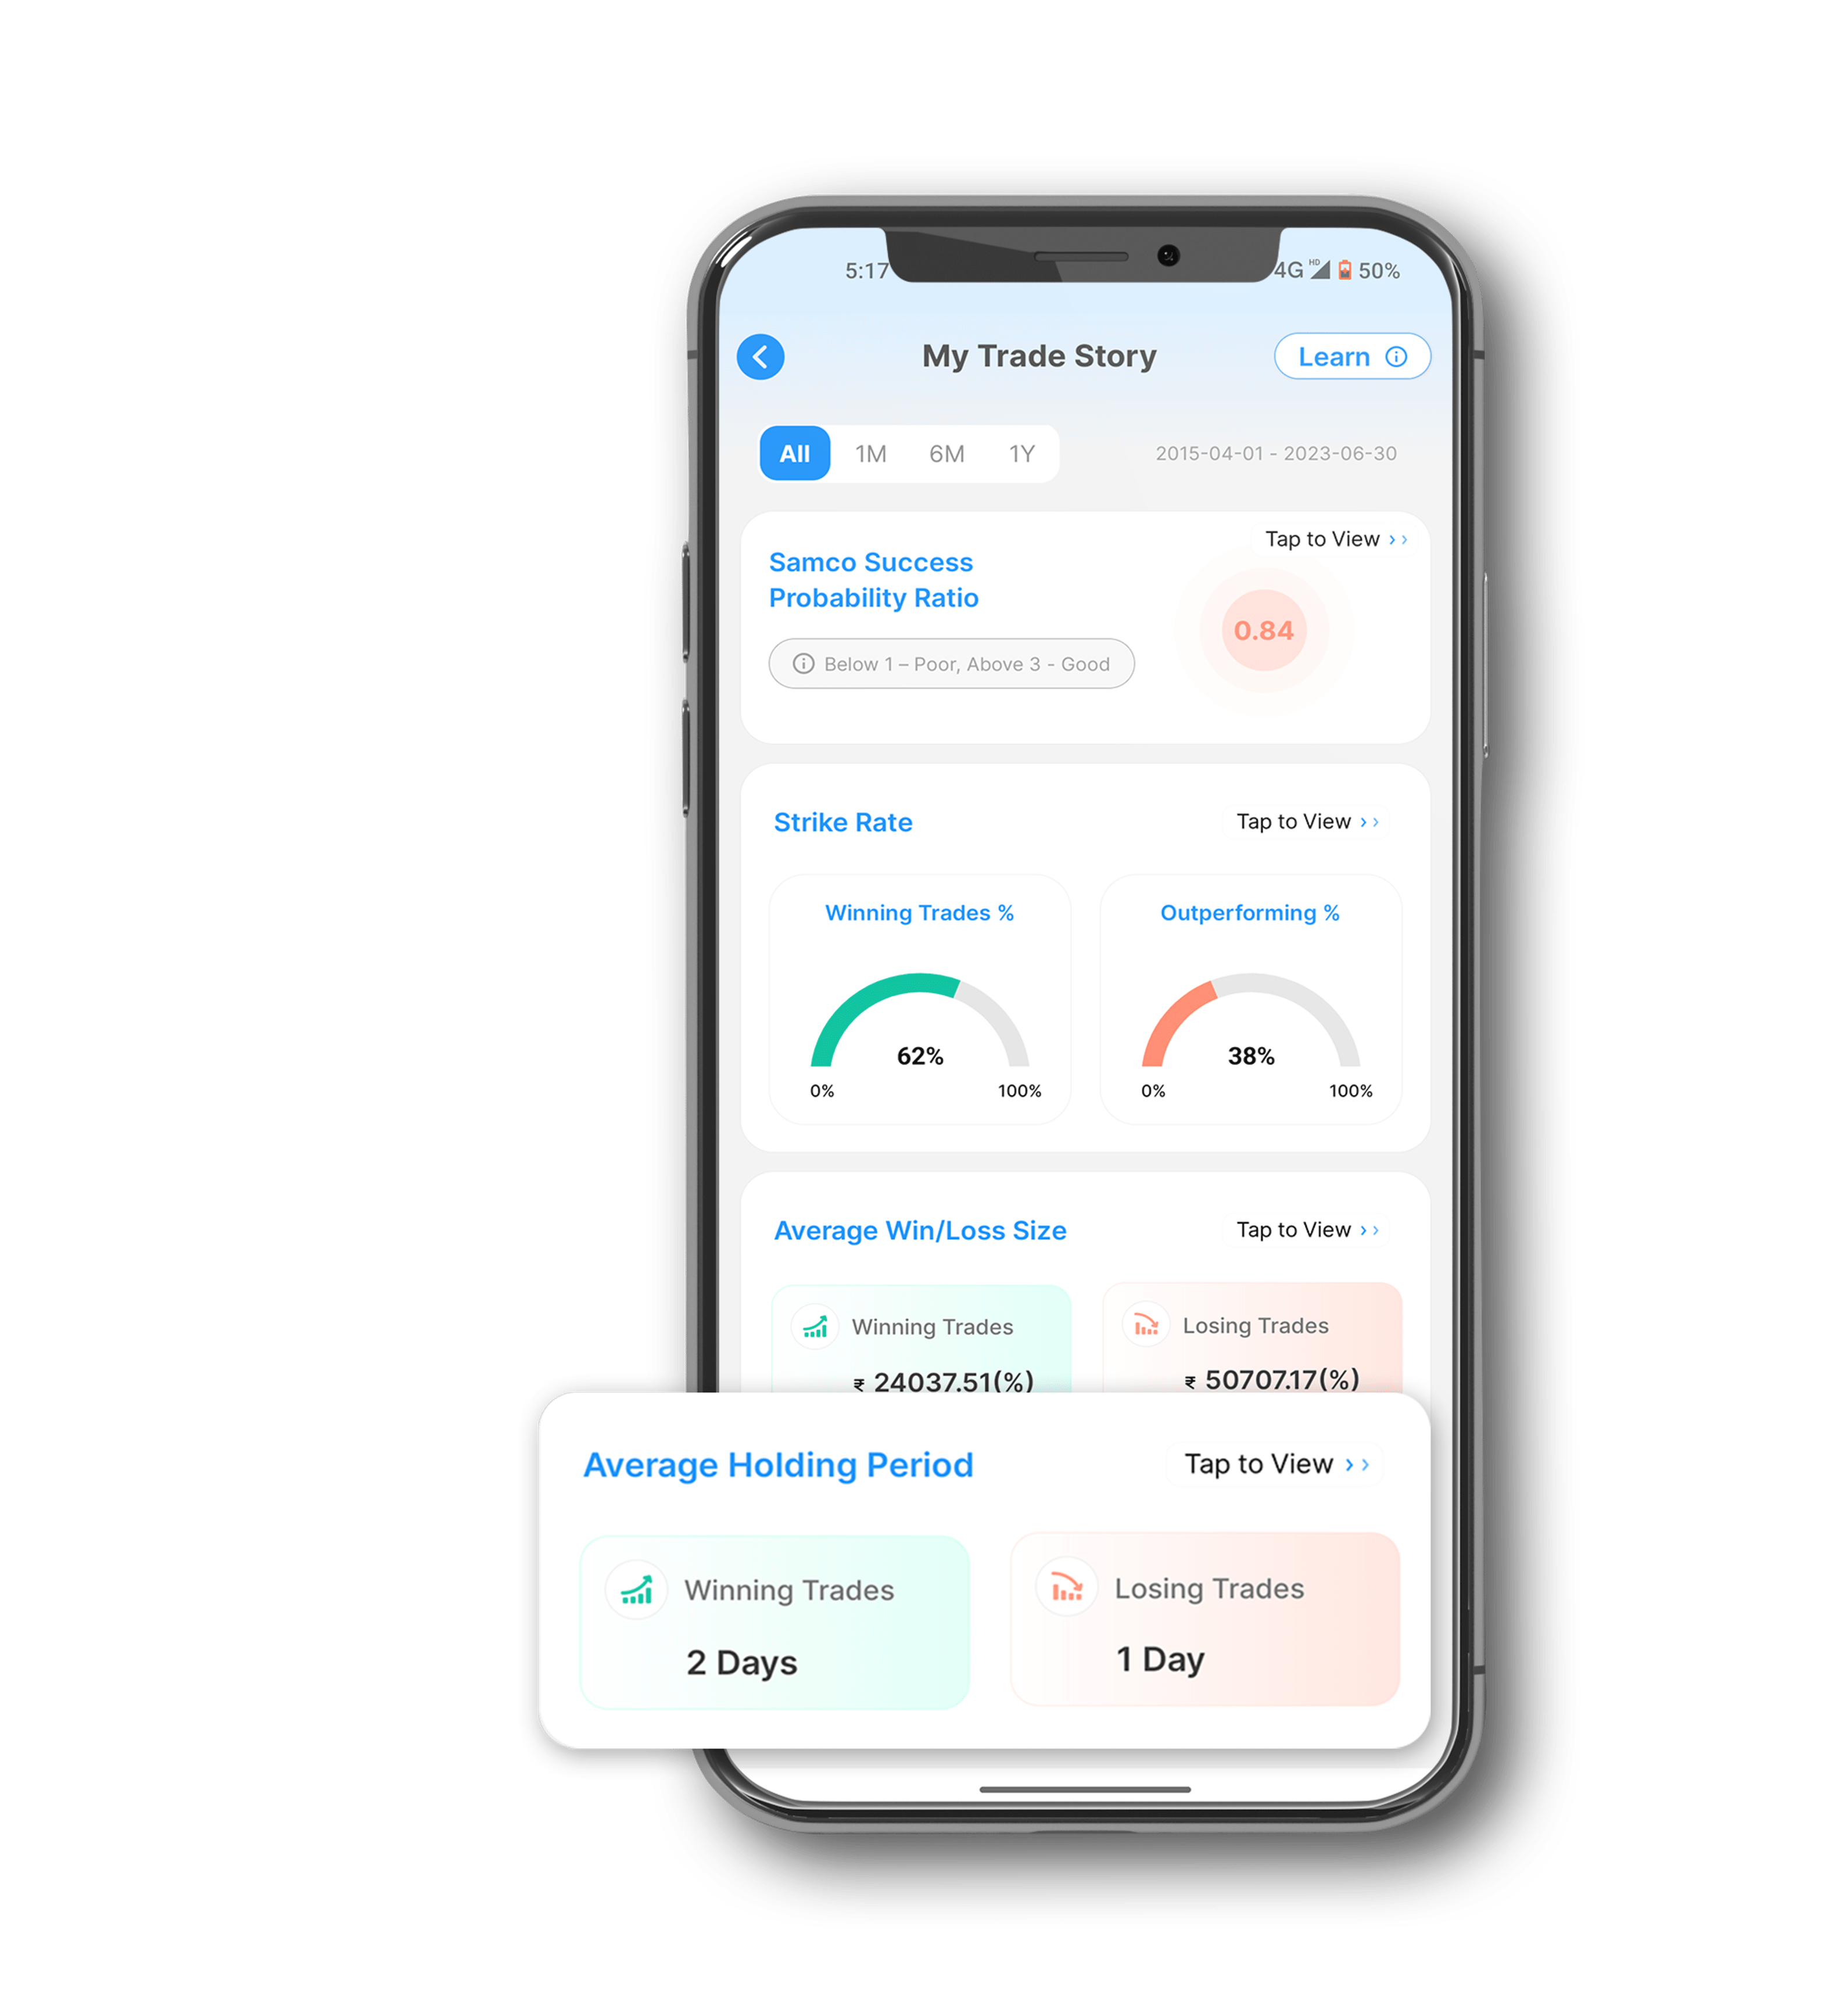
The average holding period is a section that displays the average number of days you’ve held onto both profitable and loss-making trades. This section provides valuable trading insights into the timing of your exits, which you can use to optimise your trading performance by making adjustments to your holding period.
-
Samco Trade Score
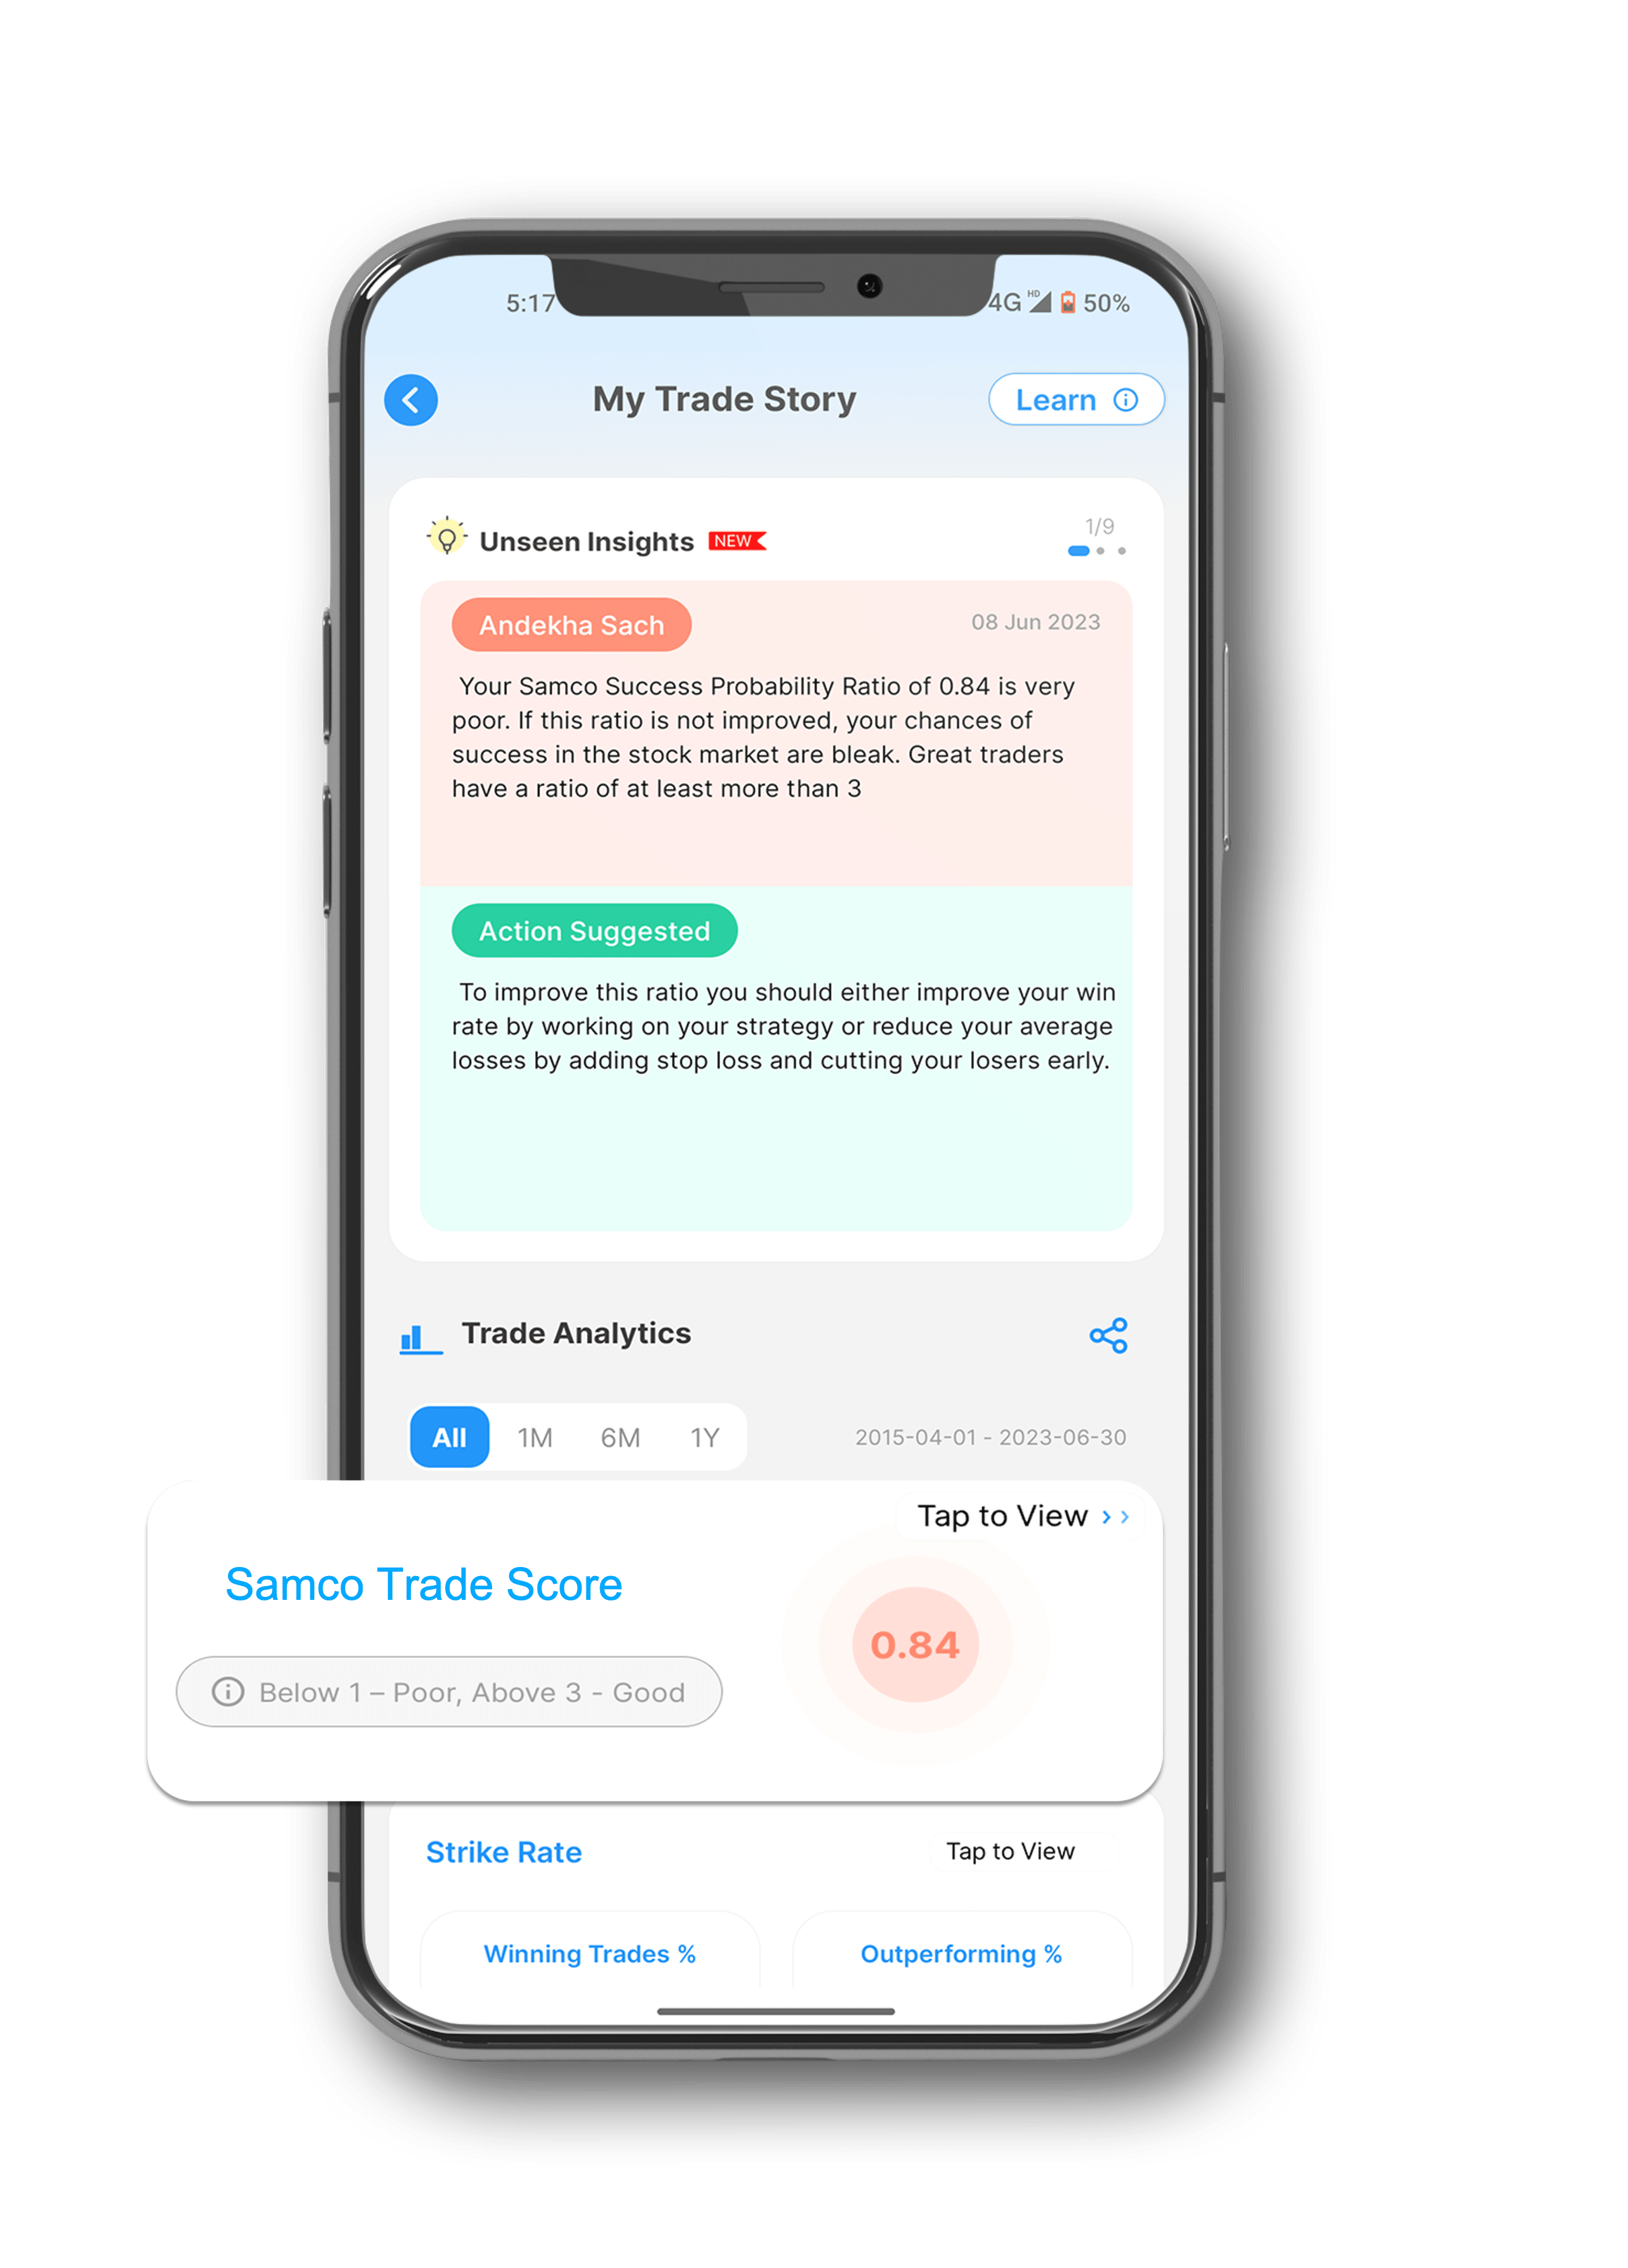
Samco Trade Score, also known as the Samco Success Probability Ratio (SSP Ratio), is a unique metric that shows you just how successful you are at trading in the share market. A trade score of below 1 is considered poor, whereas a score of 1 to 3 is considered average to good. Traders who score above 3 are considered very good. The following formula is used to arrive at your trade score.
|
Samco Trade Score = (Winning Trade % x Avg Gain %) ÷ (Losing Trade % x Avg Loss %) |
The Samco Trade Score is refreshed periodically as you continue to trade, allowing you to monitor your progress. For more context and in-depth information, you can also filter the SSP Ratio on the basis of trading segments, sectors and market capitalisation of stocks.
-
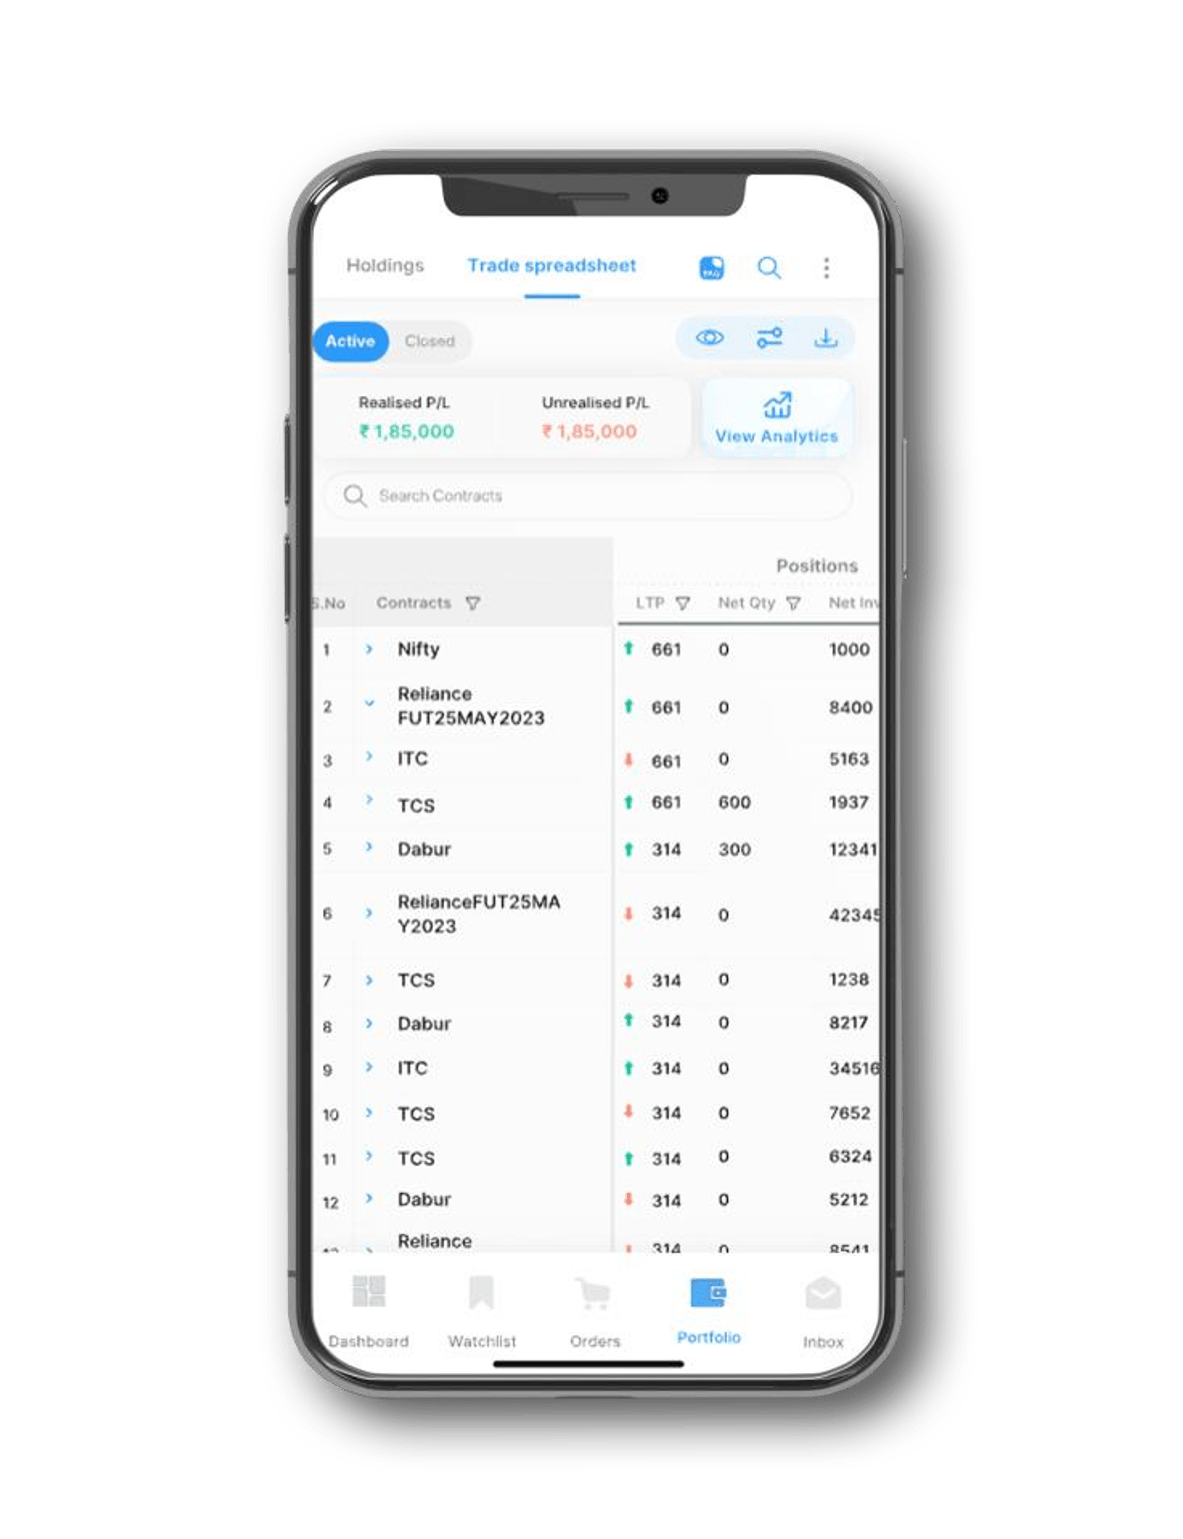
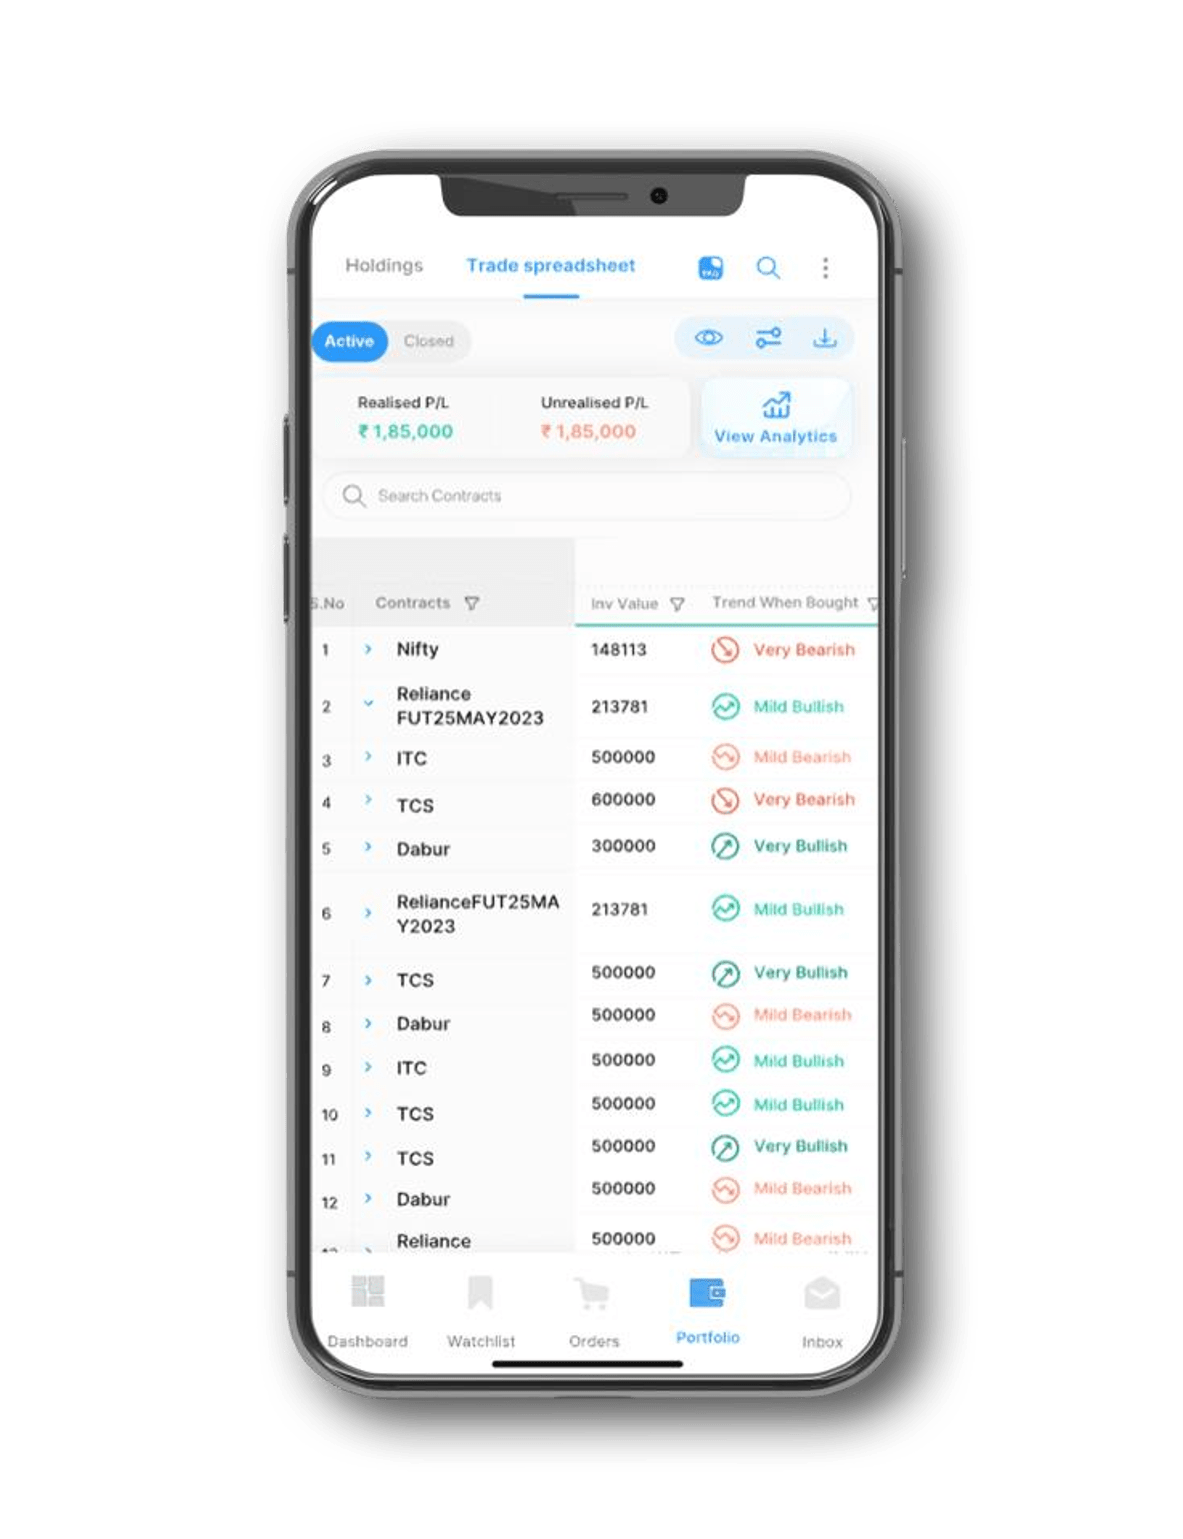
My Trade Spreadsheet
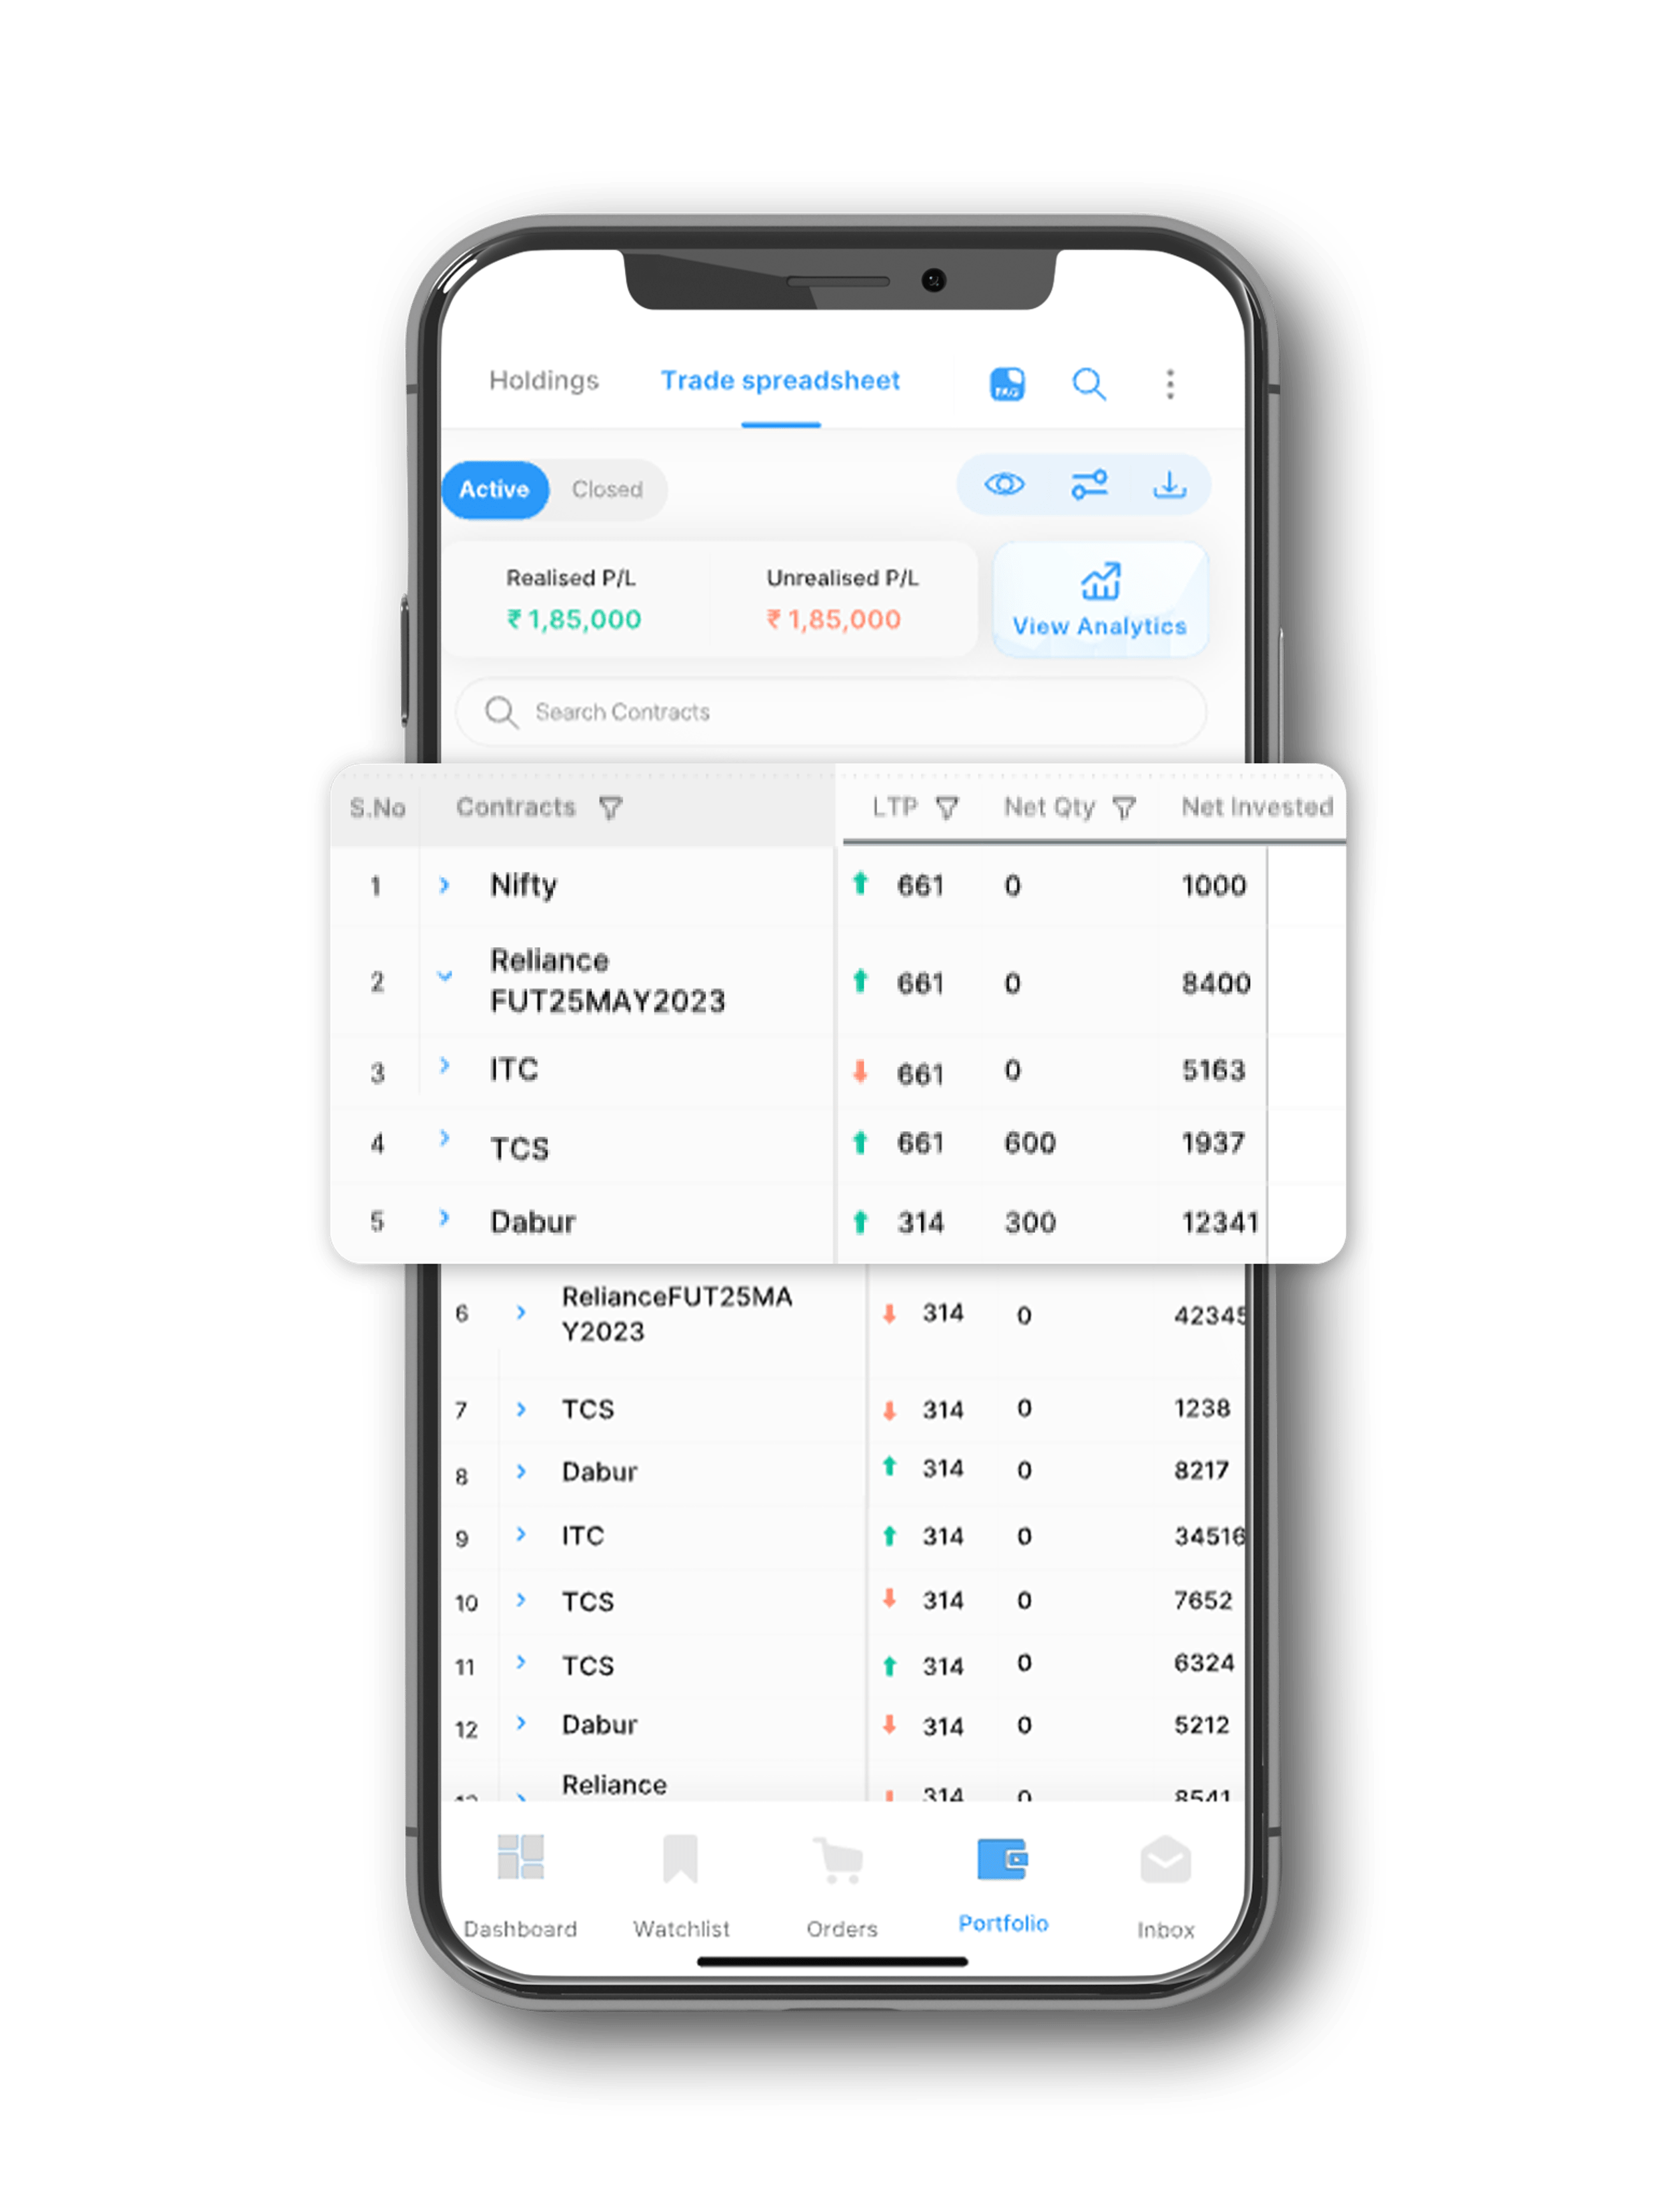
My Trade Spreadsheet is another first-of-a-kind feature in the Samco trading app. It is India’s most advanced trade book that offers in-depth trading insights in addition to regular trade-related information. My Trade Spreadsheet analyses every single component and data point of your past trades to generate insights into your performance so that you can identify profitable patterns and mistakes. Here’s a quick overview of some of the unseen trading insights you get under the My Trade Spreadsheet function of the app.
-
Round Trade View
Most trade books of other stockbroking platforms generally show buy and sell trades for stocks separately. This makes it hard to identify and track trades, especially if the entry and exit trades are placed on different dates. Here’s where the Round Trade View of My Trade Spreadsheet comes in handy.
Round Trade View automatically matches all sell orders with their respective buy orders and presents the information in an organised table format in chronological order. This enables you to quickly and accurately identify trades.
-
Trade-Level Insights
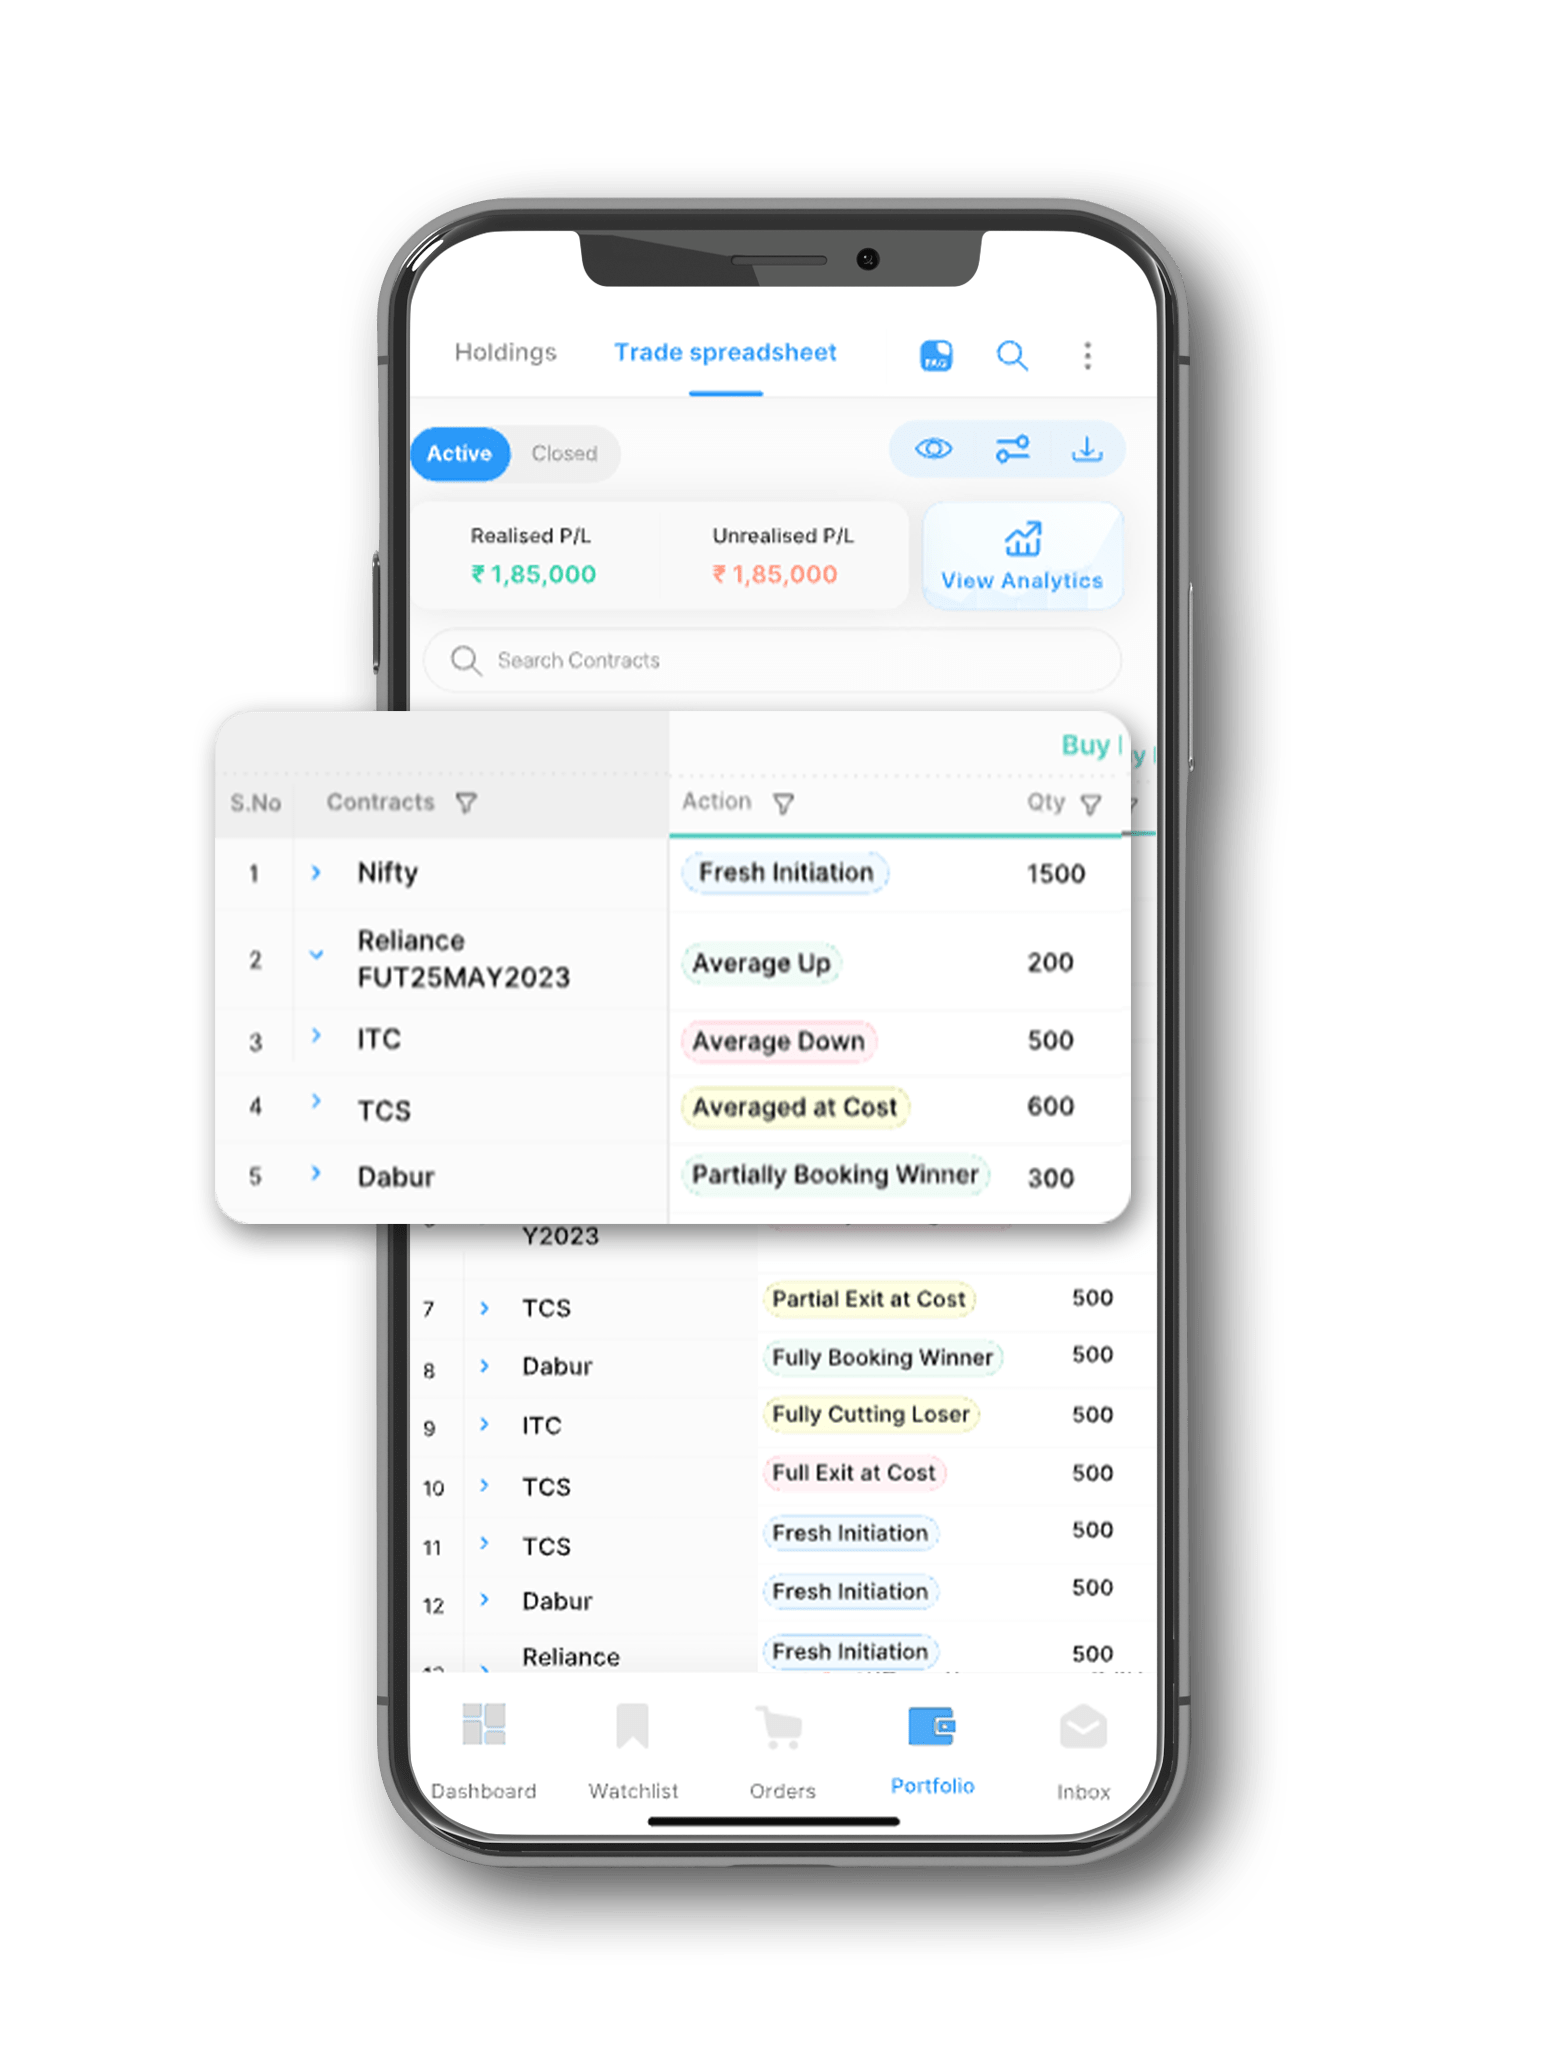
In addition to the Round Trade View, you also get trade-level insights where all of your trades are categorised according to the nature of the trade. Trades can be categorised into either of the following categories -
-
Fresh Initiations
Newly entered trades are categorised as fresh initiations.
-
Average Up
Trades that add more quantity to an already held asset at a price higher than the original trade are marked as average up trades.
-
Average Down
Trades that add more quantity to an already held asset at a price lower than the original trade are marked as average down trades.
-
Average at Cost
Trades that add more quantity to an already held asset at the same price as the original trade are marked as average at-cost trades.
-
Partially Booking Winners
Trades that partially square off existing positions at a profit are categorised as partially booking winners.
-
Partially Booking Losers
Trades that partially square off existing positions at a loss are categorised as partially booking losers.
-
Fully Unwinding Winners
Trades that fully square off existing positions at a profit are categorised as fully unwinding winners.
-
Fully Unwinding Losers
Trades that fully square off existing positions at a loss are categorised as fully unwinding losers.
-
Maximum Potential Profits or Losses
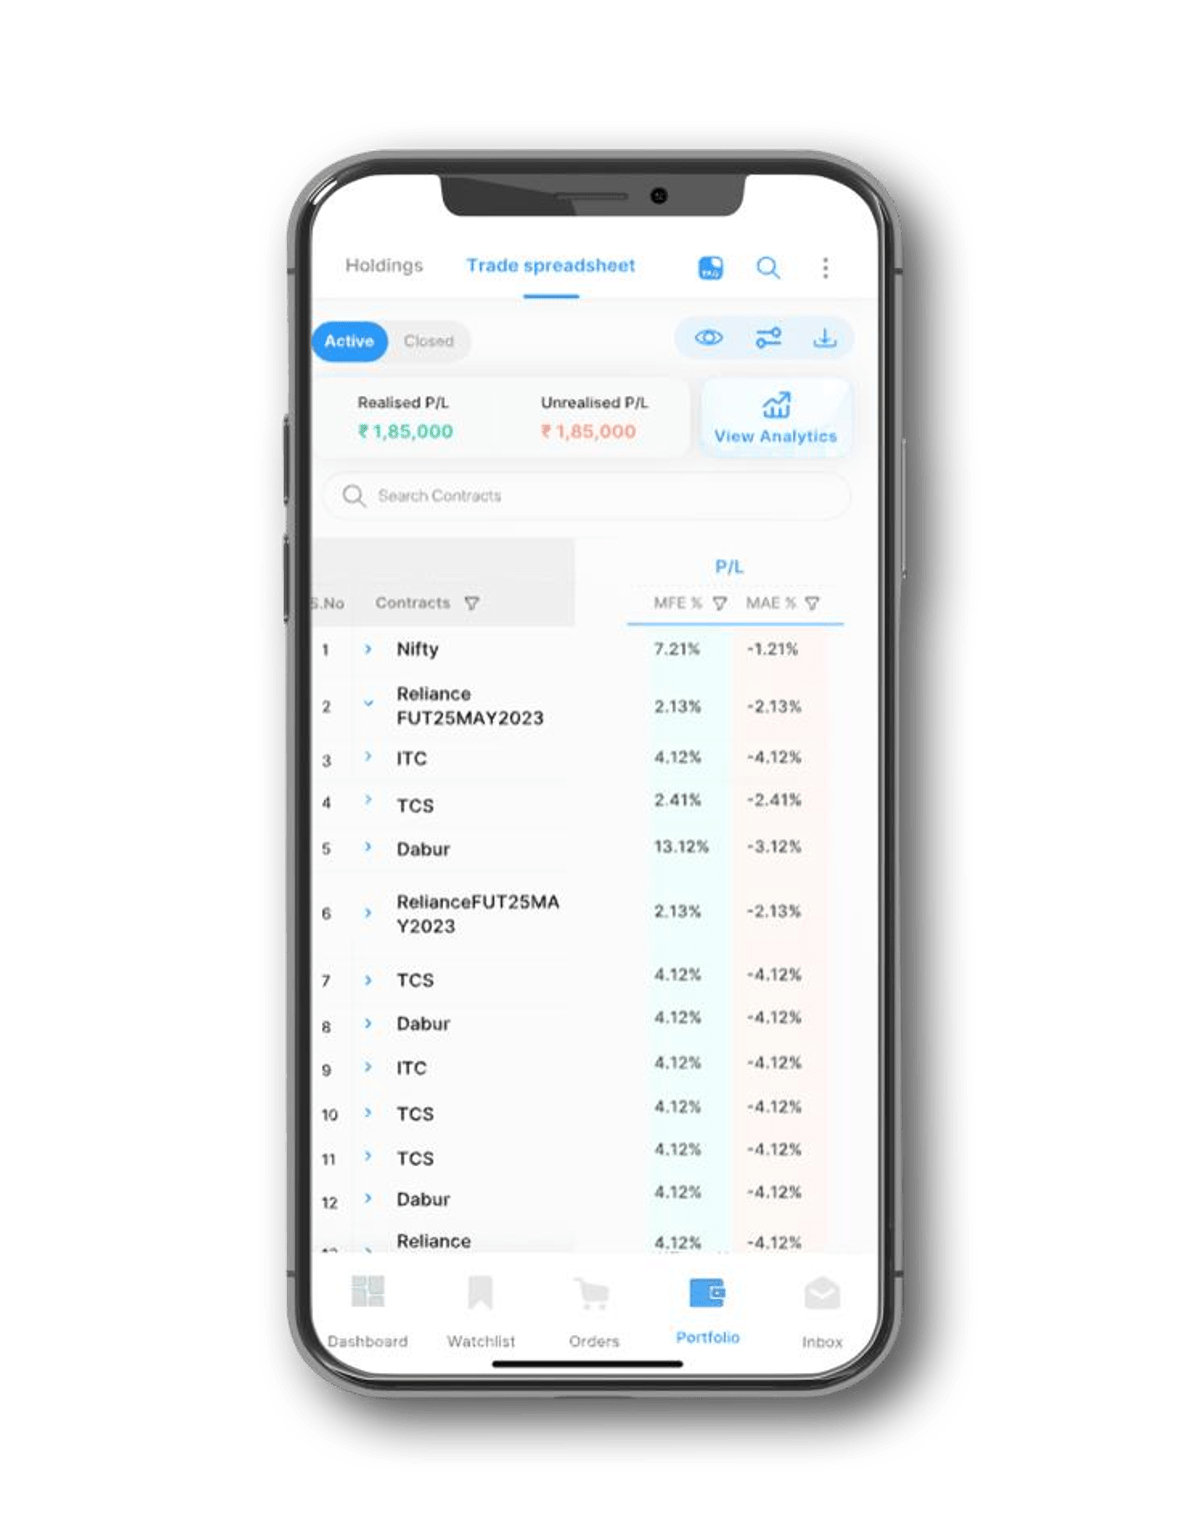
As the name implies, maximum potential profits indicate the maximum amount of profit you could have generated for a given trade had you squared off your position at the right time. It is designed to help you evaluate your performance by enabling you to compare your results with the best-case scenario for a trade.
Maximum potential losses, on the other hand, indicate the maximum amount of loss you could have experienced for a trade. It provides you with an Andekha Sach into the worst-case scenario for a trade.
-
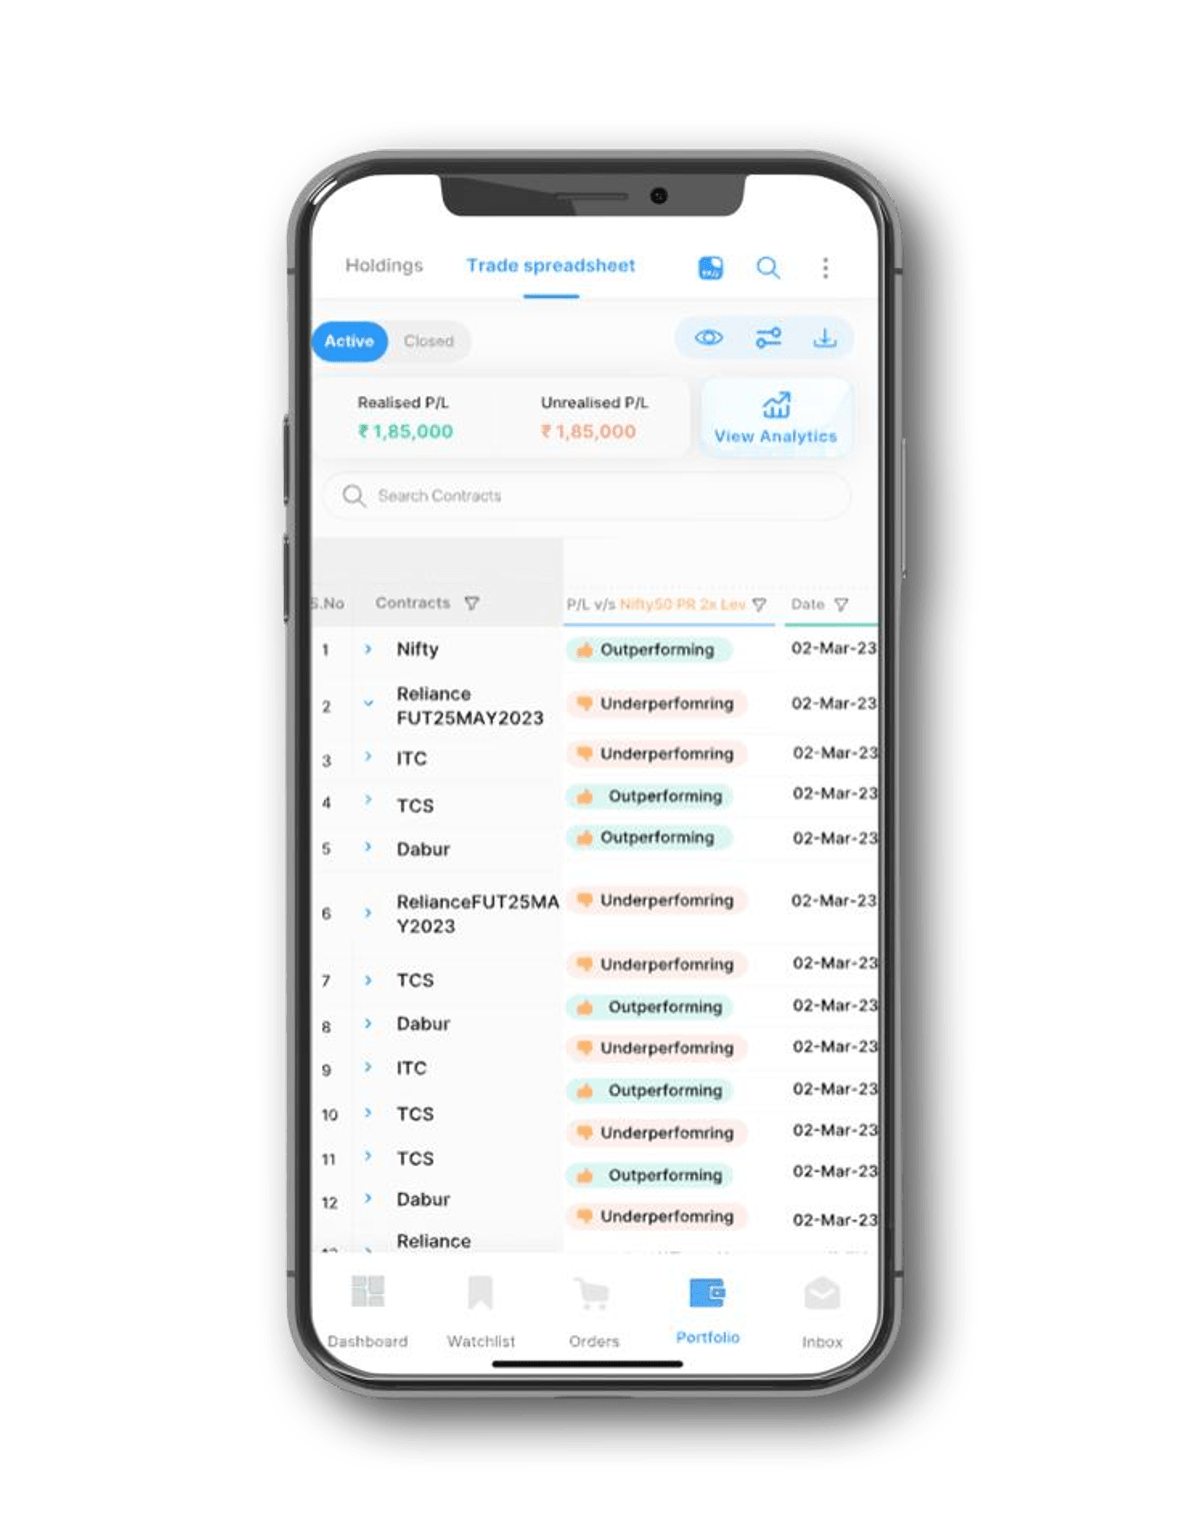
Performance-Level Insights
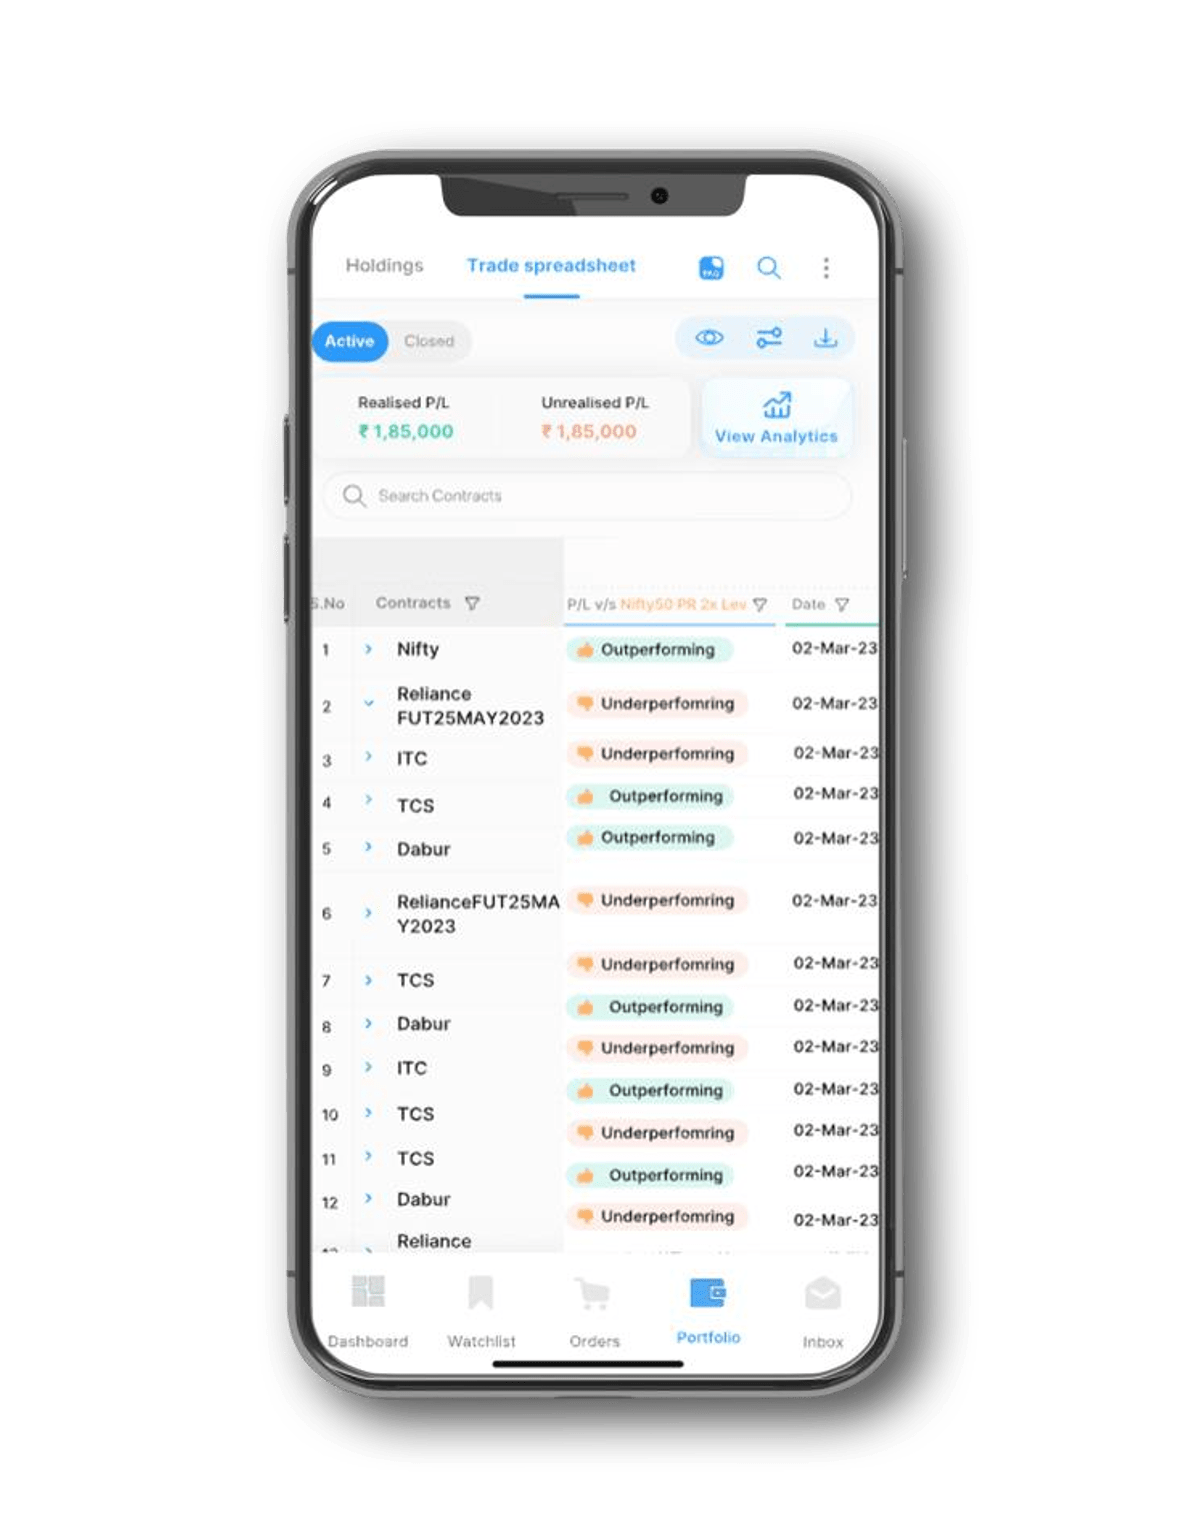
Performance-level trading insights give you an overview of how your trades have performed relative to your benchmark index. It organises all your trades into two categories - outperforming and underperforming. Outperforming trades are those that generate returns higher than your benchmark index, whereas underperforming trades are those that generate returns lower than the index.
-
P&L in Benchmark Index
Another very useful Andekha Sach that the My Trade Spreadsheet feature in the Samco trading app offers is the P&L in Benchmark Index. This is a metric that displays the returns you would have generated had you invested the capital used for trading in your benchmark index.
P&L in the Benchmark index is calculated by multiplying the amount invested in a trade by the percentage returns of your benchmark index. The metric gives you a better context to your trading performance by comparing it with the benchmark in rupee terms.
-
Trend When Bought
As the name indicates, this section displays the trends of the stocks or other assets at the time of entering or exiting. The four categories of trends are as follows - very bullish, mild bullish, mild bearish and very bearish. By comparing your trade with the prevailing trend, you can gain crucial trading insights that can help you improve your future performance.
-
Trade vs. Trend
The Trade vs. Trend feature compares your trades with the prevailing trend and categorises them into either of the following - aligned with the trend or against the trend. Trades that match with the current prevailing trend are marked as aligned with the trend. For instance, if you purchase stocks when the market is bullish, the trades will be marked as aligned with the trend. Meanwhile, trades that don’t match the prevailing trend are categorised as against the trend.
-
Technical Indicators
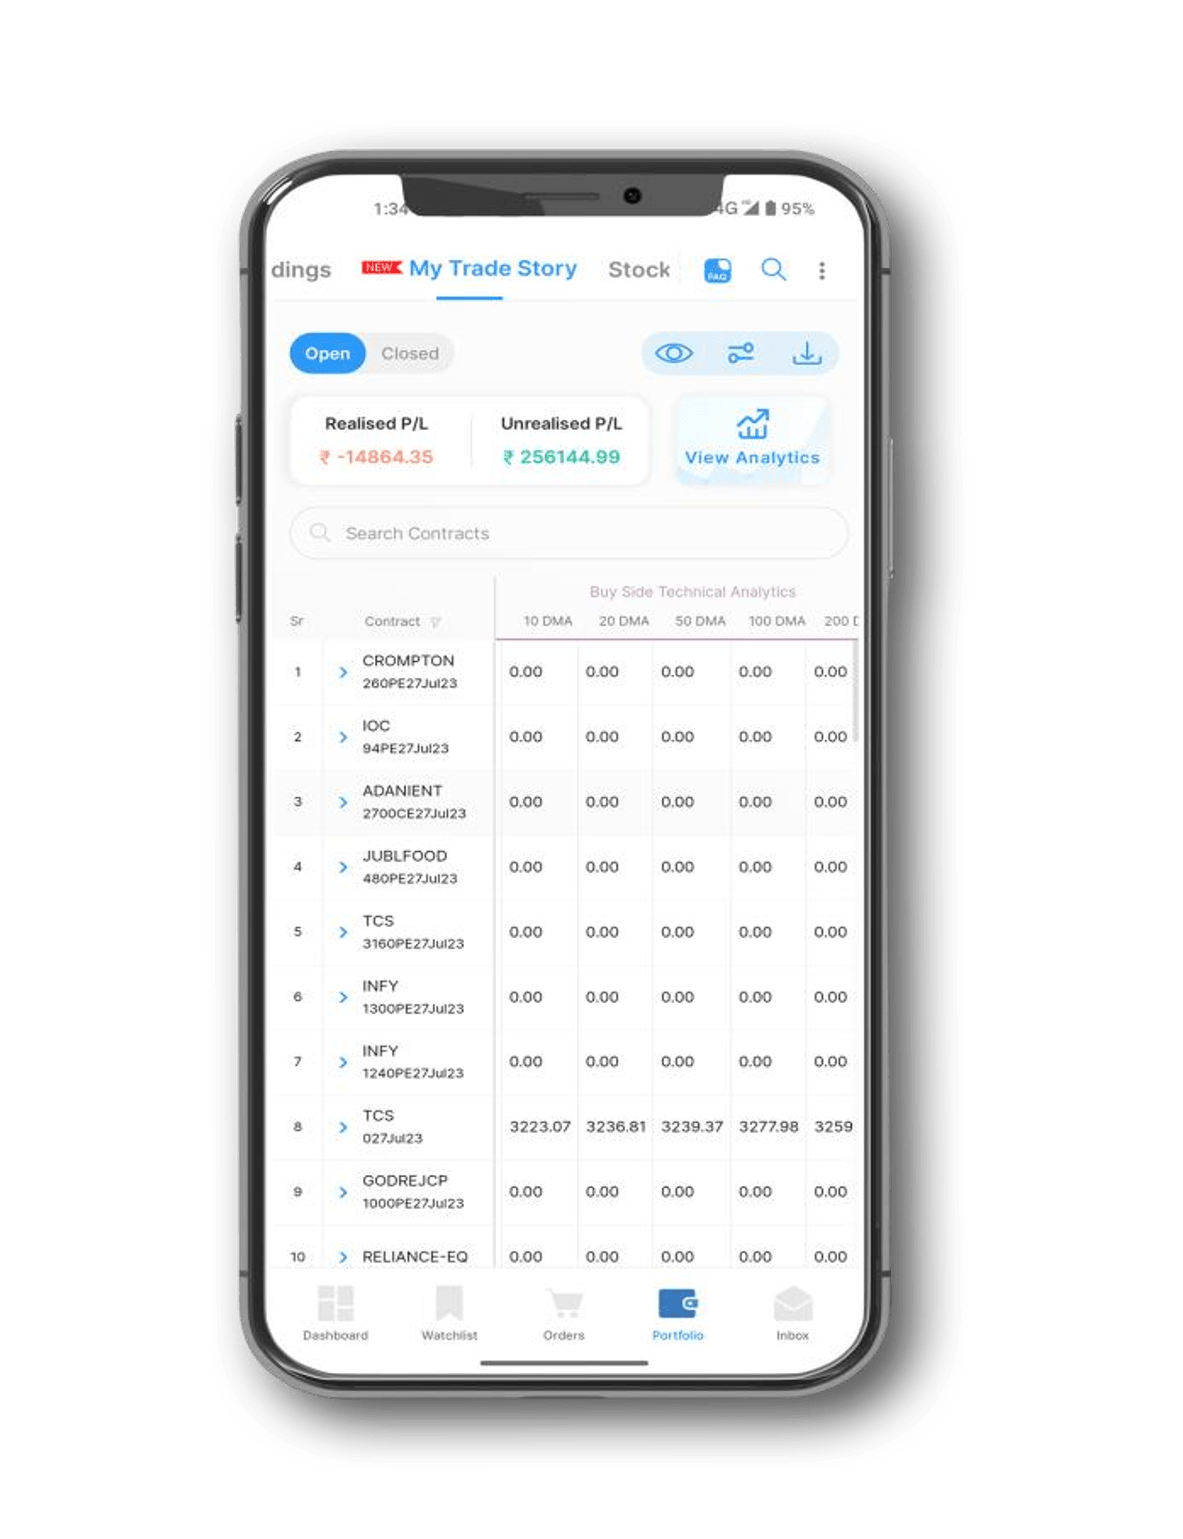
My Trade Spreadsheet will display key technical indicators for every buy and sell trade you make. Some of the indicators you can find include the Relative Strength Index (RSI) and moving averages including Displaced Moving Average (DMA). You can easily ascertain whether you entered or exited the position at the right time by comparing the timing of your buy and sell trades with their respective technical indicators.
What Benefits Does Andekha Sach Offer to Traders?
Now that you’ve seen the various unseen trading insights that the Samco trading app provides, here’s a quick glimpse into some of the advantages of these Andekha Sach.
-
Easy Identification of Profitable Patterns
Andekha Sach lets you quickly identify patterns that lead to better profitability by thoroughly analysing each of your trades. For instance, you may find out that placing trailing stop-loss orders leads to better profitability in the long run or that averaging down protects you from losses better.
-
Position Size Optimisation
A high position size may lead to better profits but it may also enhance your losses. Therefore, when it comes to short-term trading, determining the ideal position size is crucial for success. By analysing the various trading insights available on the Samco trading app, you can determine the optimal position size for your trading style.
-
Fine Tuning of Entry and Exit Points
Entering and exiting a position at the right time leads to better profitability. The trade-related and performance-related Andekha Sach can help you determine the optimal entry and exit point for a trade.
-
Risk-Reward Ratio Evaluation
My Trade Spreadsheet and My Trade Story comprehensively break down your trades into smaller bits of information that are easier to read and understand. This makes the evaluation of the risk-reward ratio for stocks and other contracts a lot easier.
Conclusion
While the Andekha Sach that Samco’s trading platform provides can contribute to better trading performance, it is essential to note that it doesn’t guarantee success. Since the financial markets can be unpredictable and volatile, proper risk management is crucial to protect your investment capital.
The extensive trading insights explained above are available for free for all existing Samco customers. If you wish to supercharge your trading performance and enhance your profitability, sign up for a trading account with Samco Securities today to get access to all of these features and more.
That’s not all. When you open a trading and demat account with Samco, you also get other benefits like zero account opening charges, nominal brokerage on all orders and up to 4X leverage on equity delivery trades. So, sign up with us today and become a better trader.
Disclaimer: INVESTMENT IN SECURITIES MARKET ARE SUBJECT TO MARKET RISKS, READ ALL THE RELATED DOCUMENTS CAREFULLY BEFORE INVESTING. The asset classes and securities quoted in the film are exemplary and are not recommendatory. SAMCO Securities Limited (Formerly known as Samruddhi Stock Brokers Limited): BSE: 935 | NSE: 12135 | MSEI- 31600 | SEBI Reg. No.: INZ000002535 | AMFI Reg. No. 120121 | Depository Participant: CDSL: IN-DP-CDSL-443-2008 CIN No.: U67120MH2004PLC146183 | SAMCO Commodities Limited (Formerly known as Samruddhi Tradecom India Limited) | MCX- 55190 | SEBI Reg. No.: INZ000013932 Registered Address: Samco Securities Limited, 1004 - A, 10th Floor, Naman Midtown - A Wing, Senapati Bapat Marg, Prabhadevi, Mumbai - 400 013, Maharashtra, India. For any complaints Email - grievances@samco.in Research Analysts -SEBI Reg.No.-INHO0O0005847


 Easy & quick
Leave A Comment?