

How should an Investor look at a balance Sheet for fundamental analysis?
Introduction: Balance Sheet and P&L are the most objective way of looking at the financial position of a company. Anything and everything that the business does, get’s impartially reflected in the numbers and thus ability to read such numbers intelligently is the key to successful investing. Following are smart pointers as to what an investor should look at in a balance sheet. Latest annual report of Infosys here and Kingfisher (KFA) here are used as a references. The balance sheet is a snapshot of a company’s financial situation at a point in time, usually on the last day of its financial year. It captures everything the company owns and all the liabilities that it has to pay. In the broadest sense, it captures the elements of the so-called balance sheet equation:
Assets = Liabilities + Shareholders’ funds
While the balance sheet is structured based on Schedule 3 of Companies Act, 2013 found here, and every listed company has to follow Indian Accounting Standards (Ind-AS). Investors should be interested in the following heads:
The balance sheet is a snapshot of a company’s financial situation at a point in time, usually on the last day of its financial year. It captures everything the company owns and all the liabilities that it has to pay. In the broadest sense, it captures the elements of the so-called balance sheet equation:
Assets = Liabilities + Shareholders’ funds
While the balance sheet is structured based on Schedule 3 of Companies Act, 2013 found here, and every listed company has to follow Indian Accounting Standards (Ind-AS). Investors should be interested in the following heads:
- Shareholders’ capital
- Borrowings
- Fixed assets
- Net working capital
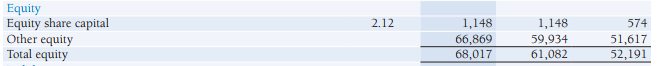 Shareholders Funds/Net Worth in a balance sheet.[/caption]
Borrowing
[caption id="attachment_2558" align="aligncenter" width="656"]
Shareholders Funds/Net Worth in a balance sheet.[/caption]
Borrowing
[caption id="attachment_2558" align="aligncenter" width="656"]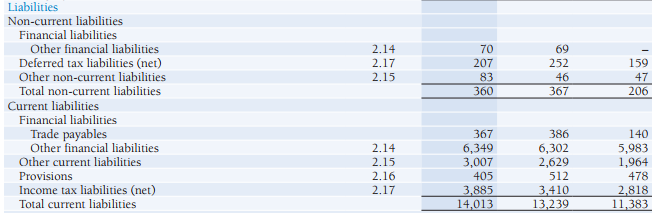 Borrowings or Liabilities profile of a Balance sheet[/caption]
Liabilities are typically divided into short-term or current obligations and long-term obligations. Current liabilities include short-term borrowings and services received but not yet paid for. This section also includes any provisions made for tax and other payments.
Non-current liabilities include any borrowings that need not be repaid within the next 12 months, and current value of tax and pensions the company expects to pay more than a year later. ‘Differed tax liabilities’ is the biggest head here - which is consistent with large IT corporations in India.
In case of Infosys, the total borrowings are at zero as it is a debt-free company. As the borrowings have been at zero for a long time, they are not shown in the balance sheet as a line item:
[caption id="attachment_2559" align="aligncenter" width="453"]
Borrowings or Liabilities profile of a Balance sheet[/caption]
Liabilities are typically divided into short-term or current obligations and long-term obligations. Current liabilities include short-term borrowings and services received but not yet paid for. This section also includes any provisions made for tax and other payments.
Non-current liabilities include any borrowings that need not be repaid within the next 12 months, and current value of tax and pensions the company expects to pay more than a year later. ‘Differed tax liabilities’ is the biggest head here - which is consistent with large IT corporations in India.
In case of Infosys, the total borrowings are at zero as it is a debt-free company. As the borrowings have been at zero for a long time, they are not shown in the balance sheet as a line item:
[caption id="attachment_2559" align="aligncenter" width="453"]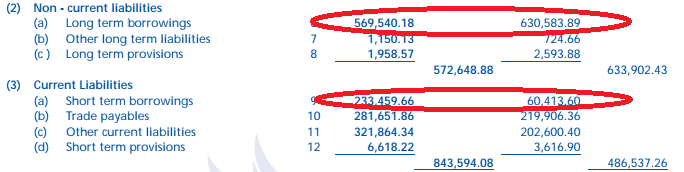 Long Term Borrowings of a risky highly indebted company[/caption]
Fixed assets
[caption id="attachment_2561" align="aligncenter" width="659"]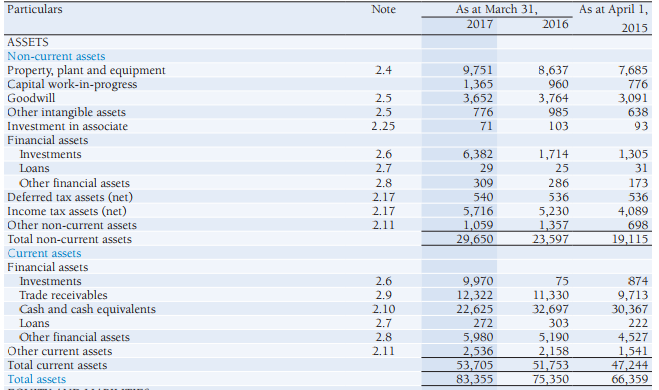 Assets side of the Balance Sheet[/caption]
Assets are usually segregated into short-term assets, which are usually less than one year old and are called current assets, long-term assets which are older than one year are called non-current assets.
An important part of ‘non-current assets’ is fixed asset listed here as “Property, Plant and Equipment” and “Capital work-in-progress”. Fixed Assets are long-term tangible pieces of properties that a company holds. Capital work-in-progress is capital expenditure incurred for expansion that is not yet completed. For example, if a company wants to set up a new office - all the expense on the office till it becomes functional will be classified as capital work-in-progress.
‘Current assets’ consists of cash and near-cash asset - that is things that can be quickly turned into cash. In case of Infosys, these are typically investments and receivables for services delivered but not yet paid for. For a manufacturing company, this will include all inventory held for sale and products that have already left company premises but are not yet been paid for.
Below is a snapshot from KFA showing their fixed assets:
[caption id="attachment_2562" align="aligncenter" width="714"]
Assets side of the Balance Sheet[/caption]
Assets are usually segregated into short-term assets, which are usually less than one year old and are called current assets, long-term assets which are older than one year are called non-current assets.
An important part of ‘non-current assets’ is fixed asset listed here as “Property, Plant and Equipment” and “Capital work-in-progress”. Fixed Assets are long-term tangible pieces of properties that a company holds. Capital work-in-progress is capital expenditure incurred for expansion that is not yet completed. For example, if a company wants to set up a new office - all the expense on the office till it becomes functional will be classified as capital work-in-progress.
‘Current assets’ consists of cash and near-cash asset - that is things that can be quickly turned into cash. In case of Infosys, these are typically investments and receivables for services delivered but not yet paid for. For a manufacturing company, this will include all inventory held for sale and products that have already left company premises but are not yet been paid for.
Below is a snapshot from KFA showing their fixed assets:
[caption id="attachment_2562" align="aligncenter" width="714"]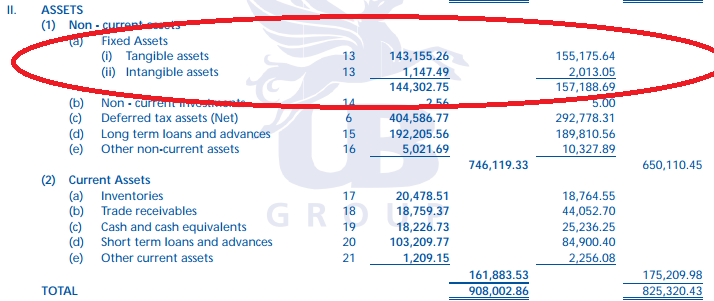 Fixed Assets Example / Illustration[/caption]
Net working capital
Net working capital is current asset less current liability. This is a measure of company’s short term liquidity and an indicator of asset utilization. In case of Infosys, from the snapshots above: Current assets as on March 31, 2017: Rs. 53,705Cr Current liabilities as on March 31, 2017: Rs.(14,013)Cr Net working capital: Rs. 39,692Cr Red flags Let us start by listing out some of the tell-tale signs of a weak balance sheet.- Negative retained earnings: Retained earning is a way to measure the cumulative net income of a company. Negative retained earnings may indicate that company has been accumulating losses over the few years. Below is a snapshot from KFA showing the same under “Surplus”. It stands at Rs. 5,348CR as on March 31, 2011 and Rs. 7,676 Cr as on March 31, 2012
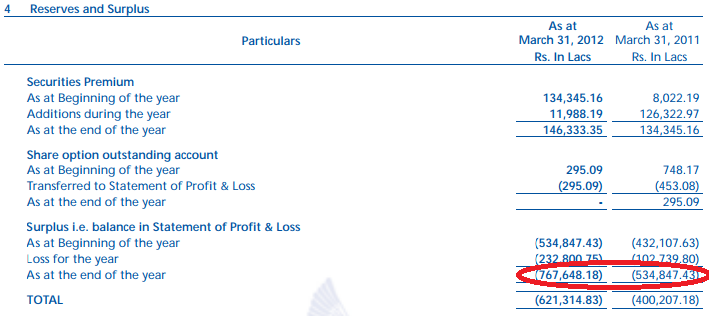 Negative Retained Earnings in a balance sheet - Example/Illustration[/caption]
- Negative equity: This happens when the deficit in retained earnings is higher than the capital the company has raised. When this happens, the company either has to raise new capital by selling more stock or file for bankruptcy. While successful companies can have an odd year when the retained earnings are in red (eg. Suzlon Energy) but a negative equity means too high a distress to keep investor confidence.
- Negative net tangible assets: Net tangible asset is Equity less Goodwill. Goodwill is the amount that a company pays to acquire another company in excess of the tangible assets the acquired company holds i.e. net worth less book value. It is “intangible” and cannot be sold and has to be made up for by running the acquired company successfully. Negative net tangible assets could indicate failed mergers that are taking the company down.
- Low current ratio: The ratio of a company’s current assets to its current liability is the current ratio. In case of Infosys this ratio is: 53,705/14,013 = 3.83. This indicates a highly liquid company Current ratio under 1 signals that the company has trouble meeting its immediate obligations and may indicate other problems. Though, keep in mind that capital intensive industries will have a lower current ratio. For example, Indian Oil Corp’s current ratio is typically between 0.8 and 1.6 - but that does not mean their balance sheet is weak.
Identifying strong balance sheet
- Debt to equity ratio: Debt-to-equity ratio indicates how the company has sourced the funds to meet their liabilities. This is a matter of choice, and there is no ideal value of this ratio. Though it is wise to compare the ratio to industry averages. Equally, pay attention to the interest rates the company has to pay and whether it has enough head room in case the business faces a pressure on margins. Remember that the debtor can call for payment anytime, whereas equity is forever with the company.
- Stock-in-trade: In balance sheet, stock-in-trade is referred to as inventory. It is the stock of finished goods that has not been sold yet. In case of KFA, from the snapshot above, it rose from Rs. 187Cr to Rs. 204Cr. Though it is listed under assets based on the assumption that all of it will be sold, it is important to pay attention to the trend in the values over longer periods. But higher quantums of inventory carry risks of obsolesce, spoilage and shrinkage. Always compare this value to the industry average to get a sense of proportion. Ideally, it should stay close to the averages unless a Just In Time system is employed, in which case it should be low.
- Cash and short-term investments: A strong company will have piles of cash, substantial bank balance and short-term investments. This not only means that the company can fund its current liabilities but can also return value to shareholders through dividends and stock repurchase. Do keep in mind that cash component gives no returns and that service companies typically have higher cash-in-hand compared to manufacturing companies.
- Low or zero long-term borrowings: The best companies to invest in are the ones with zero long-term debt. It is no coincidence that Infosys, ITC, Hindustan Unilever all are debt free. Exception to this is bank and financial service providers as discussed above.
- Undervalued assets: In a balance sheet fixed assets are held at cost less accumulated depreciation. This means there actual value may be different from the book value. Investors should look at real estate and intellectual properties that may be undervalued in the balanced sheet.


 Easy & quick
Leave A Comment?