
Sharp market corrections often trigger concern among investors. However, historical data suggests that significant weekly declines in the Nifty 50 have frequently been followed by short-term recoveries or stabilisation phases.
Over the past 15 years, the benchmark index has experienced several instances where it dropped by more than 5% in a single week. Interestingly, these sharp corrections have often created conditions for a technical rebound in the following weeks, provided there is no broader systemic stress in the market.
Understanding these historical patterns can help investors better interpret market volatility and make more informed investment decisions.
Historical Instances of 5% Weekly Declines
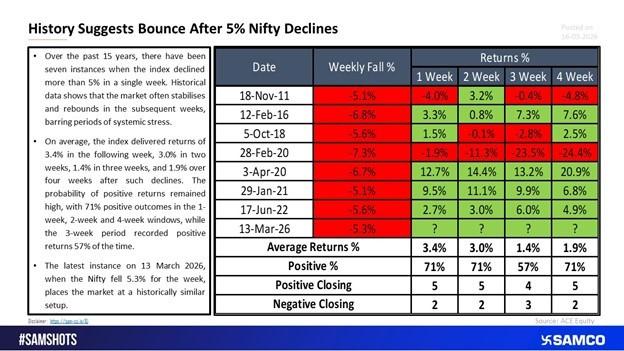
Market data shows that there have been 7 major instances in the past 15 years when the Nifty 50 recorded a weekly decline of more than 5%. These events occurred during different market environments, including global uncertainties, economic slowdowns, and sudden shifts in investor sentiment.
Despite the sharp declines, the index frequently stabilised and recovered in the weeks that followed. The chart above highlights these instances and the subsequent returns across different time frames.
Average Returns After a 5% Weekly Fall
Historical performance reveals a consistent pattern of recovery following steep weekly corrections.
On average, the Nifty 50 delivered the following returns after a 5% weekly decline:
- 1 Week: 3.4% average return
- 2 Weeks: 3.0% average return
- 3 Weeks: 1.4% average return
- 4 Weeks: 1.9% average return
These figures suggest that sharp market corrections often lead to short-term recovery phases, driven by bargain buying, technical support levels, and improving investor sentiment.
Probability of Positive Returns
Another important insight from historical data is the probability of positive returns after such corrections.
The success rate of positive returns following a weekly fall of more than 5% has been relatively high:
- 71% probability of positive returns after 1 week
- 71% probability after 2 weeks
- 57% probability after 3 weeks
- 71% probability after 4 weeks
This pattern indicates that markets often rebound after sharp declines, though the timing and magnitude of the recovery can vary with broader economic conditions.
The Latest Market Setup – March 2026
The most recent occurrence occurred on 13 March 2026, when the Nifty 50 declined approximately 5.3% over the week.
Historically, similar declines have placed the market in a setup where a short-term bounce or stabilisation becomes more likely. Such rebounds are often driven by:
- Short-covering in the derivatives market
- Value buying by institutional investors
- Technical support levels attracting demand
However, it is important to remember that historical trends do not guarantee future outcomes. Market behaviour can also be influenced by global macroeconomic conditions, interest rate changes, geopolitical developments, and liquidity flows.
What This Means for Investors?
For investors and traders, sharp market corrections can present both risks and opportunities. While volatility tends to increase during such periods, historical data suggests that steep weekly declines have often been followed by short-term recovery phases in the Nifty 50.
Investors may consider focusing on:
- Maintaining a long-term investment perspective
- Avoiding panic selling during short-term volatility
- Identifying fundamentally strong stocks during market corrections
- Monitoring key technical support levels
Ultimately, understanding historical market behaviour can provide valuable context when navigating periods of heightened volatility.
Conclusion
Historical trends show that weekly declines of more than 5% in the Nifty 50 have often been followed by positive returns in the subsequent weeks. While not every instance results in an immediate rebound, the data suggests that markets frequently stabilise after sharp corrections.
The recent 5.3% weekly decline in March 2026 places the market in a historically comparable setup. If past patterns hold, the coming weeks could see improved stability or a potential rebound, although investors should continue to monitor macroeconomic and global market developments closely.


 Easy & quick
Leave A Comment?