
Market Breadth Weakens Across Large, Mid, and Small-Cap Stocks
Recent market breadth data indicates broad-based weakness across Indian equities, with a majority of stocks trading below key technical moving averages. The decline is visible across large-cap, mid-cap, and small-cap segments, highlighting fading momentum and increasing selling pressure in the broader market.
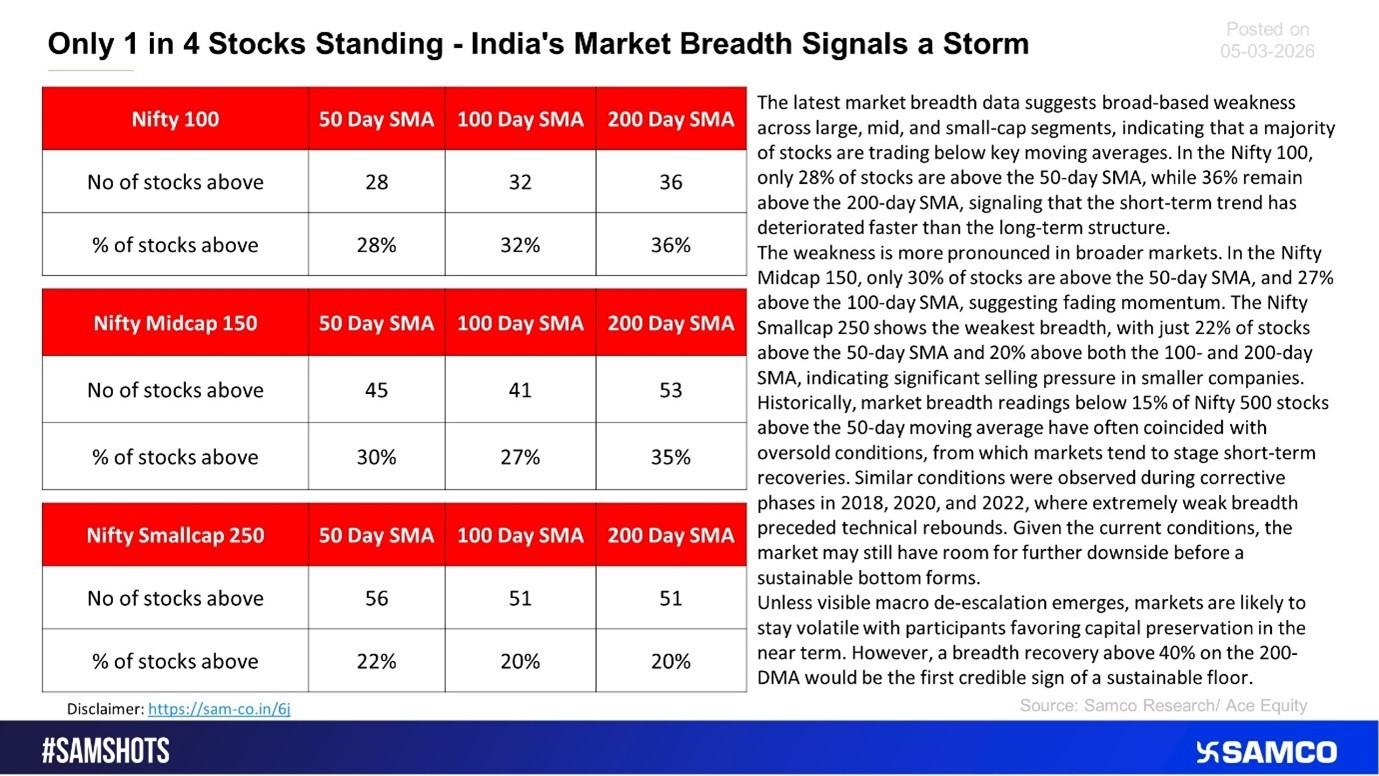
In the Nifty 100, only 28% of stocks are trading above their 50-day Simple Moving Average (SMA), while 36% remain above the 200-day SMA. This suggests that short-term market momentum has deteriorated much faster than the long-term trend, indicating growing weakness in large-cap stocks.
Midcap and Smallcap Stocks Show Deeper Weakness
The pressure becomes more evident in the broader market segments.
In the Nifty Midcap 150, only:
- 30% of stocks are above the 50-day SMA
- 27% of stocks are above the 100-day SMA
This decline signals weakening momentum and sustained selling pressure in mid-cap stocks, which typically act as an early indicator of broader market sentiment.
The Nifty Smallcap 250 index shows the weakest market breadth among the three segments. Data suggests:
- Only 22% of stocks are above the 50-day SMA
- Around 20% are above both the 100-day and 200-day SMA
Such numbers reflect significant distribution and risk aversion in smaller companies, where liquidity tends to dry up faster during market corrections.
Historical Patterns: Weak Breadth Often Leads to Market Rebounds
Historically, extremely weak market breadth has often coincided with oversold market conditions.
When less than 15% of stocks in the Nifty 500 trade above the 50-day moving average, markets have typically been close to short-term bottoms, often followed by technical rebounds.
Similar conditions were observed during market corrections in 2018, 2020, and 2022, where extremely weak breadth readings preceded sharp relief rallies once selling pressure subsided.
However, it is important to note that weak breadth alone does not confirm a market bottom, and further downside cannot be ruled out before stabilization occurs.
Market Outlook: Volatility Likely to Persist
Given the current structure, the market could remain volatile in the near term, especially if macro uncertainties persist. Investors and traders appear to be prioritizing capital preservation, which often happens during uncertain market phases.
A meaningful improvement in market breadth will be crucial for confirming any sustainable recovery.
Key Breadth Indicator to Watch
A recovery where more than 40% of stocks trade above the 200-day moving average (200-DMA) would likely signal the first credible indication of a durable market bottom.
Until such improvement occurs, the market may continue to experience volatility, selective stock performance, and cautious investor sentiment.
Conclusion
The current market breadth data shows that only one out of every four stocks is maintaining strength, reflecting widespread weakness beneath the surface of the indices. While historical trends suggest that such conditions may eventually lead to technical rebounds, the broader trend remains fragile.
Investors should remain selective, focus on risk management, and watch for improvements in market breadth indicators before expecting a sustainable market recovery.


 Easy & quick
Leave A Comment?