In this article, we will discuss:
- The 4 Key Metrics in the Winning Formula
- Putting the Metrics Together, We Get the holy Grail Formula
- Get to Know the #AndekhaSach with the Samco Trade Score
- Beyond the Winning Formula: Understand Every Step of Your Trade Story

There are two types of traders in the stock market — those who are successful, and those who aren’t. Ever wondered what sets successful traders apart from the rest? The most obvious answer may be profits. However, it’s not easy to make profitable trades consistently. A recent report from the Securities and Exchange Board of India (SEBI) confirms this hypothesis; Of the 45+ lakh individuals who traded in the equity F&O segment in FY22, only 11% earned profits. In other words, nearly 9 out of 10 traders incurred losses in the equity F&O market.
So, it’s safe to say that if you’ve consistently been making profitable trades, you may consider yourself a good trader. However, to ensure you have more gains than losses, you need to perform extensive research and analysis before every trade.
For instance, if you practice intraday trading in the equity segment, you may perform technical analysis, look at candlestick patterns and assess indicators like moving averages, Bollinger Bands, momentum oscillators, Relative Strength Index (RSI) and more. Alternatively, if you’re a more seasoned trader who participates in the futures and options market, you may evaluate parameters like the open interest, implied volatility, strike prices, volume and options Greeks like delta, gamma, theta and the like.
Having assessed all the necessary parameters, let’s say you plan your trades and eventually execute them successfully. The profits you make could encourage you to think that you’re successful in the market. But that’s only half the story. The other half lies in post-trade analysis — where you evaluate whether you’ve maximized your profitability.
After all, being a good trader is only the first step of the journey. The goal is to constantly improve and become a better trader every day. To do this, you need tools beyond just pre-trade research and technical analysis. You need a winning, holy grail formula — and it includes four key parameters.
The 4 Key Metrics in the Winning Formula
The winning formula we’re talking about is your trade score. Essentially, it estimates your online trading success and helps predict how successful your strategy is. It considers the following metrics.
Percentage of Winning Trades
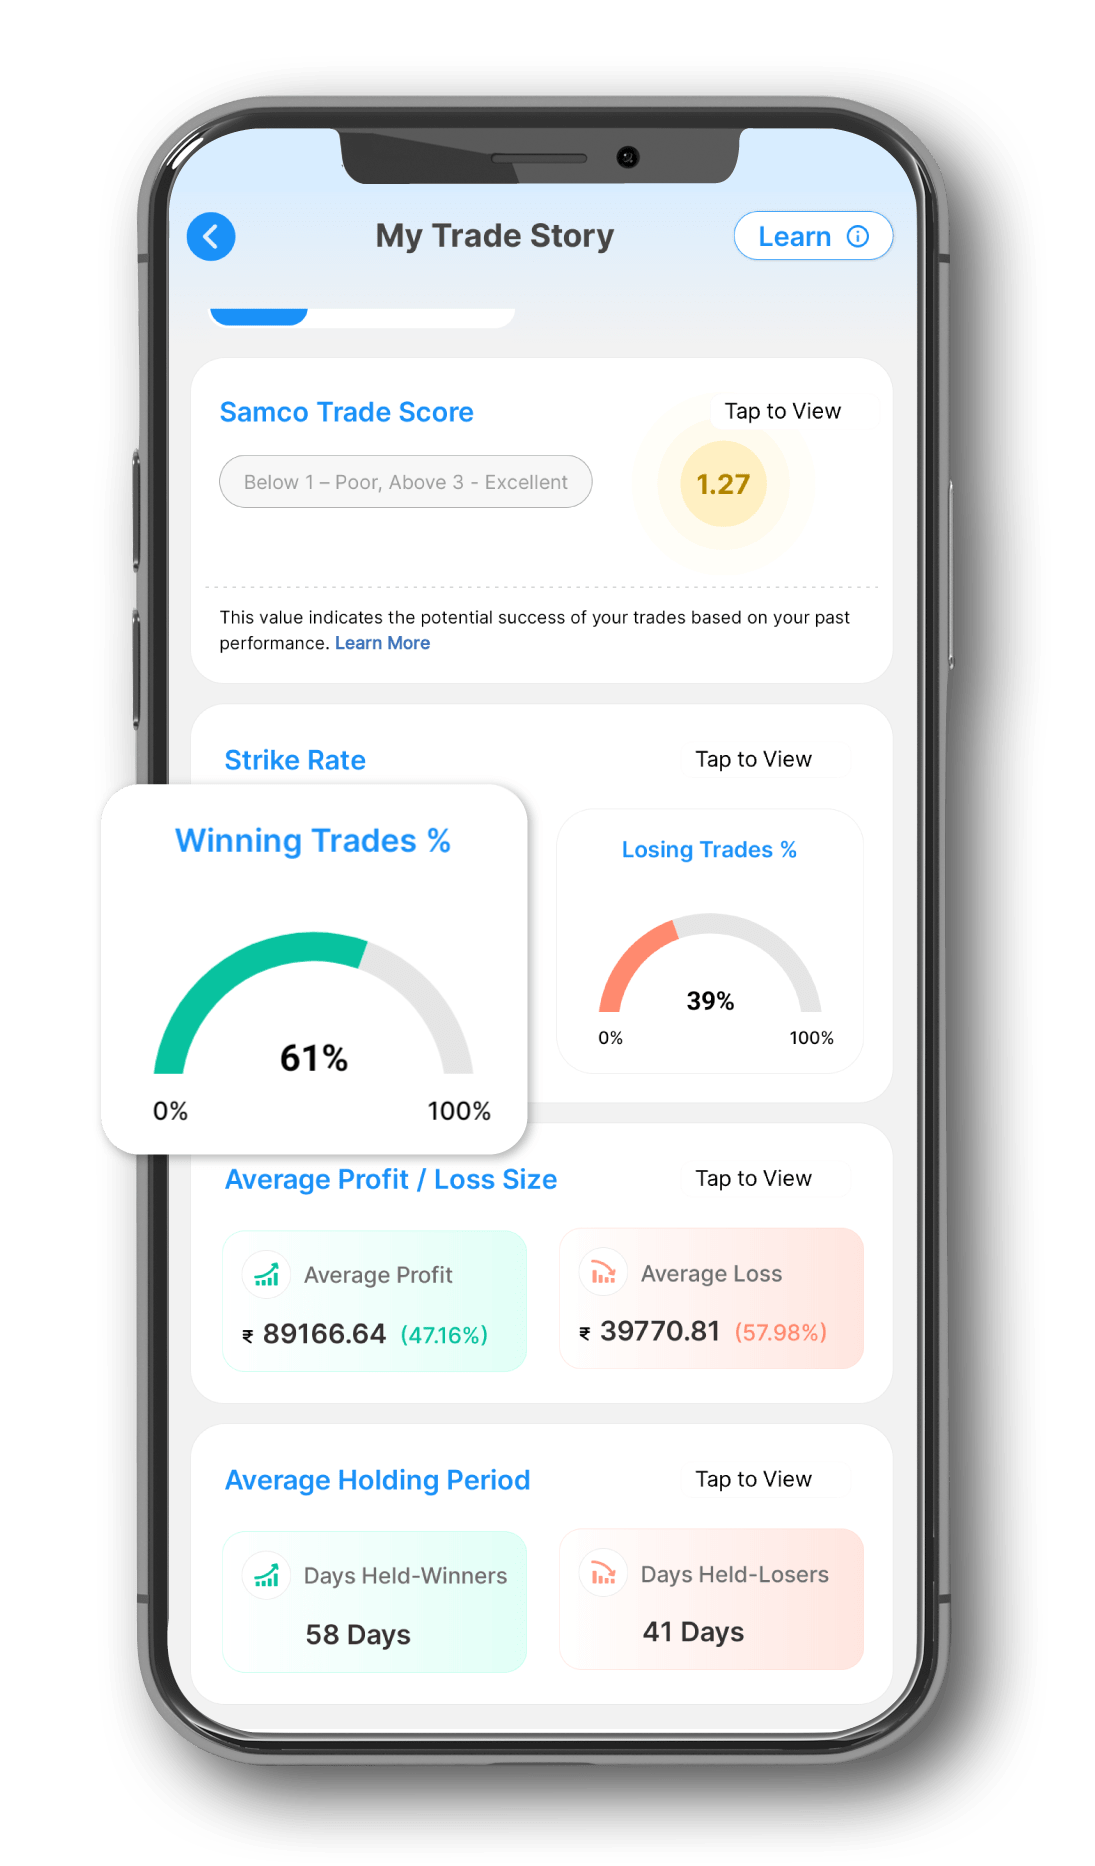
Also known as your strike rate, this is simply the percentage of profitable trades you make in any given period. For instance, say you’re into intraday trading and you execute 200 trades in a month, of which 135 are profitable. Your strike rate (or the percentage of your winning trades) in this case will be 67.50% (i.e. 135/200 x 100).
Percentage of Losing Trades
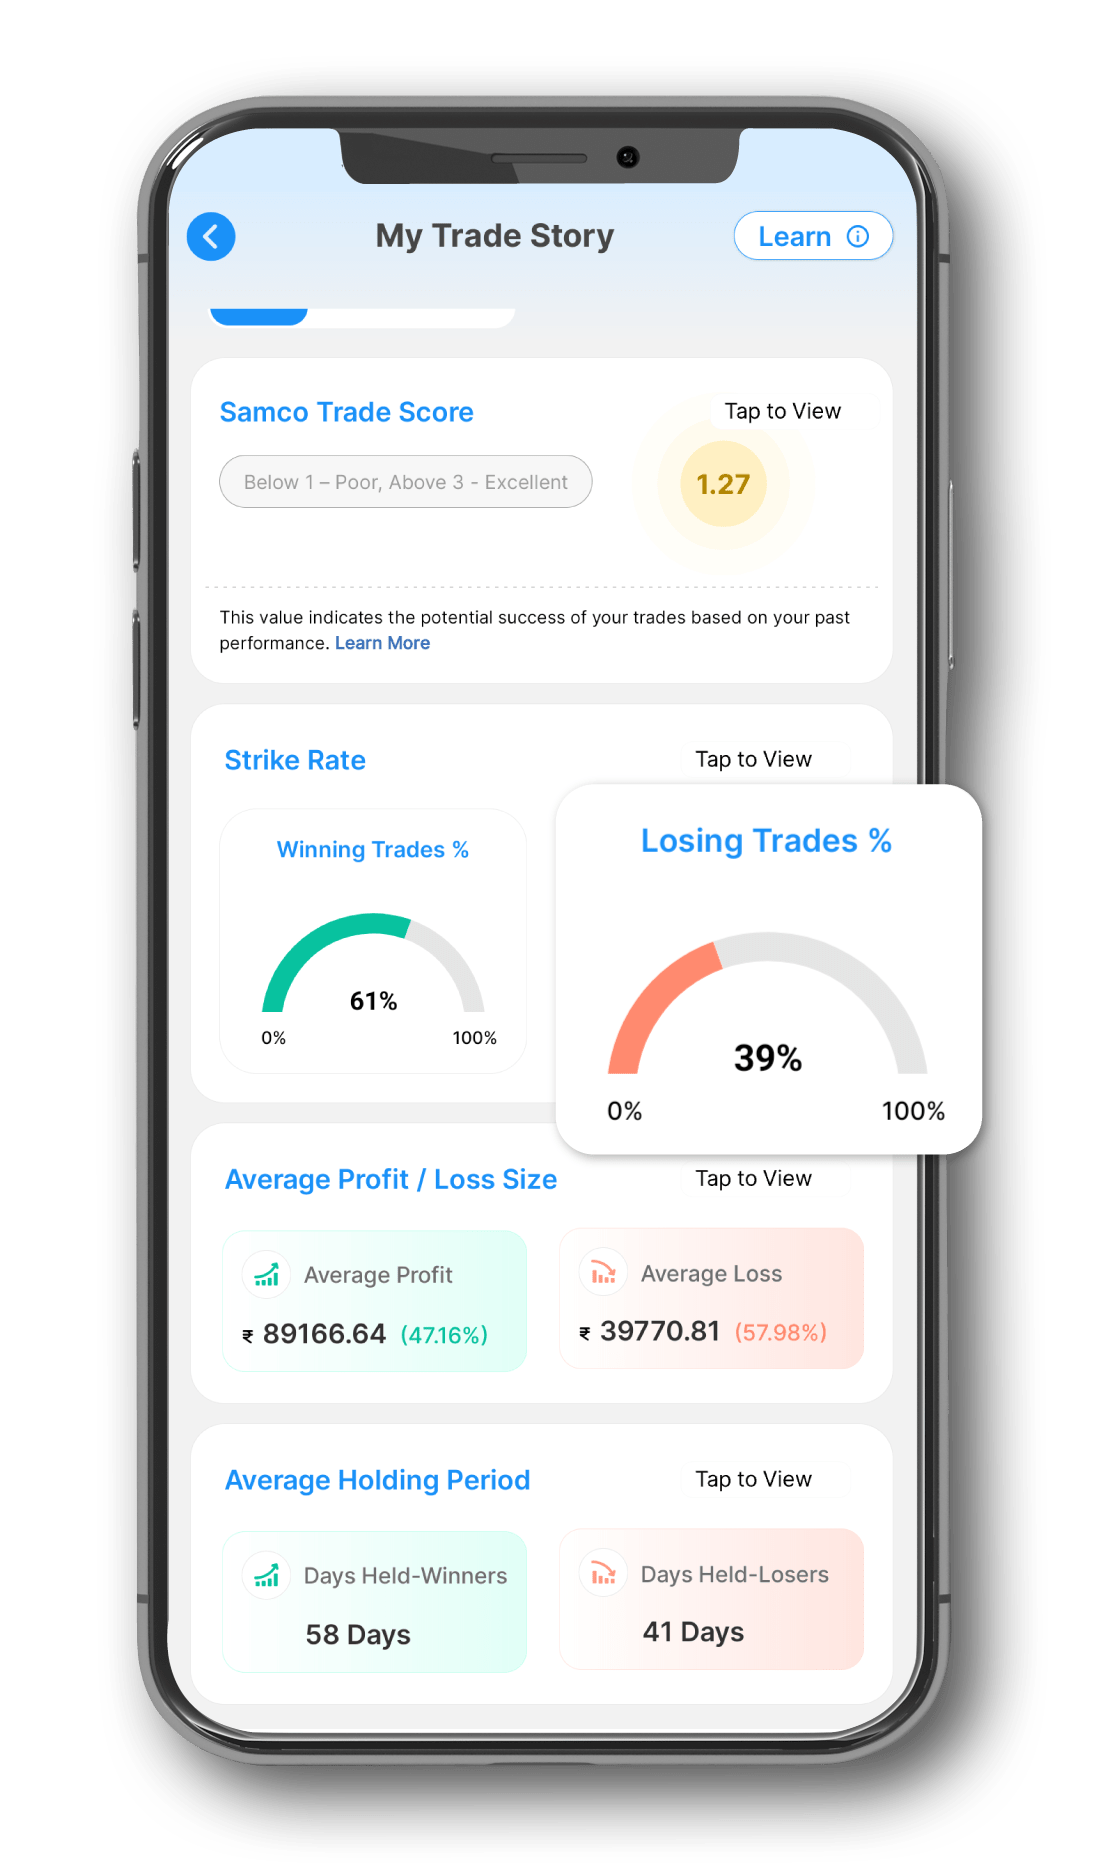
This is like the first metric, except that it measures the percentage of loss-making trades in a given period. Let’s extend the above example for more clarity on how you can compute the percentage of losing trades. Of the 200 you make trades a month, 65 result in losses. So, the percentage of loss-making trades during the month is 32.50% (i.e. 65/200 x 100).
Average Gain Percentage
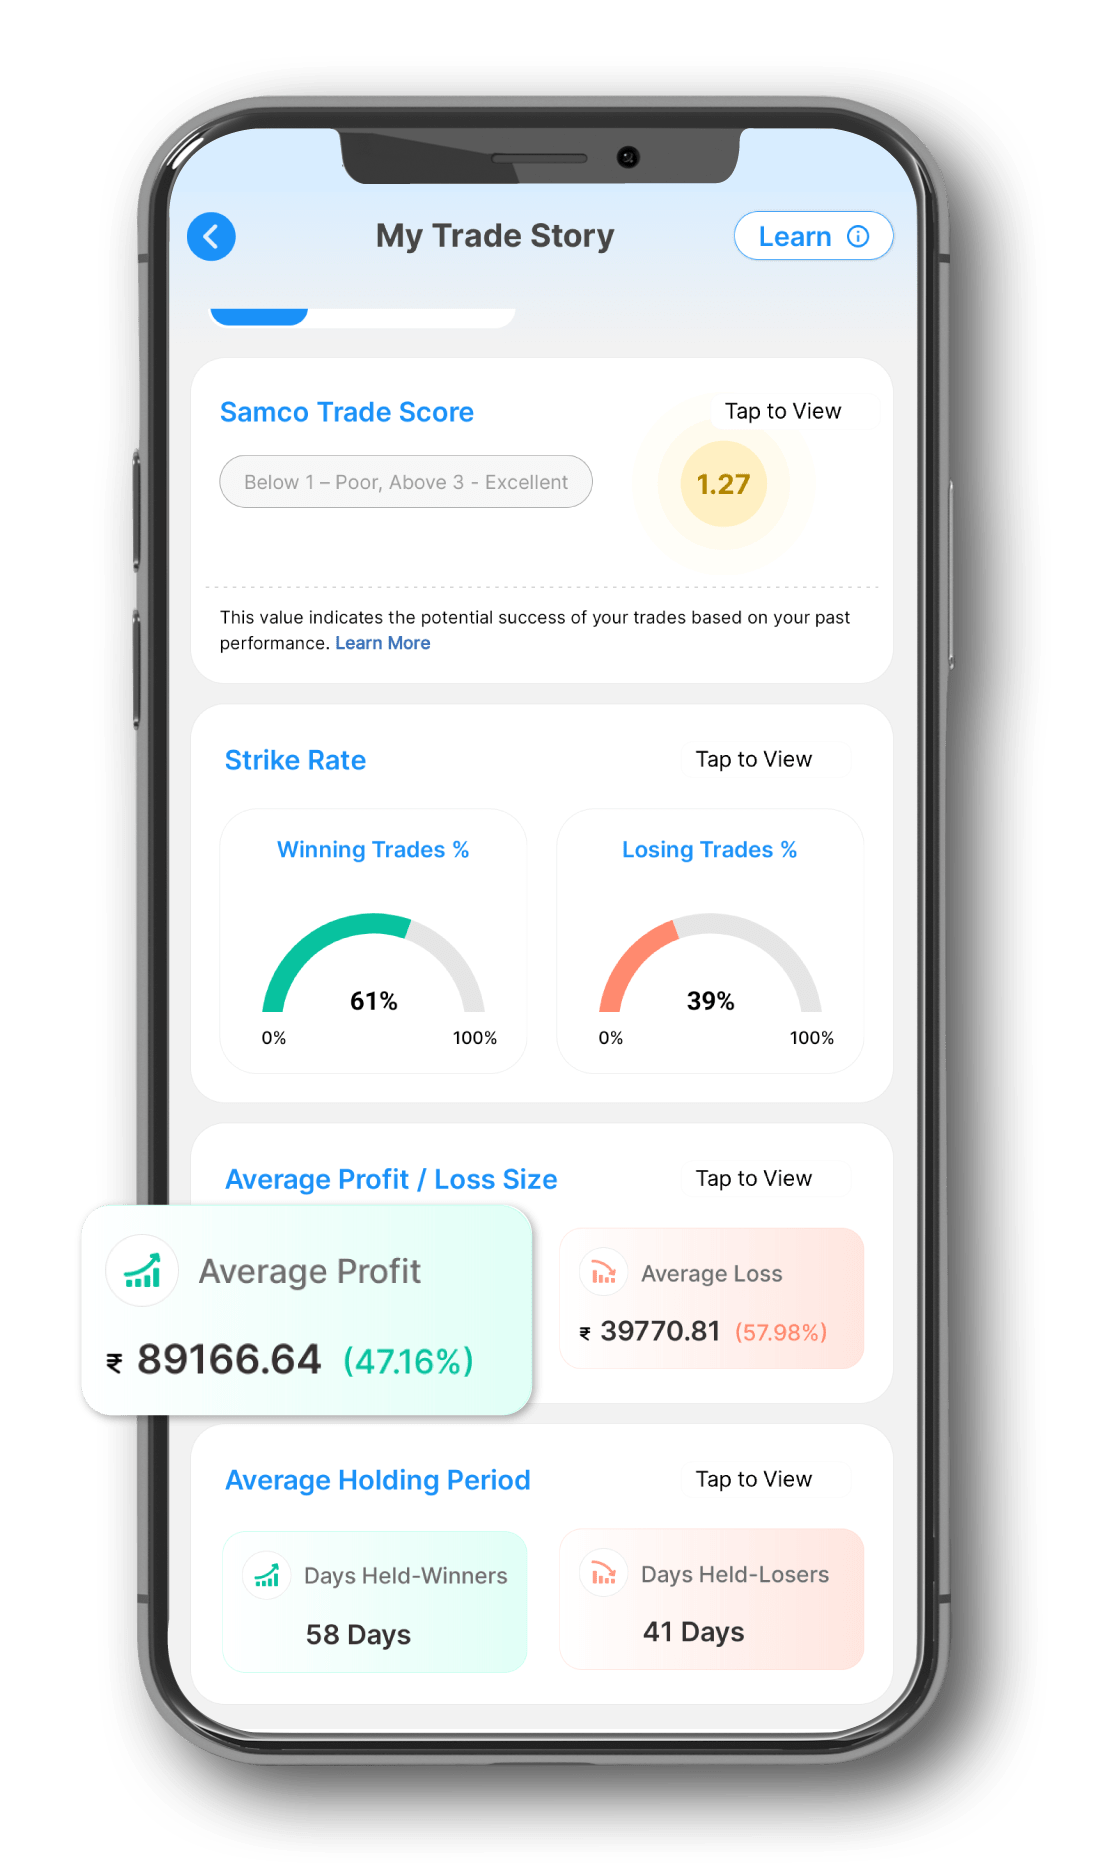
While the strike rate lets you know how frequently you win or lose in the market, the gain size allows you to quantify your wins. It’s calculated as the average profit percentage from your total profitable strategies in a given period.
It’s important to be aware of this metric because it puts things in perspective. For instance, you may have a high winning strike rate in options trading, but if your average gain percentage is low, it means you’re not winning as much as you could be — even if you are winning often.
Average Loss Percentage
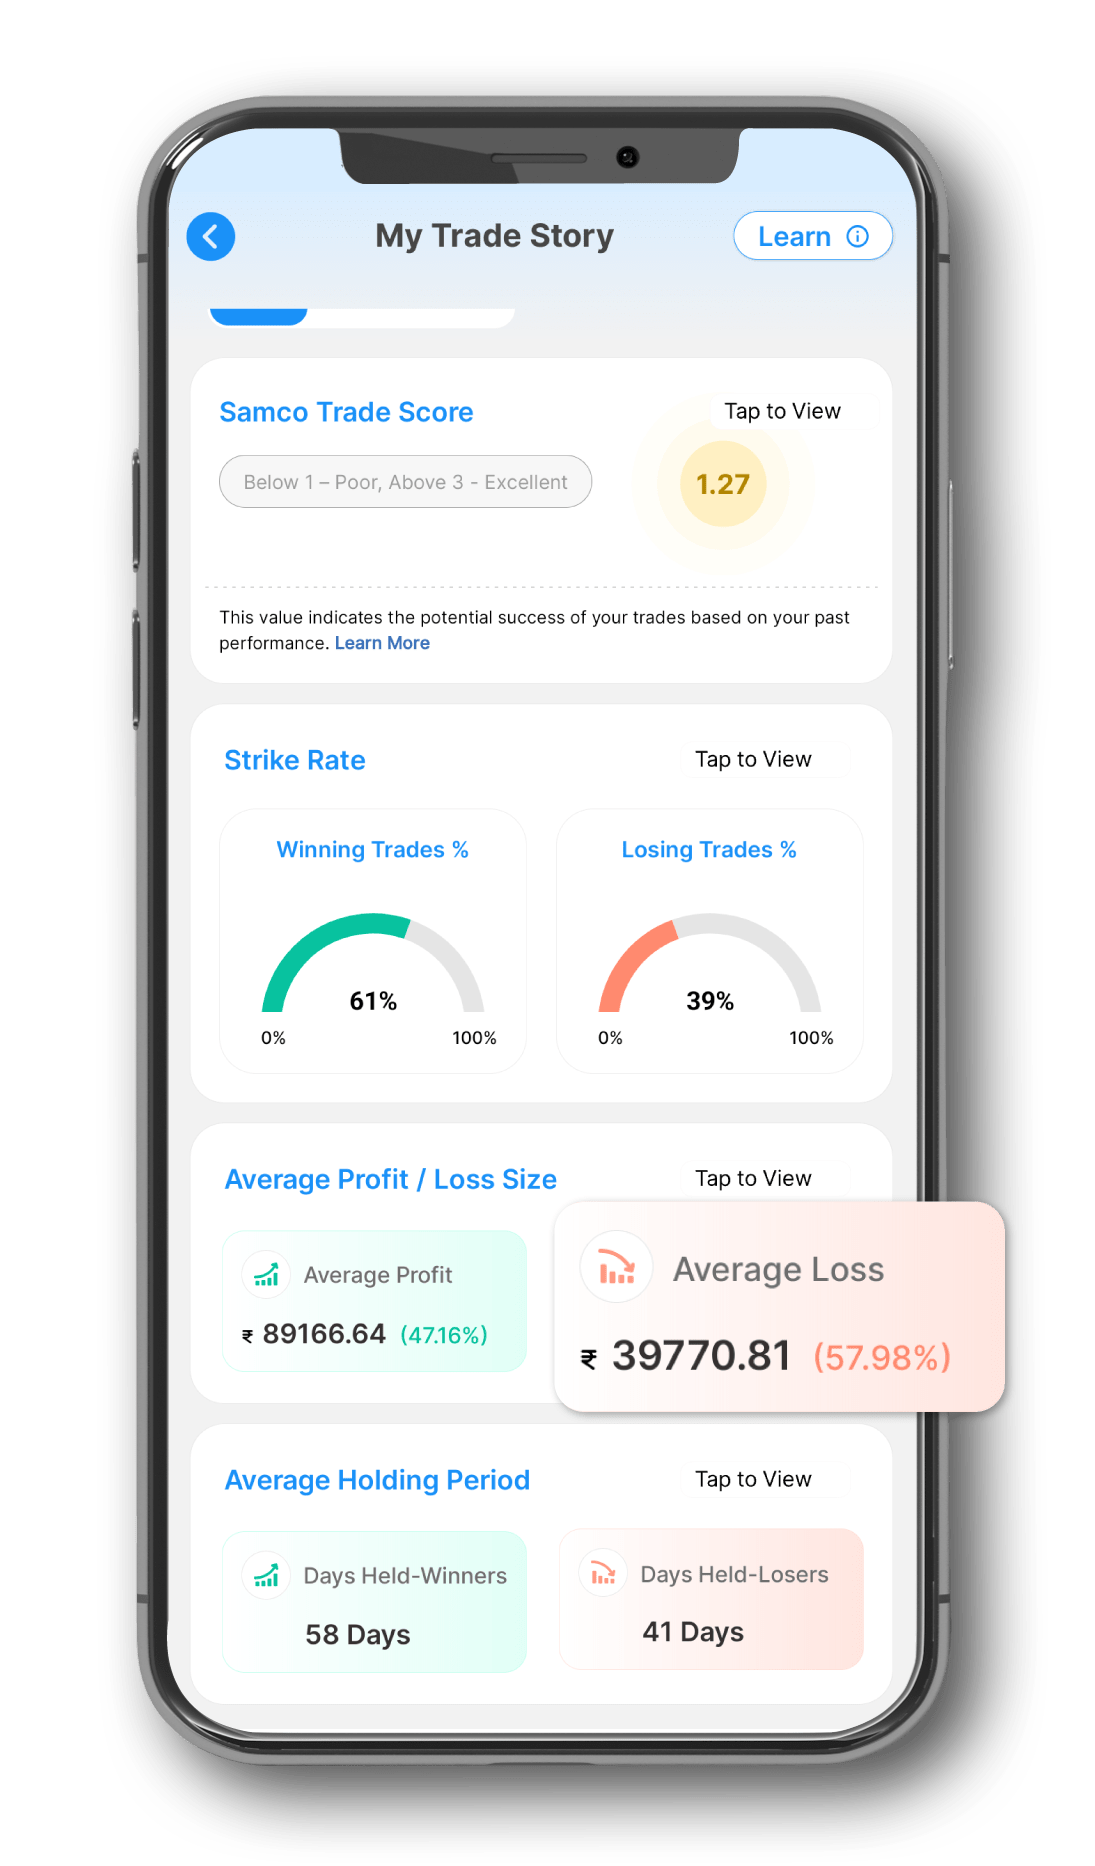
The average loss percentage is the other side of the coin. It gives you a clear view of the big picture and tells you how large (or small) your losses are. By definition, the average loss percentage is the average loss percentage from your total loss-making trades in a given period.
It’s essential to assess this during your post-trade analysis because it tells you whether your losses are substantial or manageable. For instance, you may have fewer losing trades, but if your average loss percentage is significant, it indicates a potential issue with your trading patterns and strategies.
Putting the Metrics Together, We Get the Holy Grail Formula
You now have these four parameters — the percentages of winning and losing trades and the average gain and loss percentages. While they may each be insightful in their own way, they do not individually help you assess the success of your strategy. To evaluate whether you are becoming a better trader with time, you need to put these four metrics together in the golden formula for trading shown below:
(Winning Trade % x Average Gain %) ÷ (Losing Trade % x Average Loss %) |
Let’s discuss a small example to understand how this formula can be practically applied to evaluate your trading strategies and check if you are becoming a better trader. Say your intraday trading activity over two consecutive months is as follows.
Month | Total Number of Trades During the Month | Total Profitable Trades | Average Gain % of the Total Profitable Trades | Total Loss-Making Trades | Average Loss % of the Total Loss-Making Trades |
1 | 150 | 60 (40%) | 2% | 90 (60%) | 3% |
2 | 200 | 60 (30%) | 5% | 140 (70%) | 2% |
Using the winning formula outlined above, here’s how we can calculate your score for each month.
Score for Month 1:
= (Winning Trade % x Average Gain %) ÷ (Losing Trade % x Average Loss %)
= (40 x 2) ÷ (60 x 3)
= 80 ÷ 180
= 0.44
Score for Month 2:
= (Winning Trade % x Average Gain %) ÷ (Losing Trade % x Average Loss %)
= (30 x 5) ÷ (70 x 2)
= 150 ÷ 140
= 1.07
Since your score has clearly improved, it indicates that your intraday trading in stocks during the second month was more successful than your trades in the previous month. By analyzing your trading score consistently month after month, you can get a better idea of whether or not you are improving as a trader.
That said, it can be extremely challenging to perform these calculations manually. You’ll no doubt encounter several roadblocks along the way — like obtaining the precise data for your trades over the course of a month, finding the time to perform these calculations and eliminating any manual computational errors. That’s not all. It can also be difficult for you to assess what the score means.
Here’s where Samco’s new-gen trading app can help.
Get to Know the #AndekhaSach with the Samco Trade Score
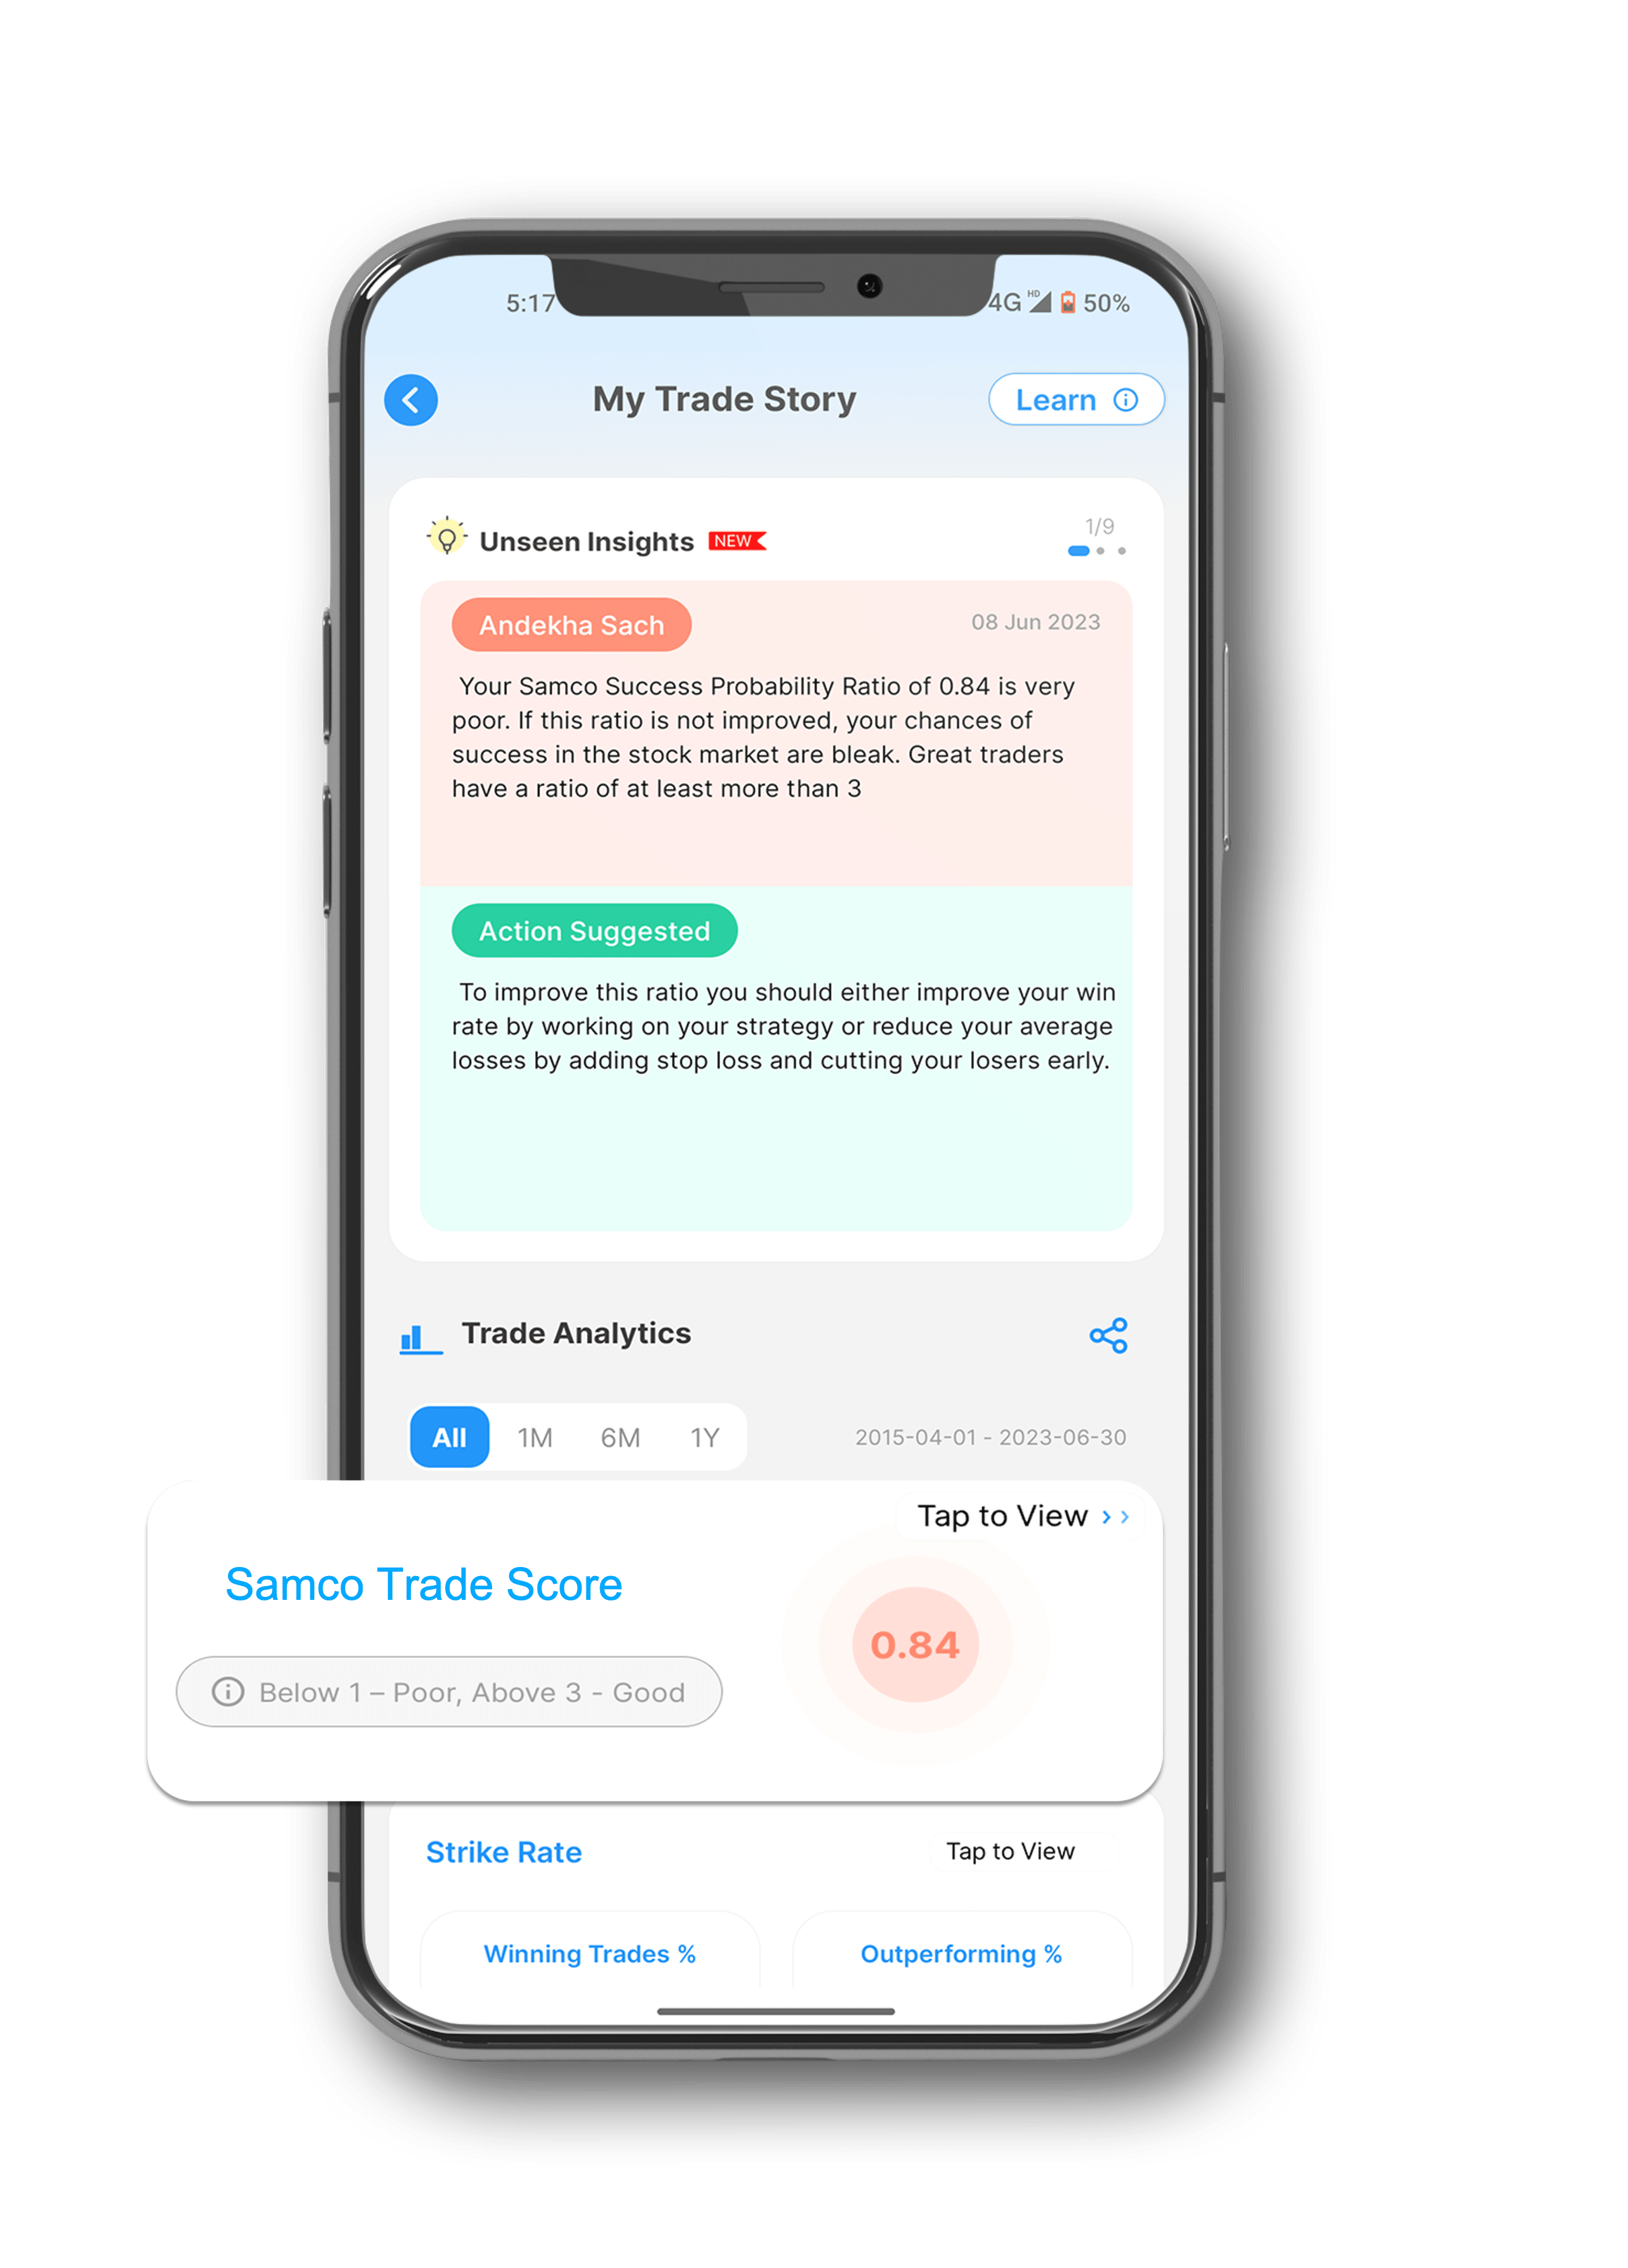
With the new-gen trading app from Samco Securities, you can sit back and relax. The app introduces a revolutionary feature — aptly named ‘ My Trade Story’ — which delves into the details of your trading strategy and gives you never-before-seen insights into your market activity.
One such insight or Andekha Sach is the Samco trade score, which is computed using the golden formula outlined above. The app automatically extracts your strike rate and average win/loss size to calculate your trade score and predict how successful your strategy is. The best part is that the app also evaluates your trading patterns and performance across different market capitalisations, sectors and strategies — with separate trade scores for each category.
Here’s how you can interpret your Samco trade score.
Samco Trade Score < 1 (Poor Performance):
This means your chances of consistently earning profits from the stock market are quite low. So, you need to improve your strategy, cut your losses early and let your winning trades run instead.
Samco Trade Score of 1 to 3 (Average to Good Performance):
A score in this range indicates that you are a decent trader, but there’s certainly room for improvement. You need to focus on amplifying your wins and cutting your losses short, so your strategy becomes more successful.
Samco Trade Score > 3 (Very Good Performance):
If your score is above 3, it means you’ve discovered your winning strategy and you need to continue what you’re doing. Remember to keep tracking your score though, so you are aware if your strategy needs to be tweaked.
Beyond the Winning Formula: Understand Every Step of Your Trade Story
Samco’s trading app shows you much more than your trade score. The app analyzes data pertaining to all your past trades and shows you hidden insights or the Andekha Sach — related to your trading performance. What’s more, you also receive several actionable suggestions to help you improve your trades.
Download the new-gen trading app from Samco Securities today and open a trading and demat account to experience trading success right at your fingertips.
Disclaimer: INVESTMENT IN SECURITIES MARKET ARE SUBJECT TO MARKET RISKS, READ ALL THE RELATED DOCUMENTS CAREFULLY BEFORE INVESTING. The asset classes and securities quoted in the film are exemplary and are not recommendatory. SAMCO Securities Limited (Formerly known as Samruddhi Stock Brokers Limited): BSE: 935 | NSE: 12135 | MSEI- 31600 | SEBI Reg. No.: INZ000002535 | AMFI Reg. No. 120121 | Depository Participant: CDSL: IN-DP-CDSL-443-2008 CIN No.: U67120MH2004PLC146183 | SAMCO Commodities Limited (Formerly known as Samruddhi Tradecom India Limited) | MCX- 55190 | SEBI Reg. No.: INZ000013932 Registered Address: Samco Securities Limited, 1004 - A, 10th Floor, Naman Midtown - A Wing, Senapati Bapat Marg, Prabhadevi, Mumbai - 400 013, Maharashtra, India. For any complaints Email - grievances@samco.in Research Analysts -SEBI Reg.No.-INHO0O0005847


 Easy & quick
Leave A Comment?