The week began on an optimistic note as the meeting between U.S. President Donald Trump and Russian President Vladimir Putin eased geopolitical and tariff concerns. Investor sentiment was further lifted by Prime Minister Narendra Modi’s Independence Day announcement on GST, which was viewed positively by the market. Supported by these developments, the Nifty 50 closed higher for the second consecutive week, breaking away from its earlier six-week losing streak.
On the sectoral front, the Nifty Auto index outperformed, rising 5.02%, driven by expectations that GST reforms could boost consumption and automobile sales. In contrast, the Nifty Defence index declined 1.11%, emerging as the week’s underperformer.
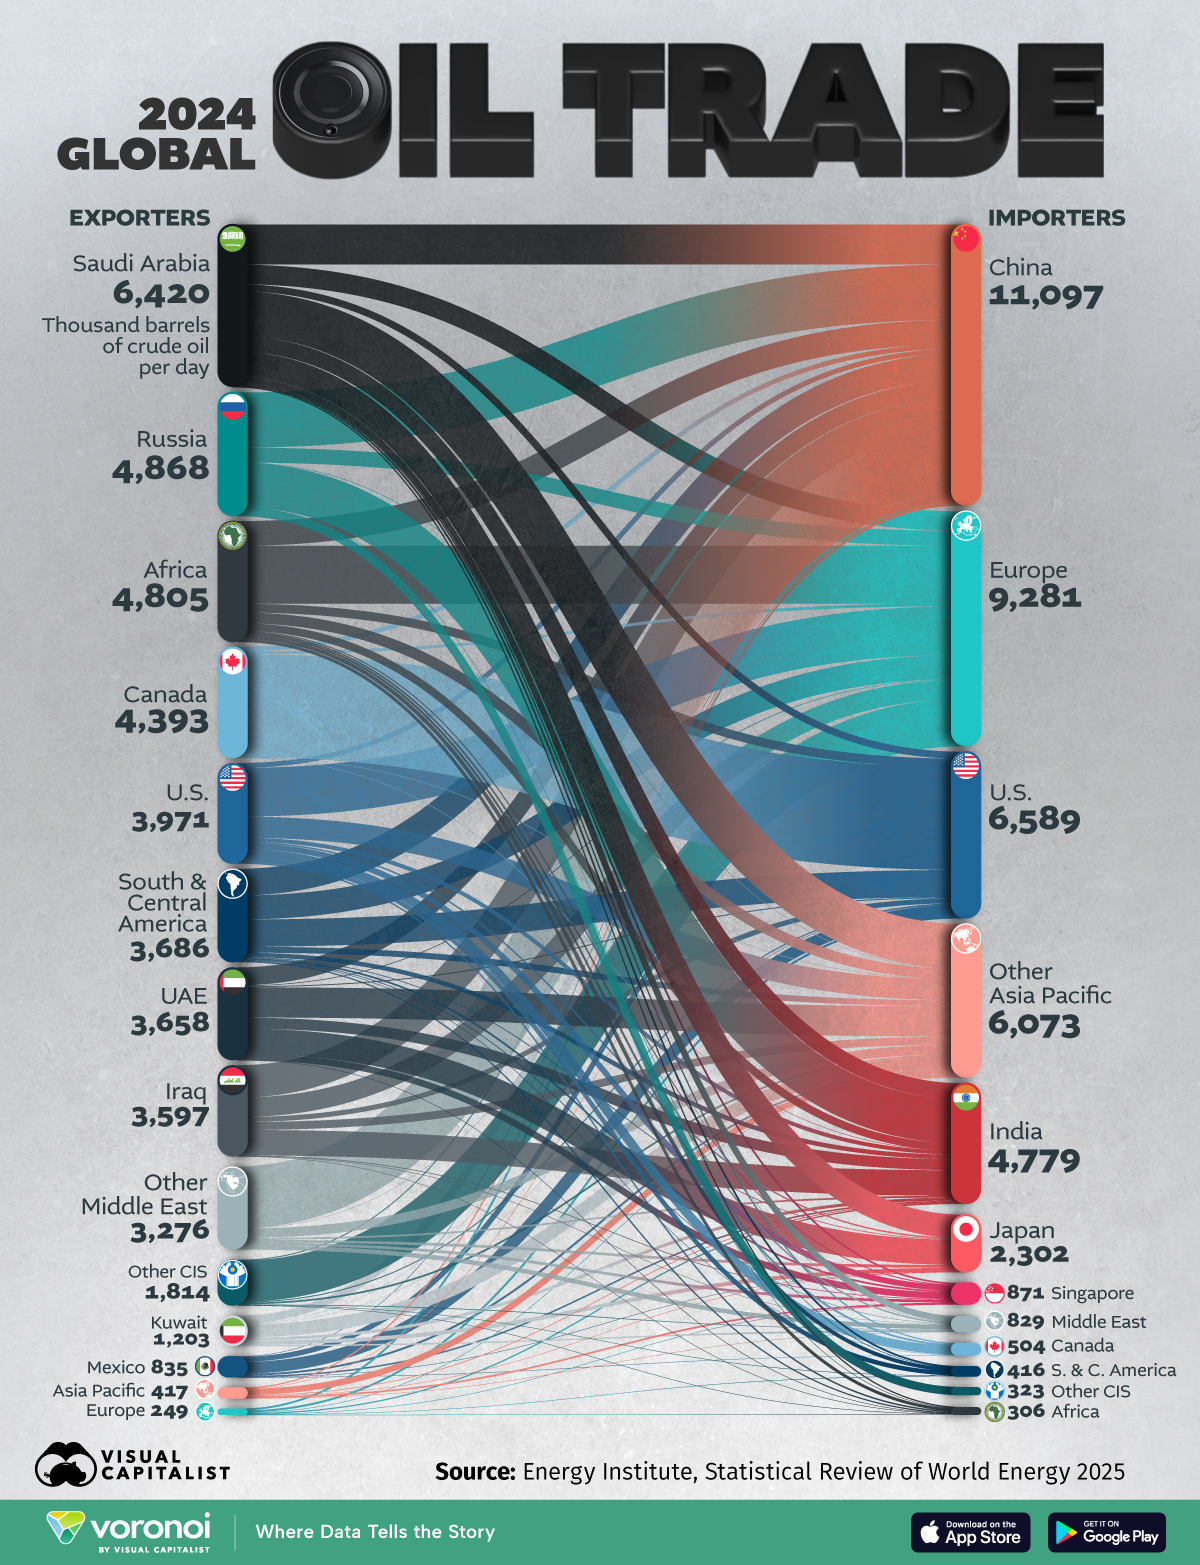
In commodities, gold and silver traded flat, reflecting muted momentum. Meanwhile, India’s July trade data showed imports growing at a faster pace than exports, highlighting external trade imbalances.
Scroll down to explore this week’s market moves, trends, and perspectives through easy-to-understand charts.
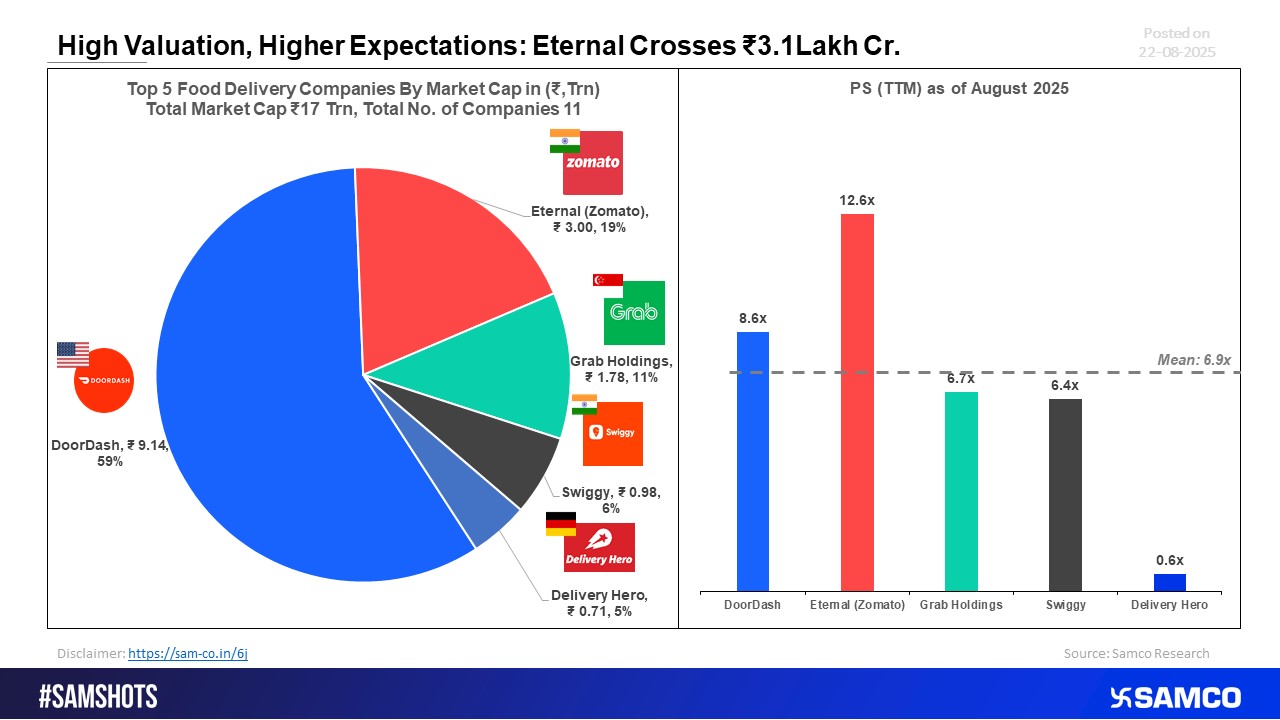
Eternal Crosses ?3.1 Lakh Crore Mark, With Lofty Valuation and Expectations


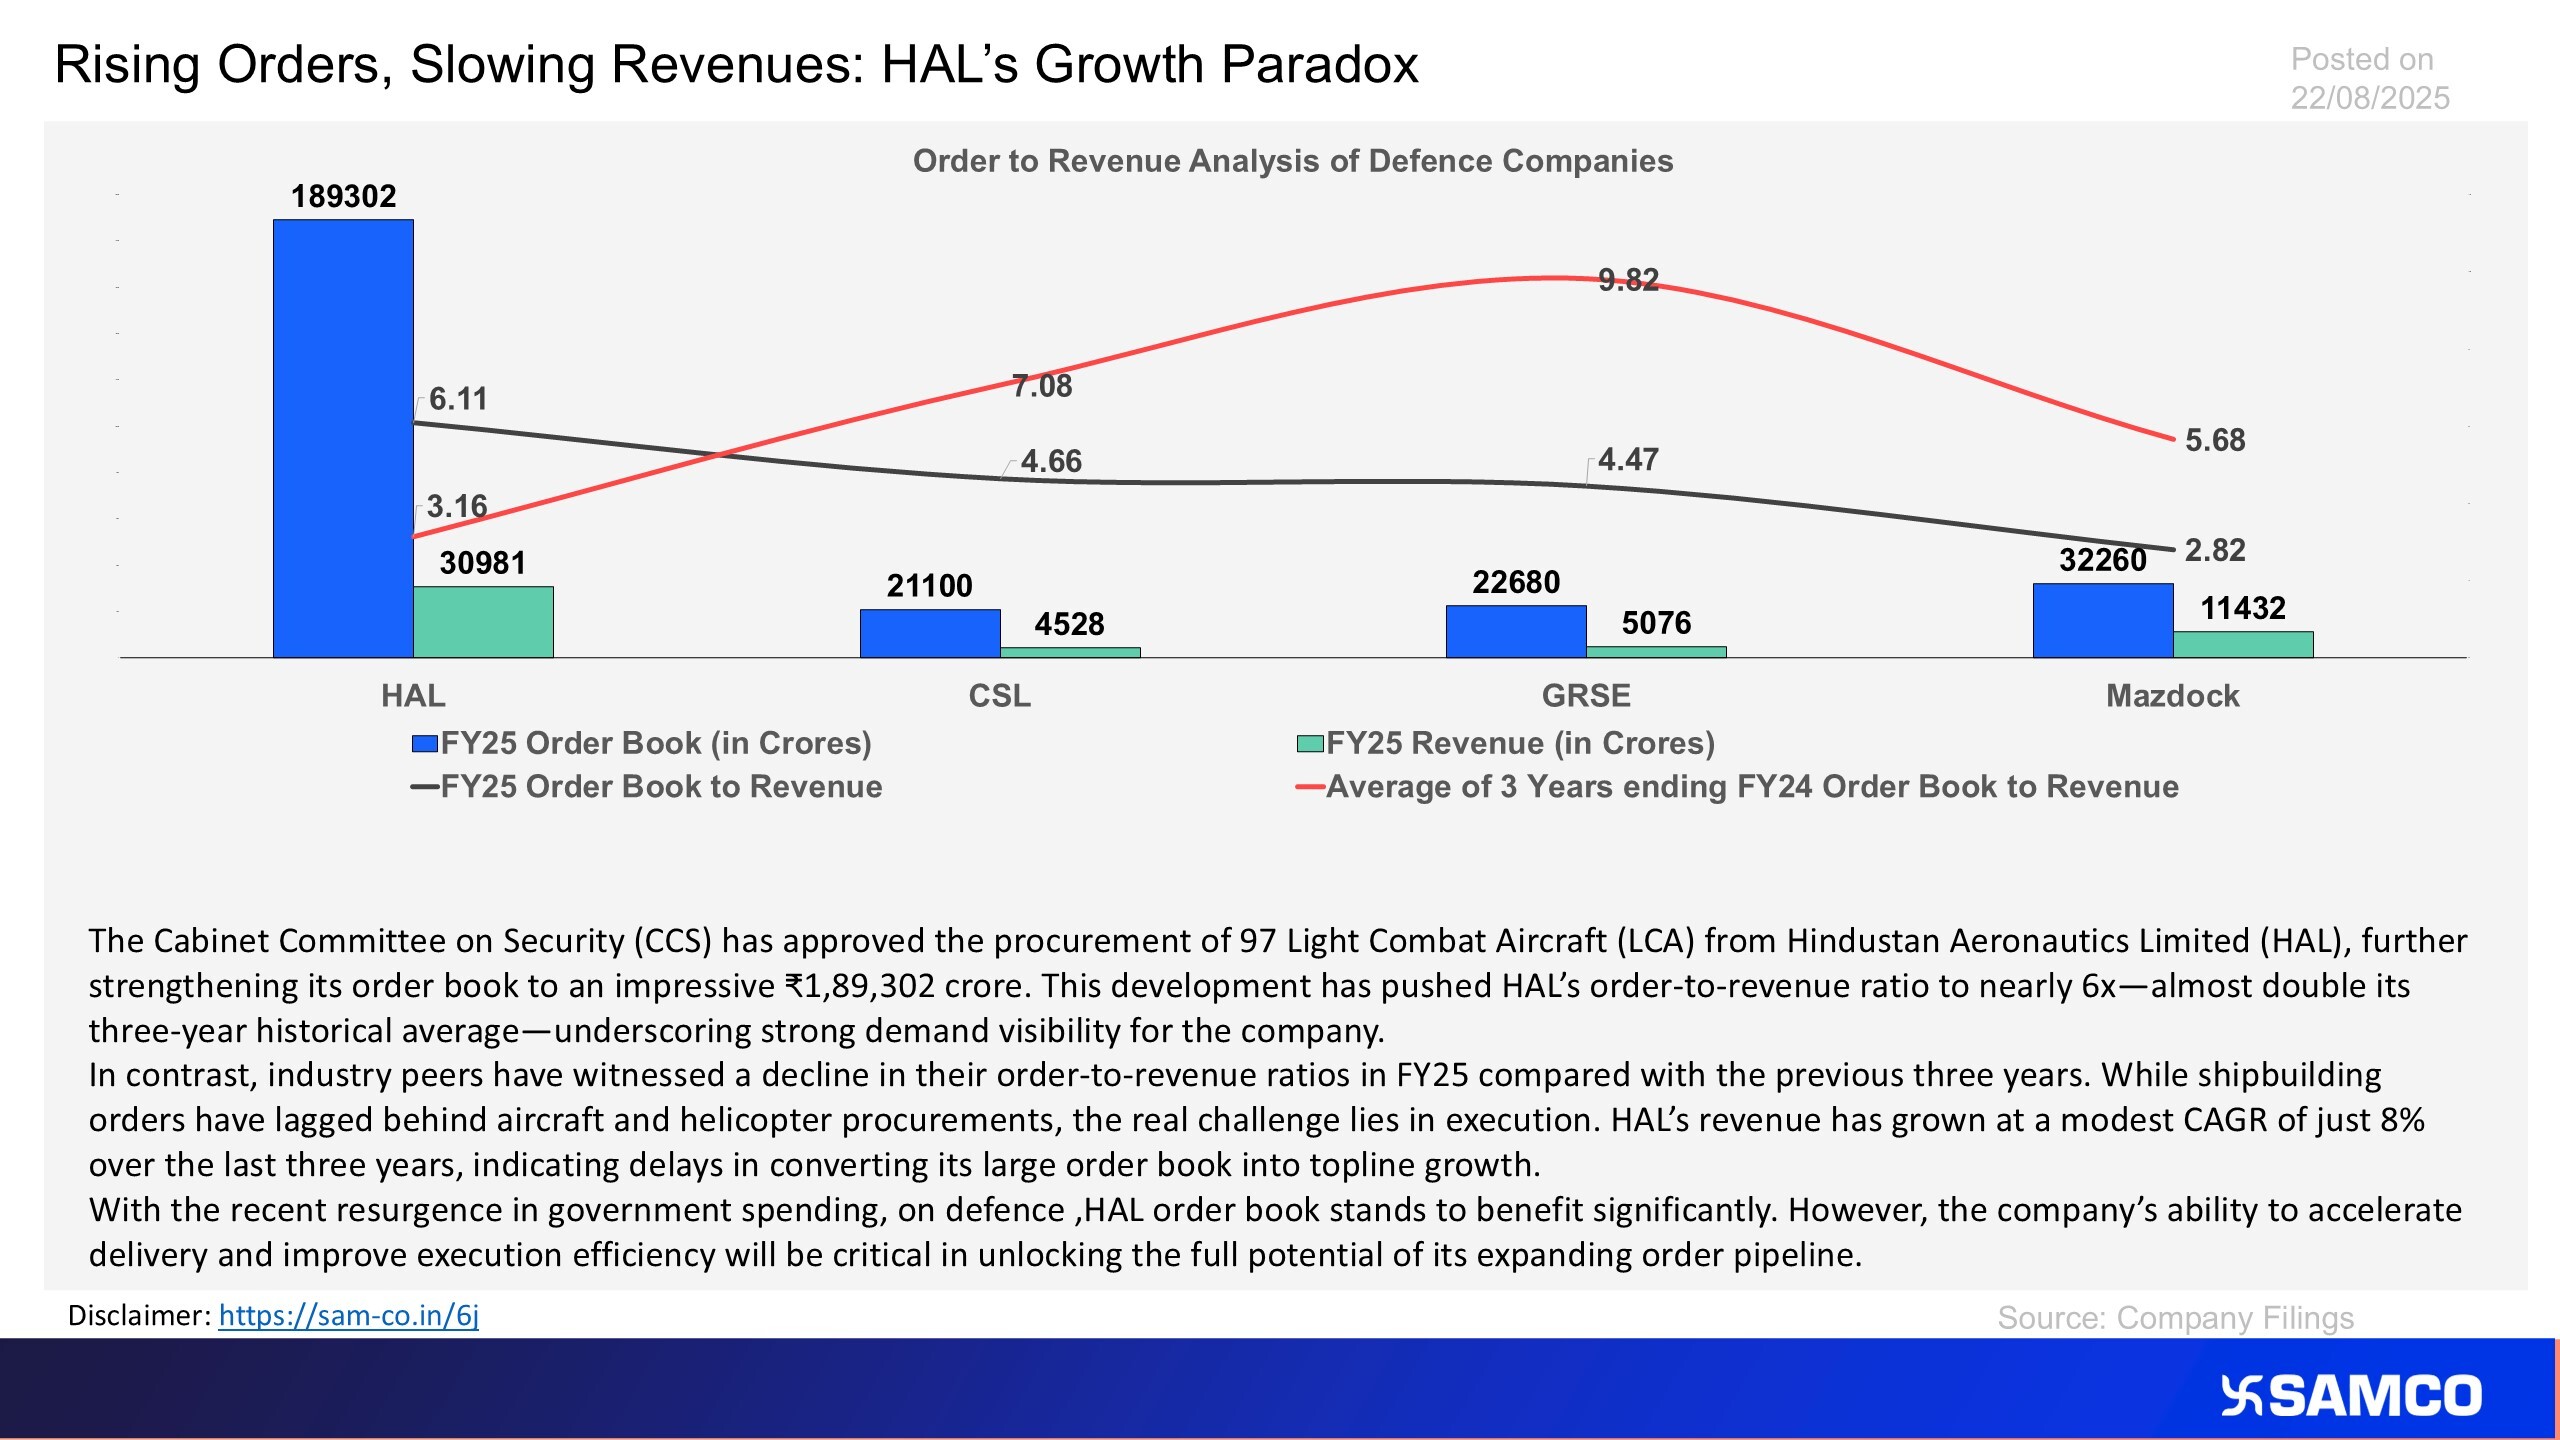
The chart analysis the order-to-revenue ratio of defence companies
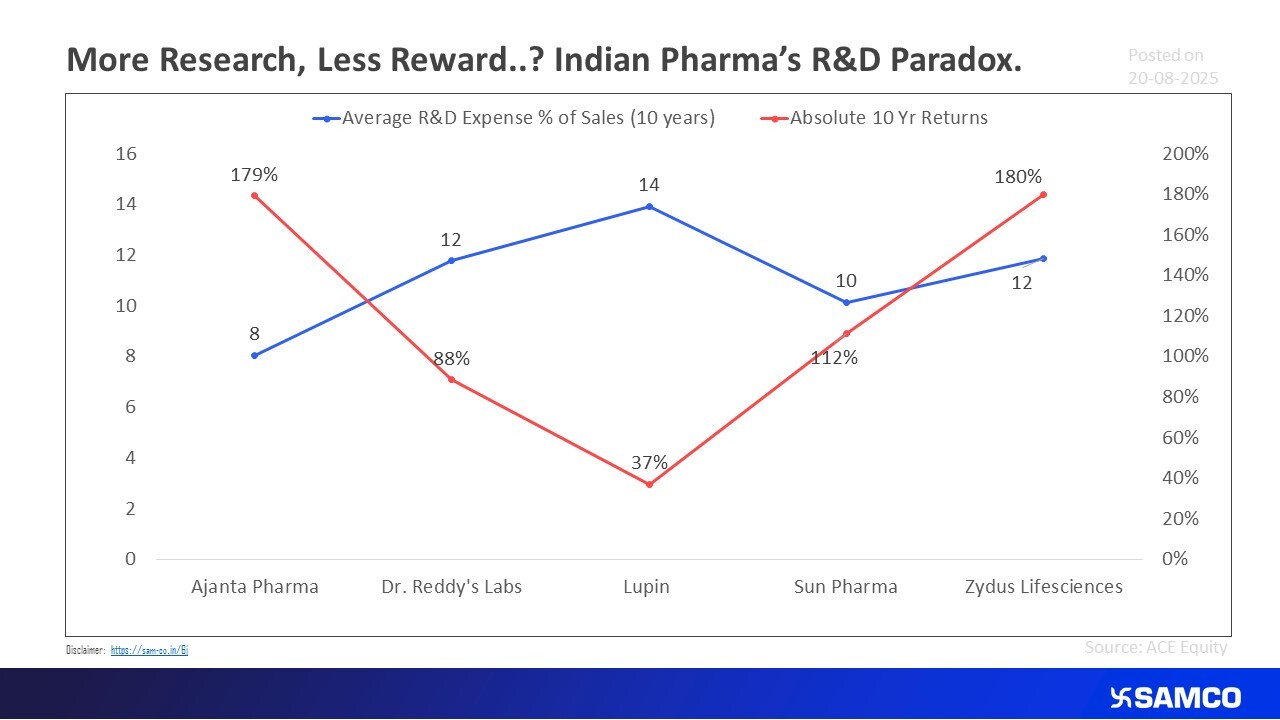
Indian Pharma Stocks R&D Paradox
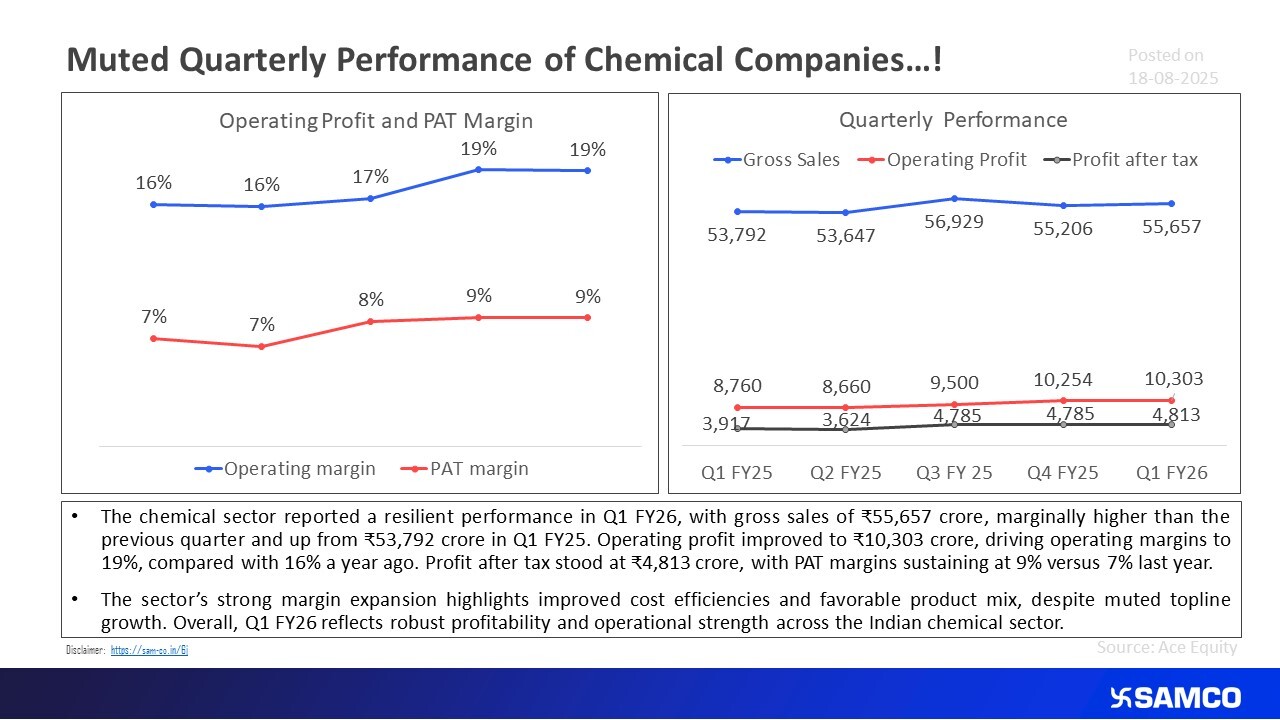
Quarterly performance of chemical stocks
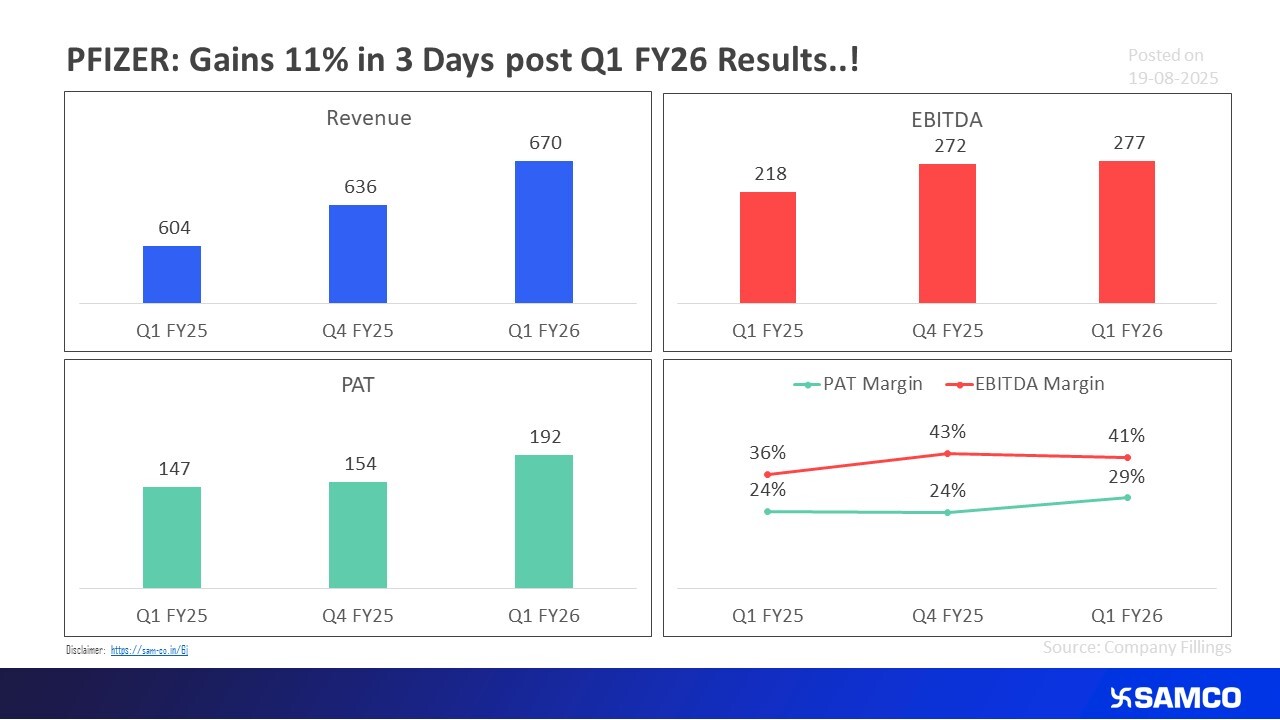
Pfizer Q1 FY26 results help the stock climb 11%
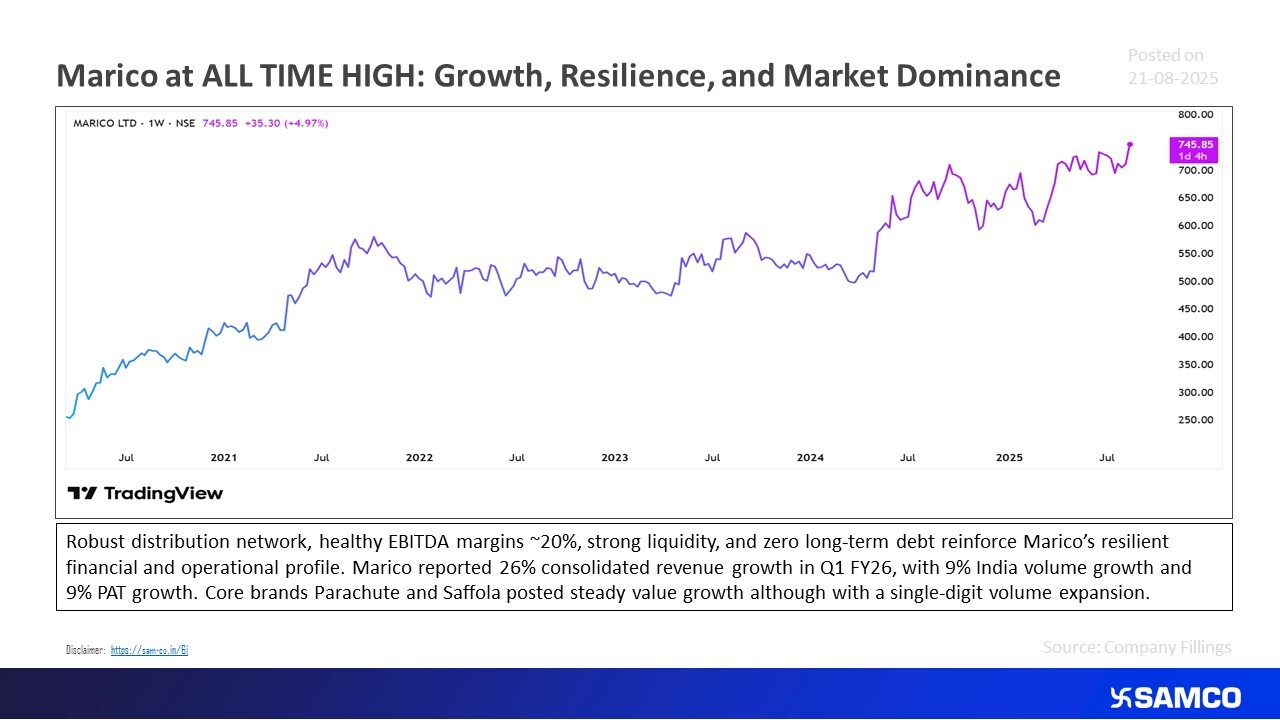
Marico hits an all-time high post Q1 FY26 result performance
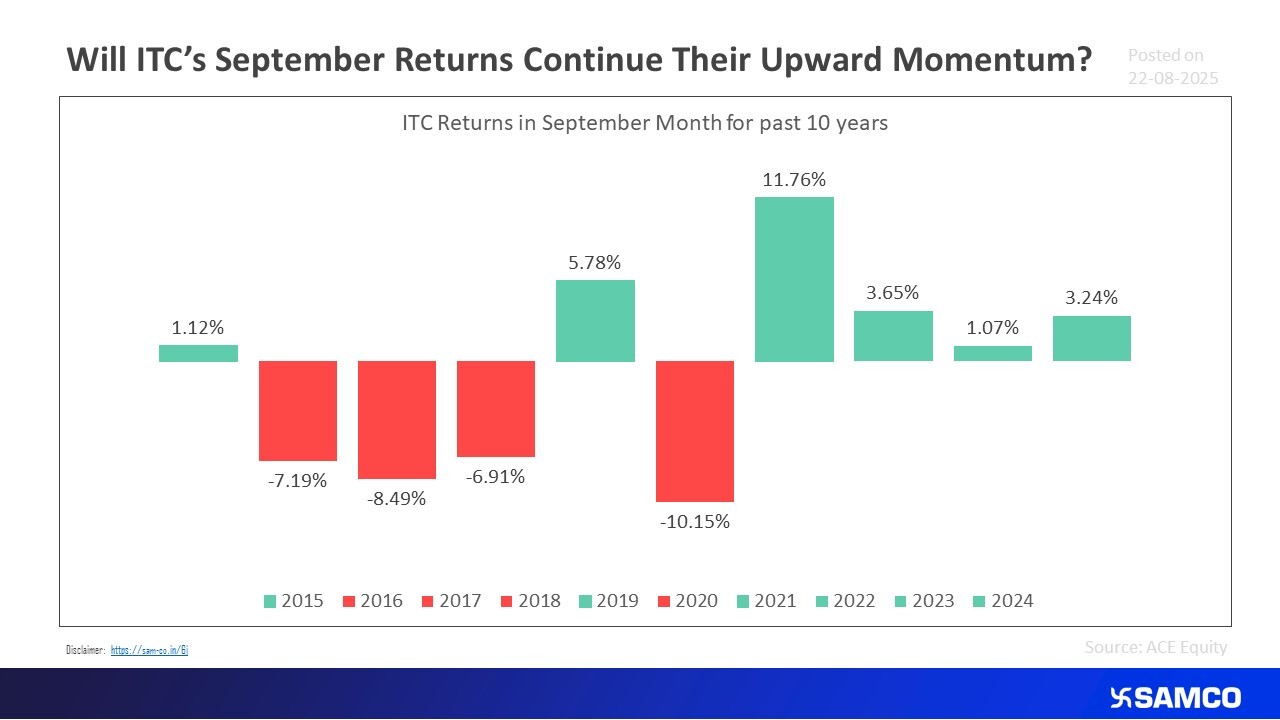
Here is how ITC has performed in September month of the last decade
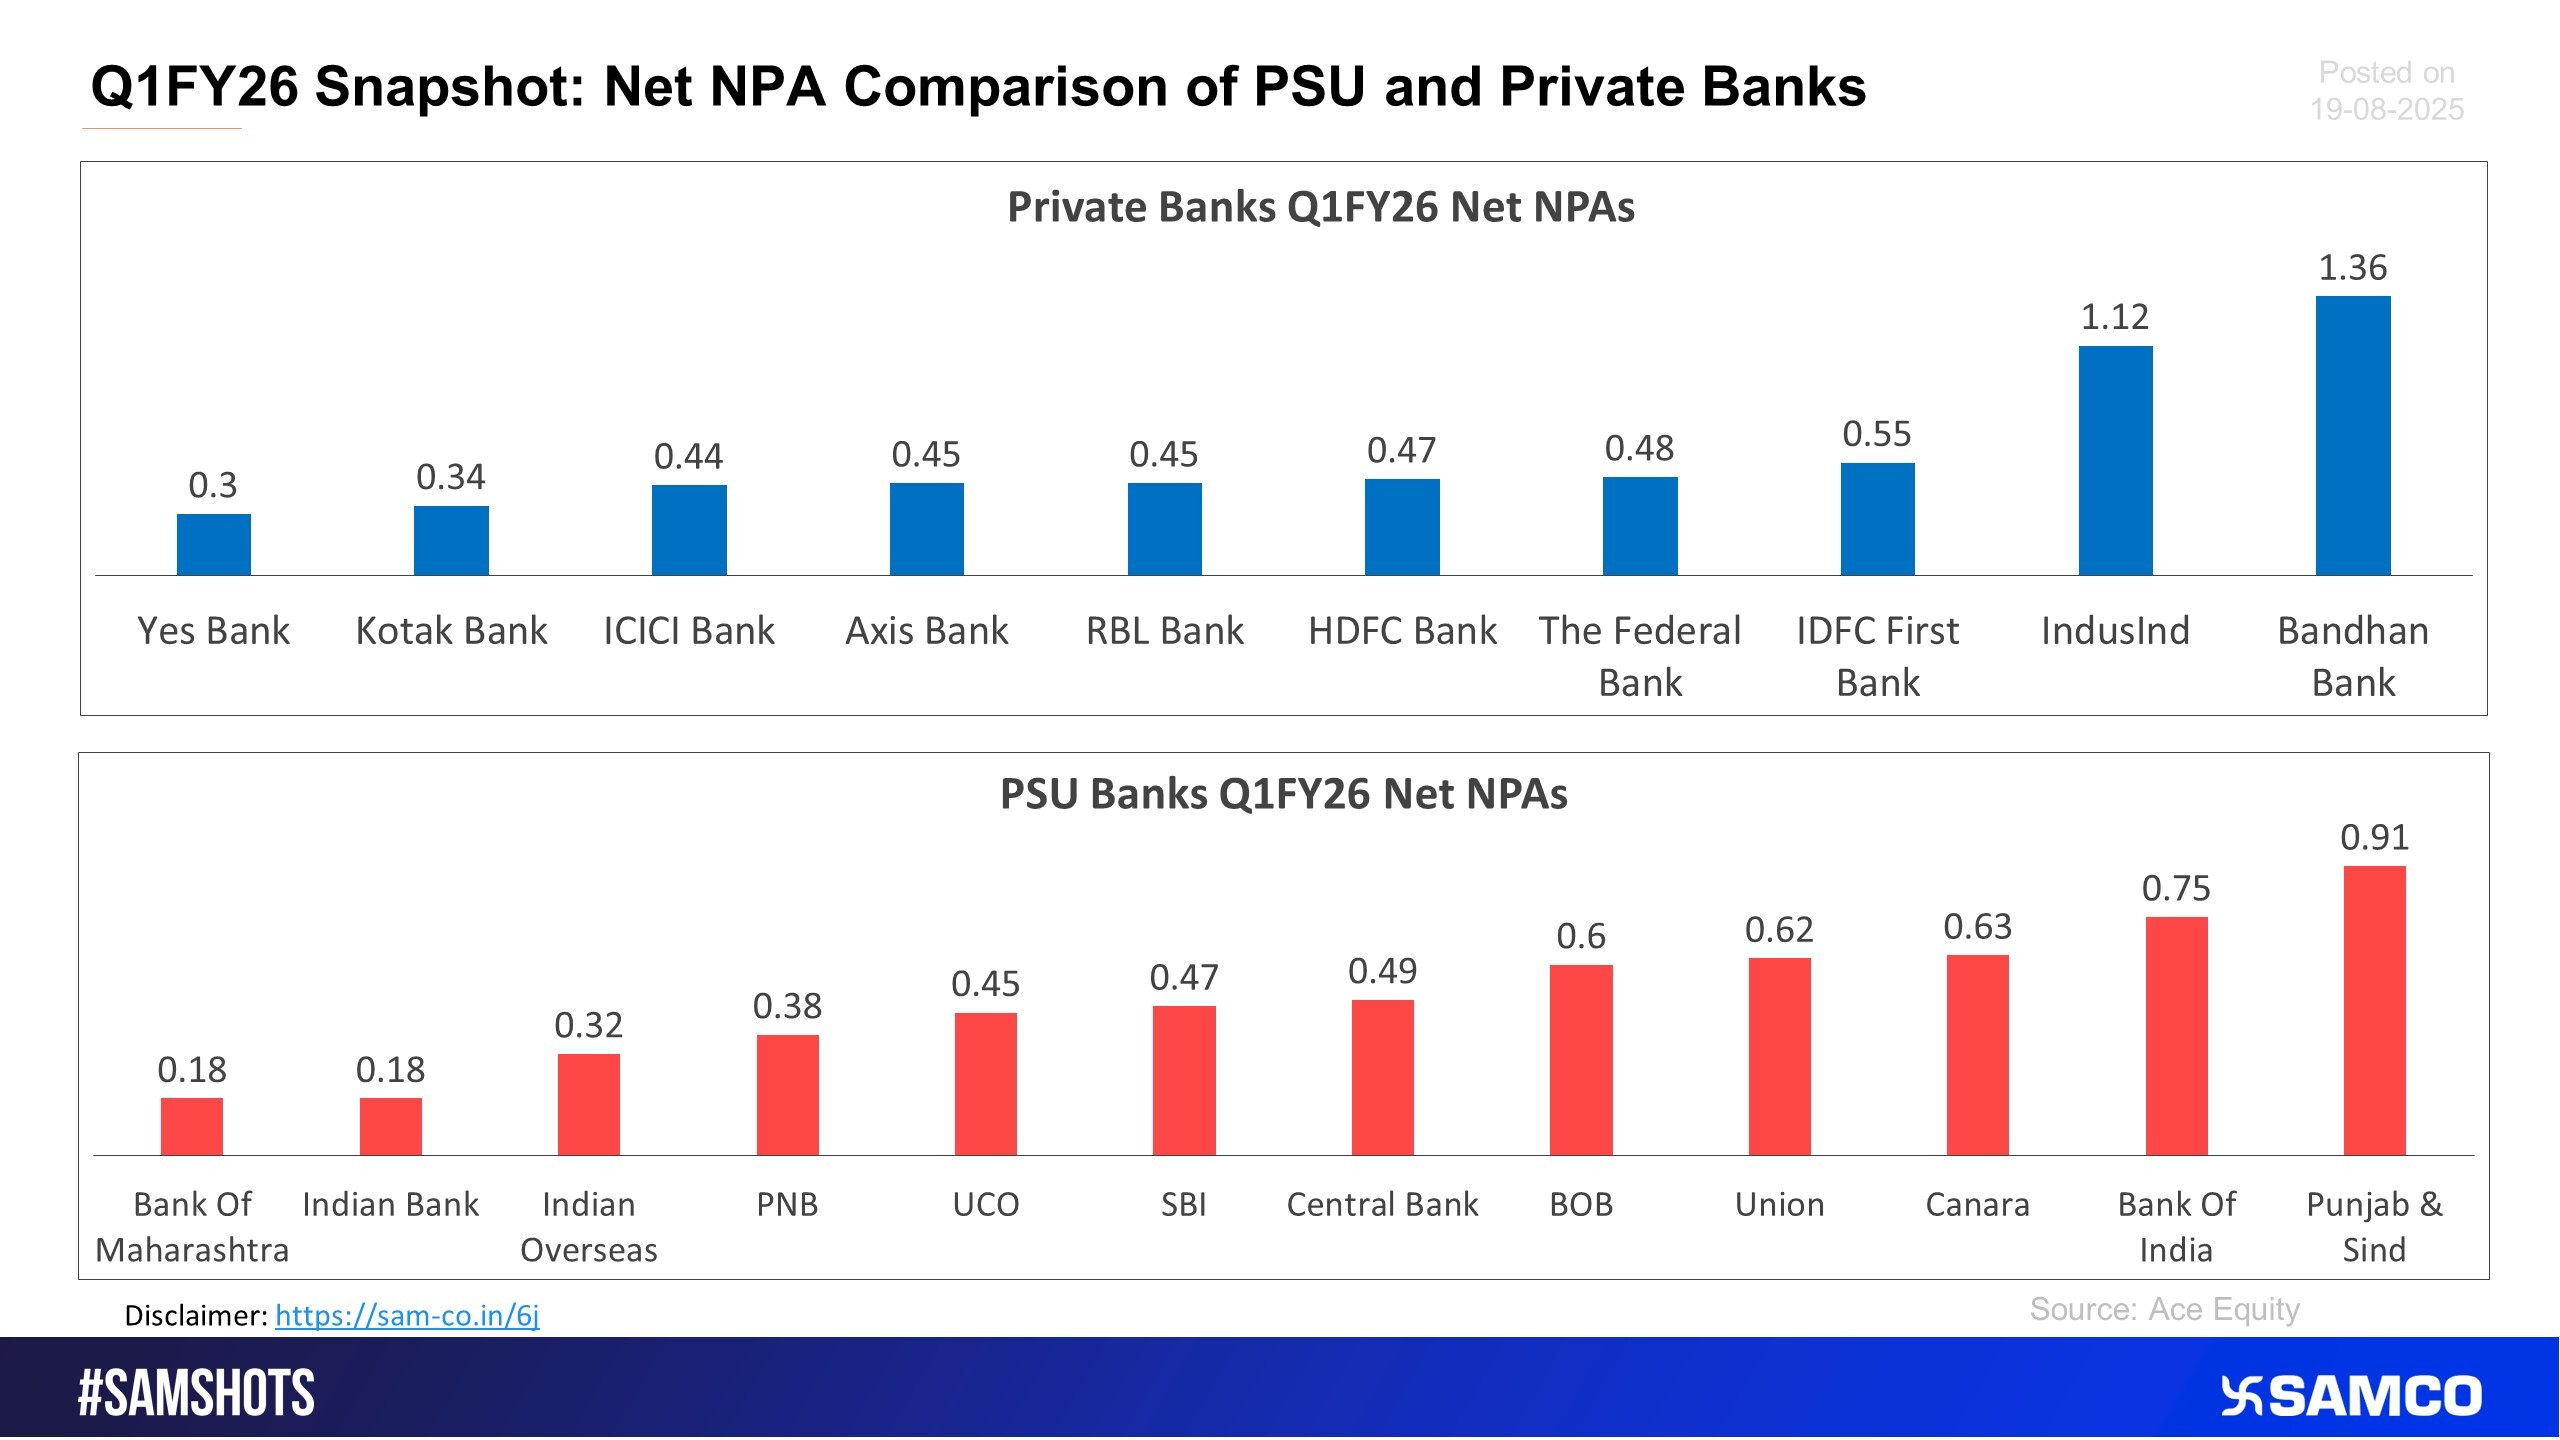
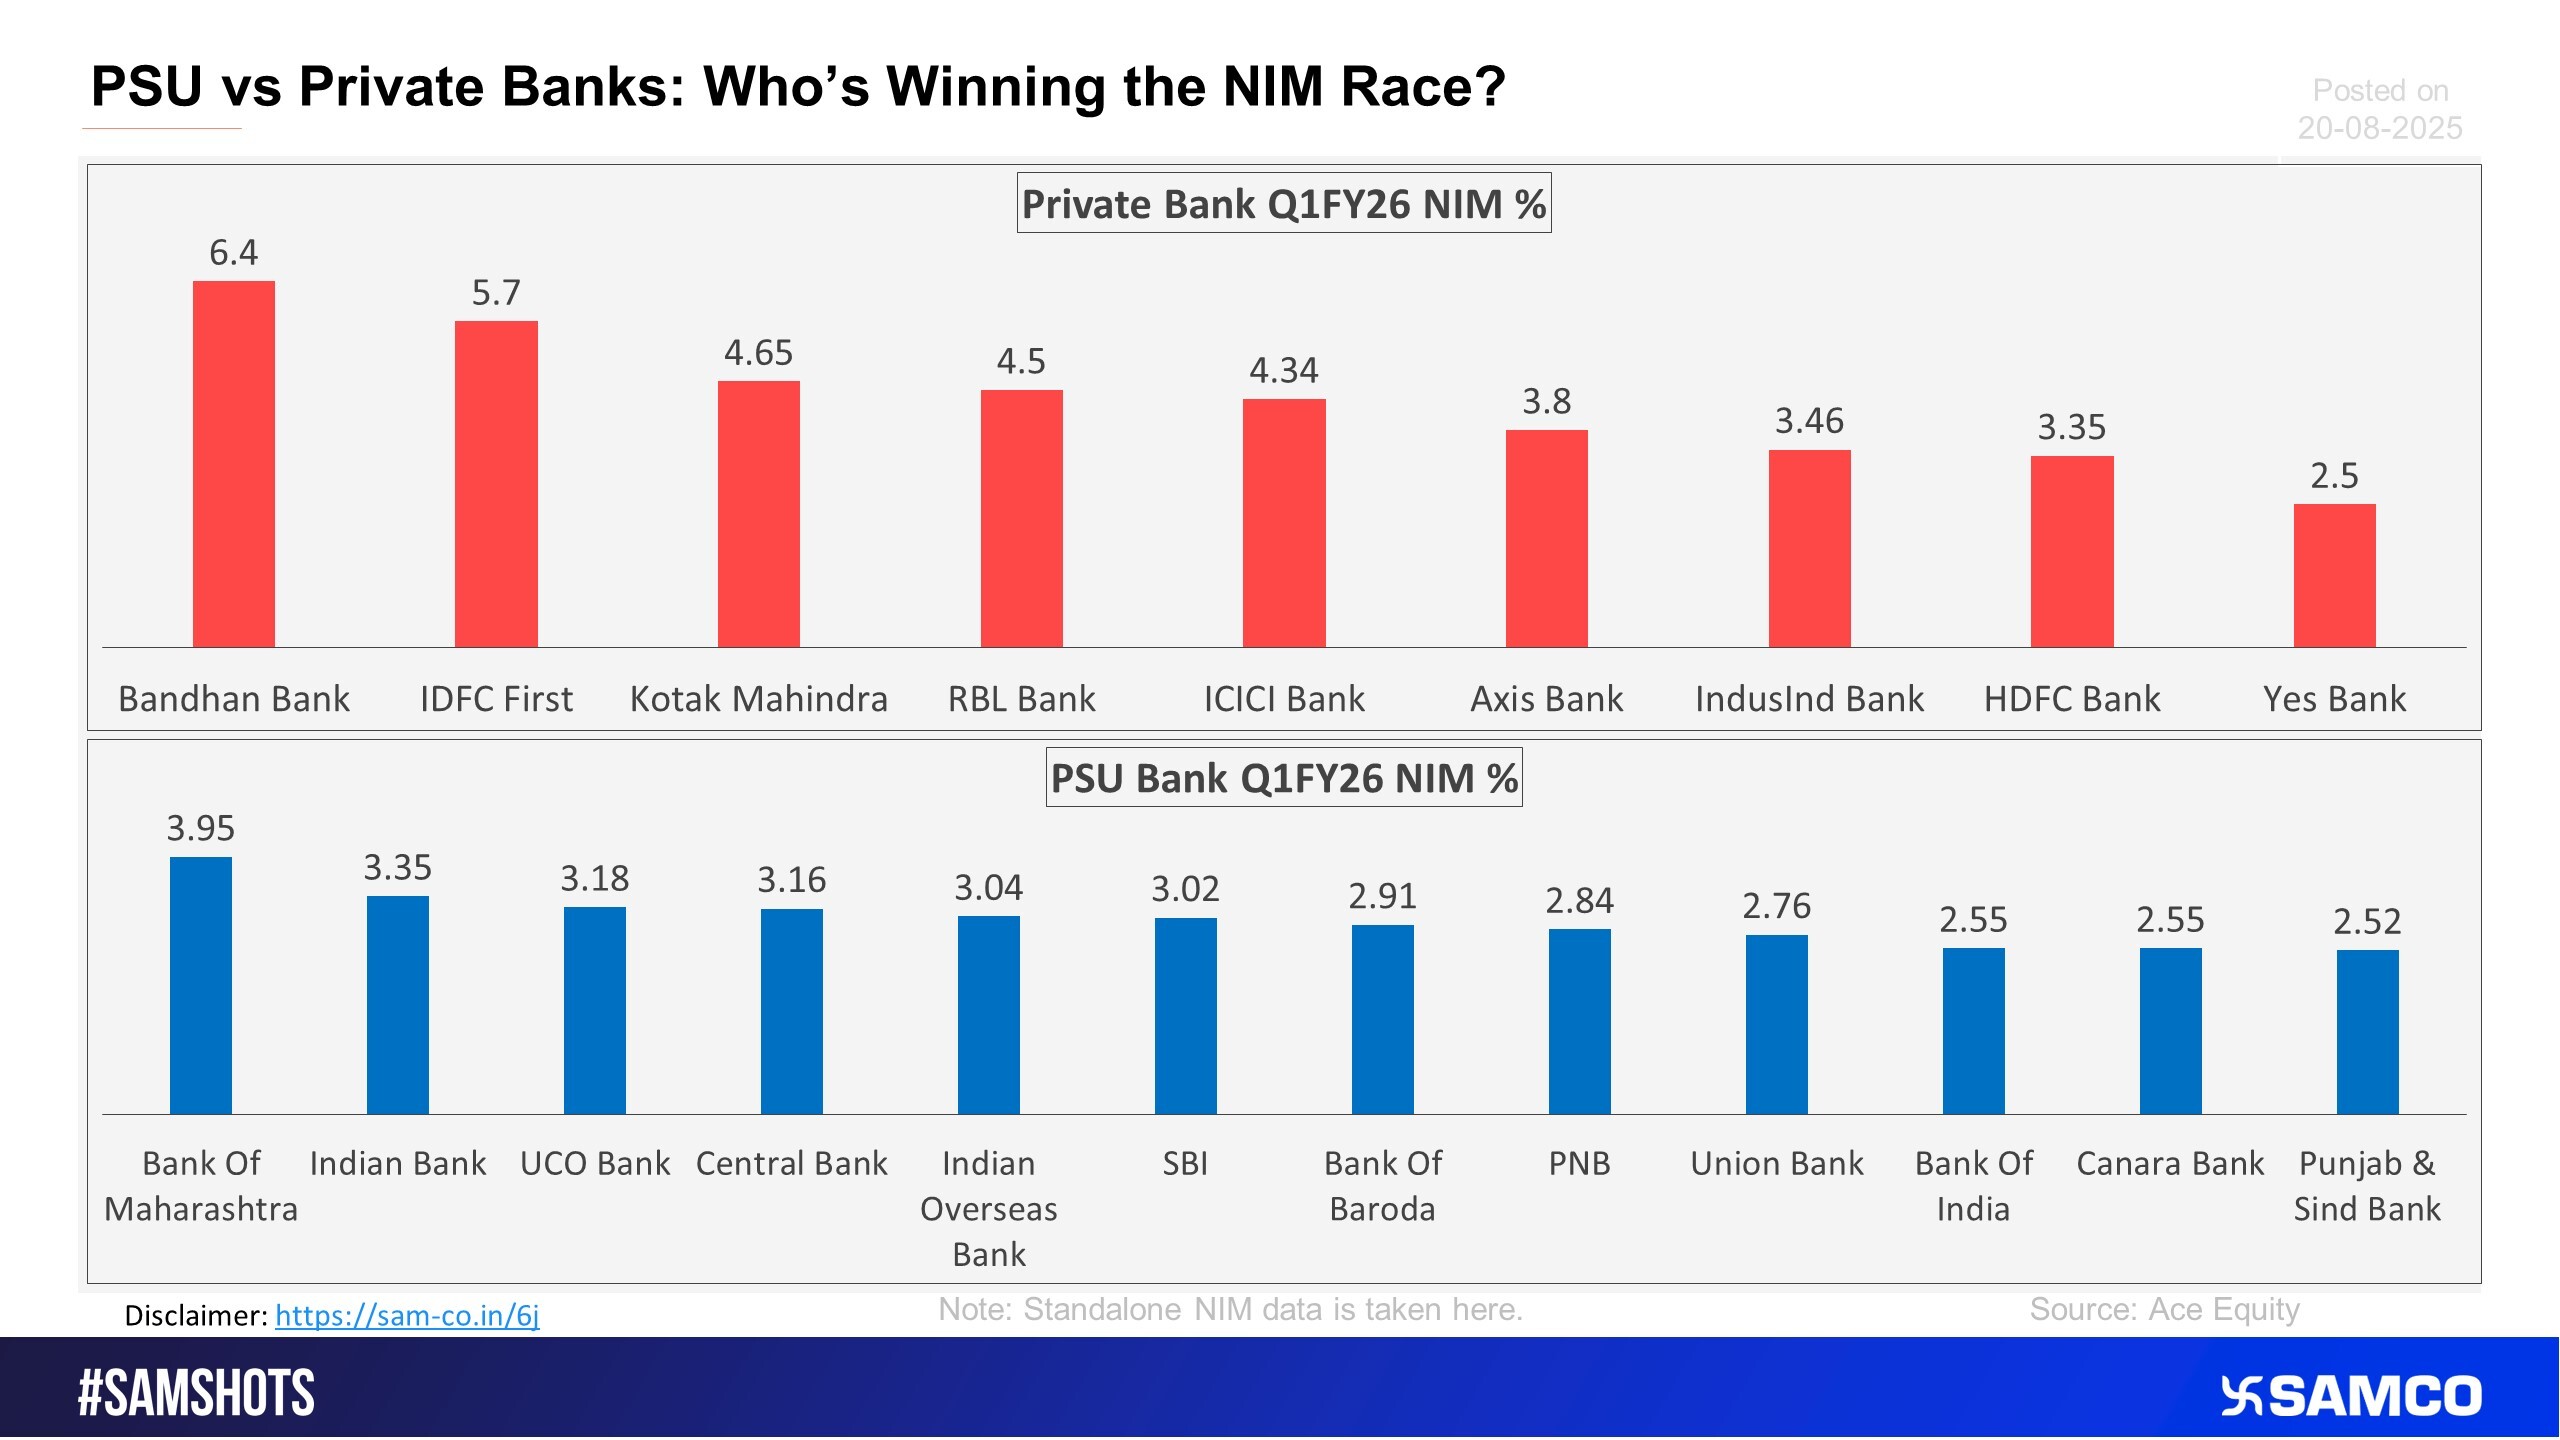
Here’s the PSU & Private banks’ Net NPA comparison
The chart below shows the NIMs of PSU & Private Banks.
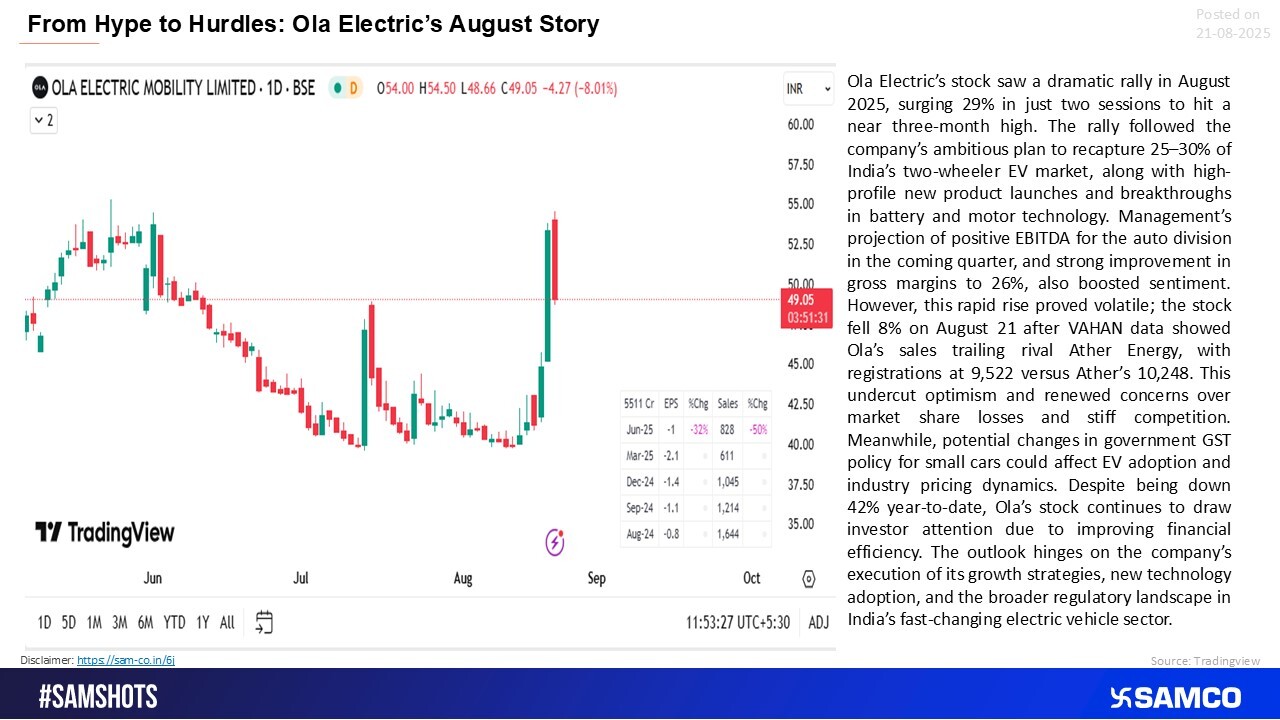
Ola Electric’s Stock Surges 29% Amid Bold Growth Plans and Tech Breakthroughs, Faces Volatility as Competition Heats Up
Q1 FY26 auto earnings showed a split ride—M&M, Bajaj, and TVS accelerated, while Tata Motors and others hit the brakes

India Faces Major Job Cuts Amid AI Shift and Cost Pressures

Nifty Auto’s Historic Gap Up: Momentum or Exhaustion Ahead?
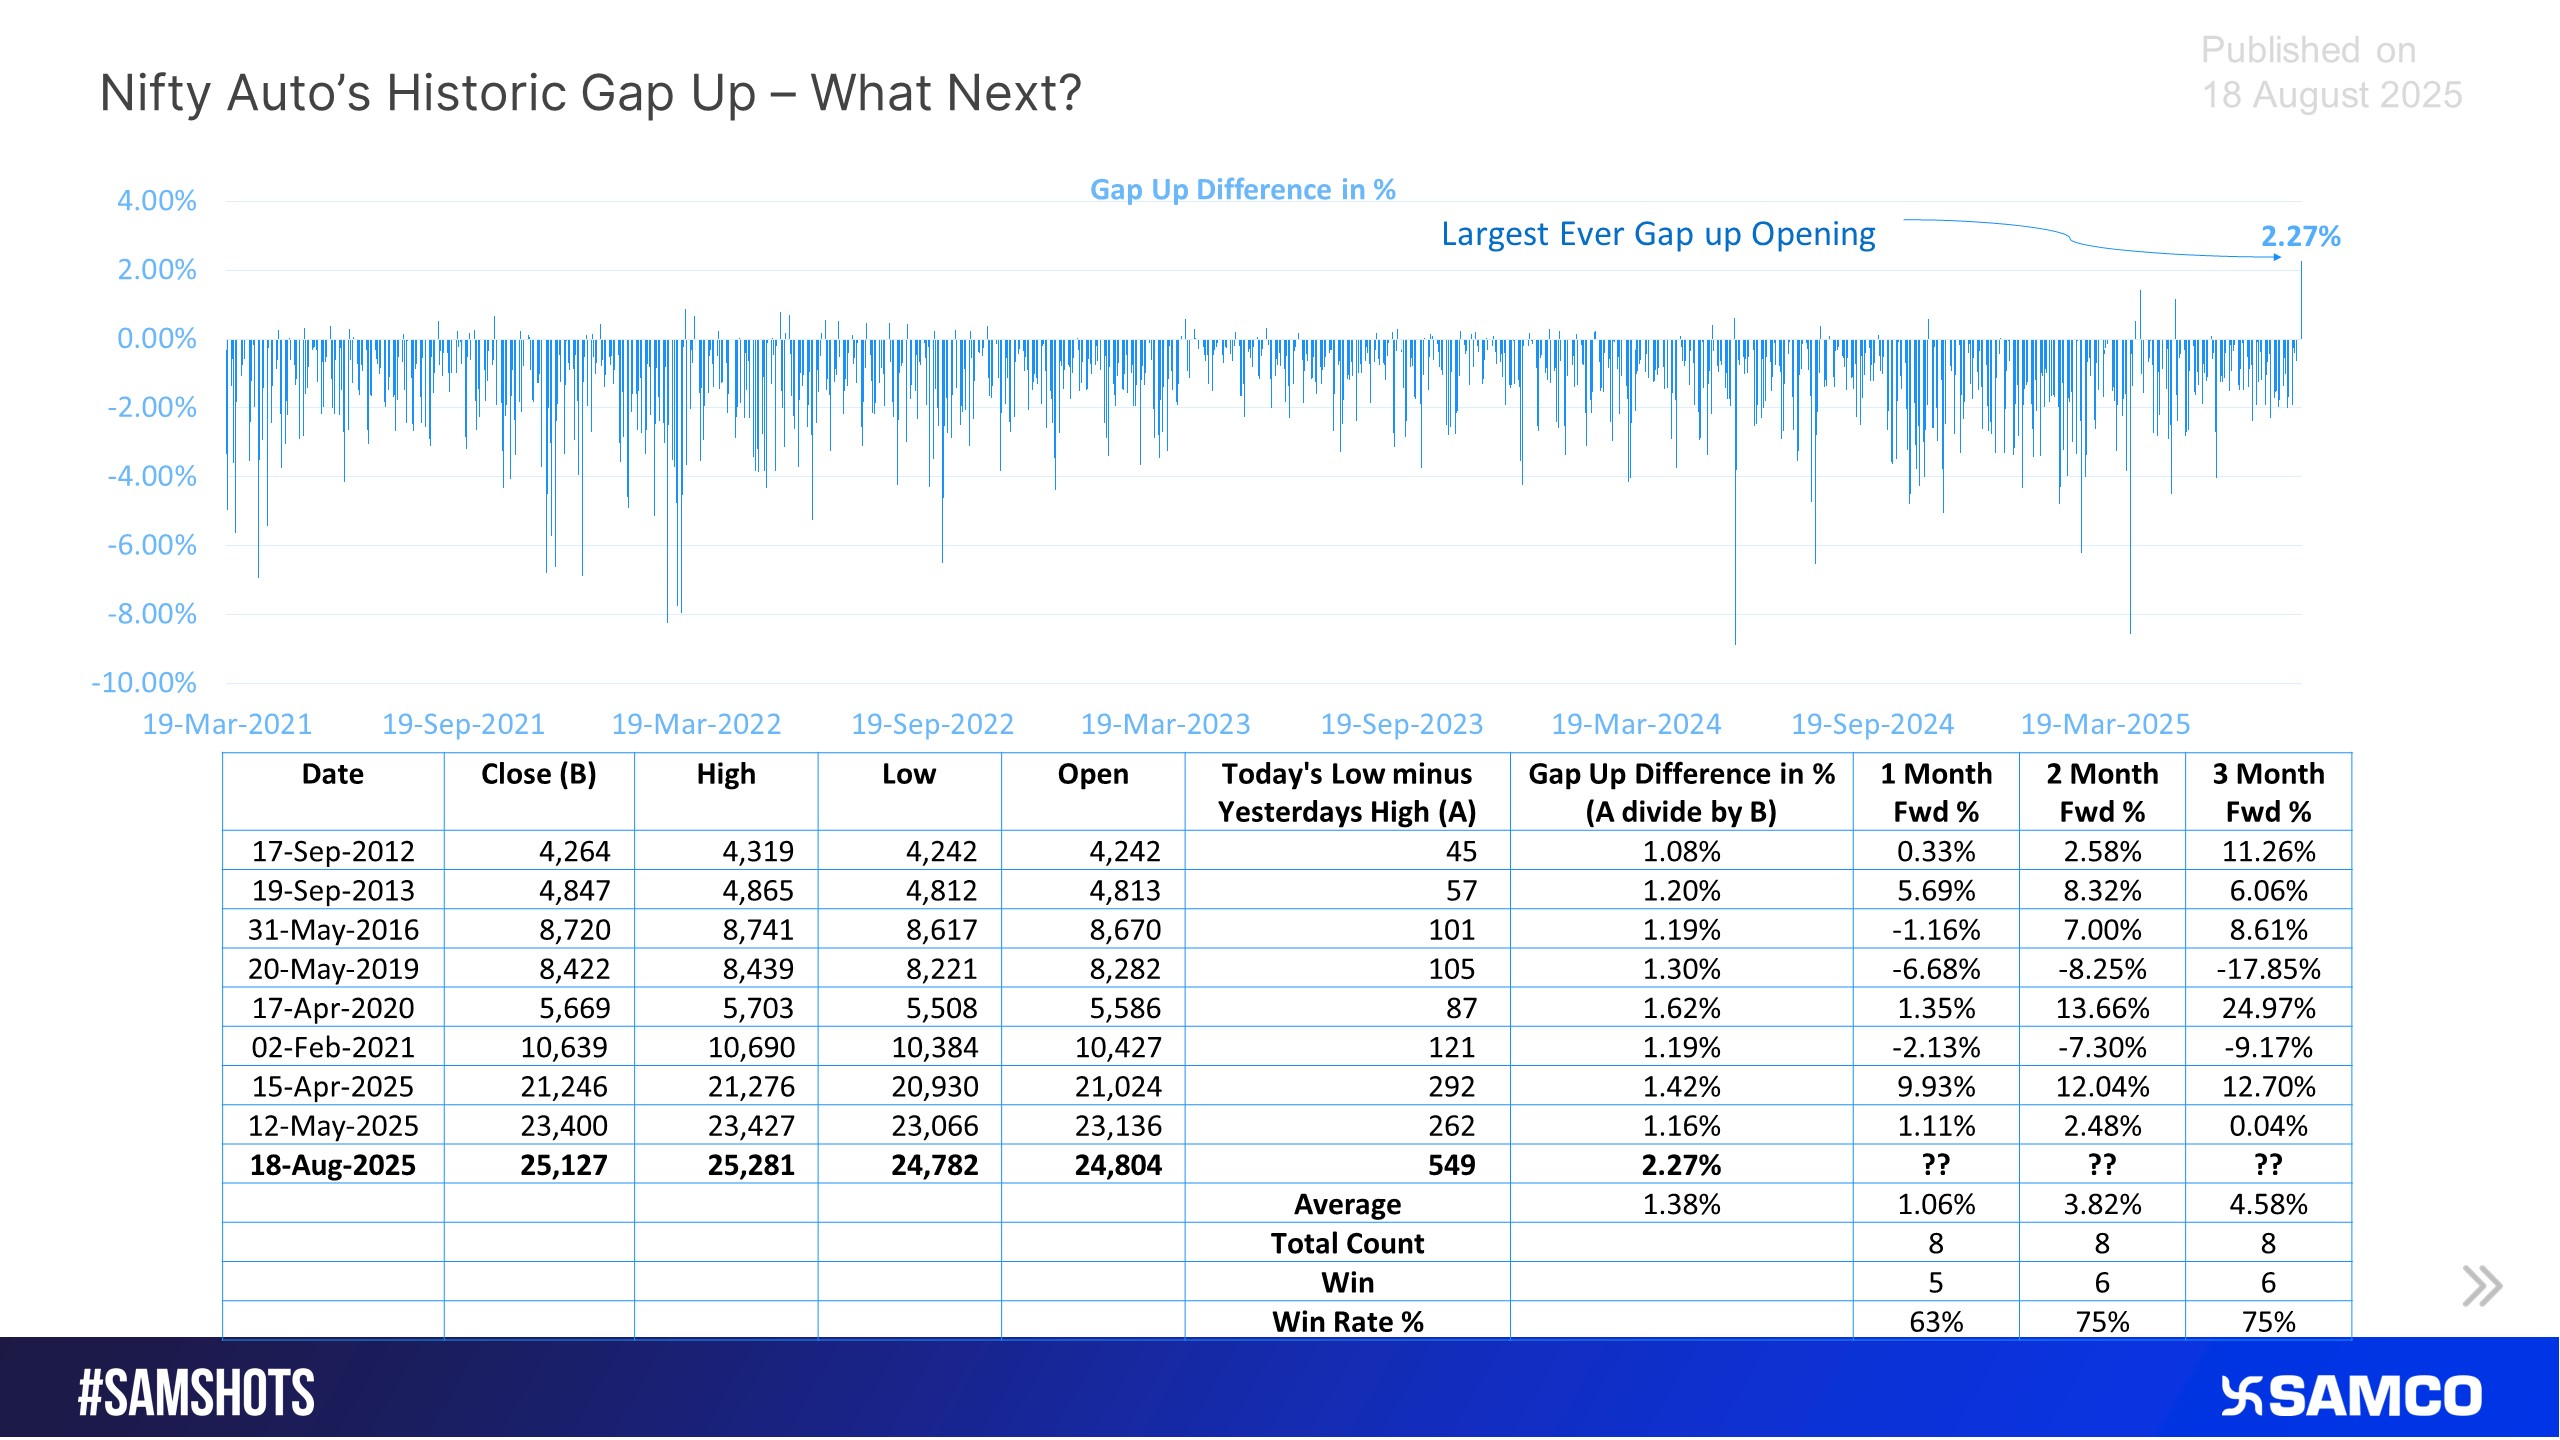
The below snip shows the recent surge in Nifty, which occurred after 3 months

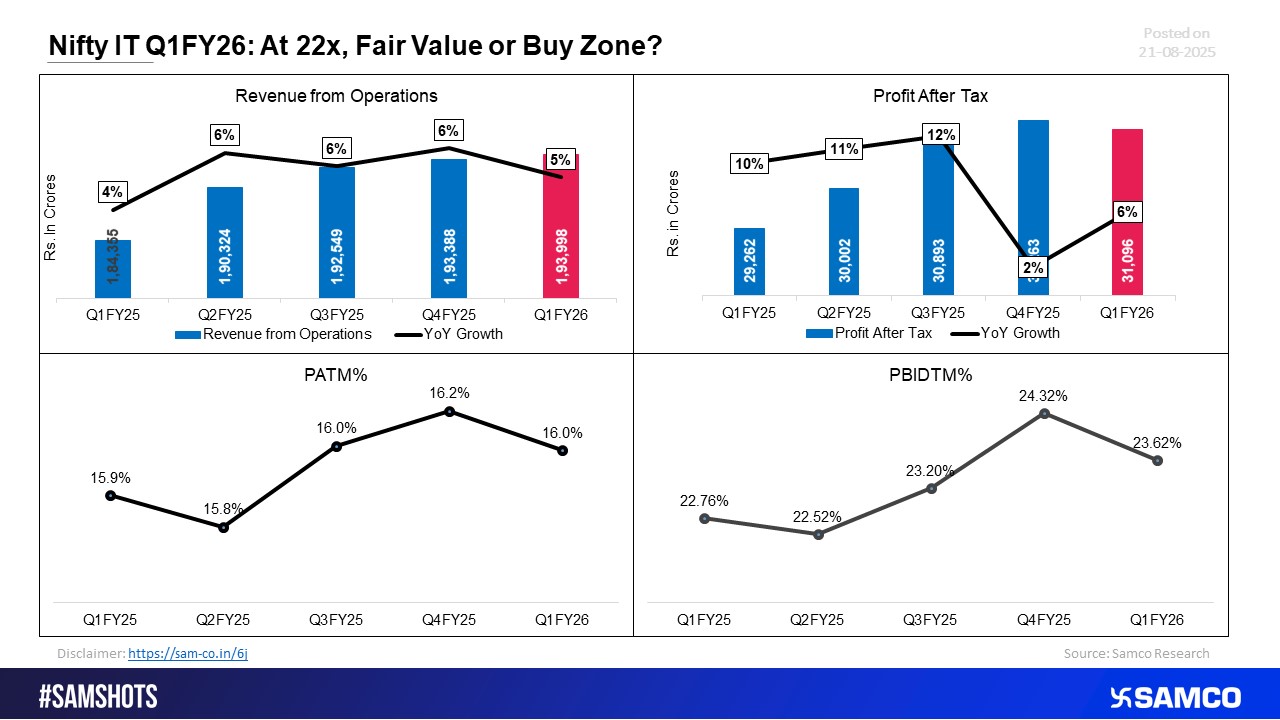
Q1FY26 Check: Nifty IT at 22x – Fair Value or Entry Point?
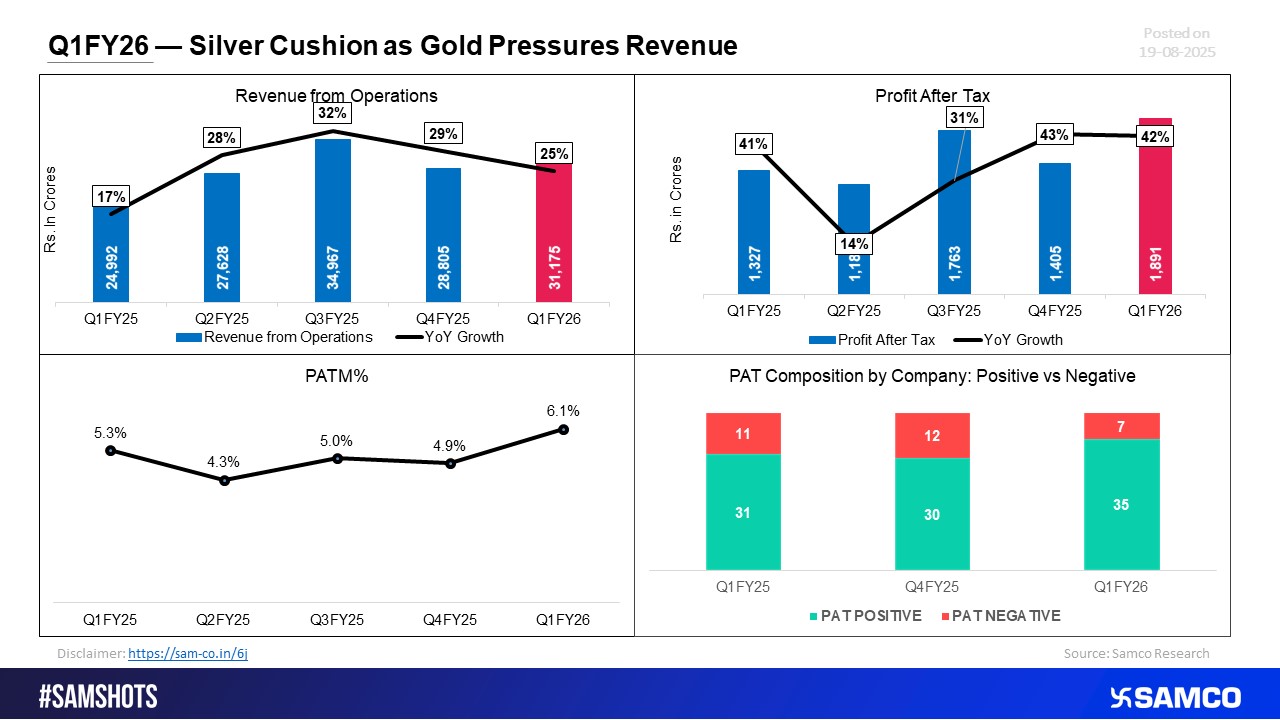
Silver Shines as Gold Weighs on Revenue in Q1FY26
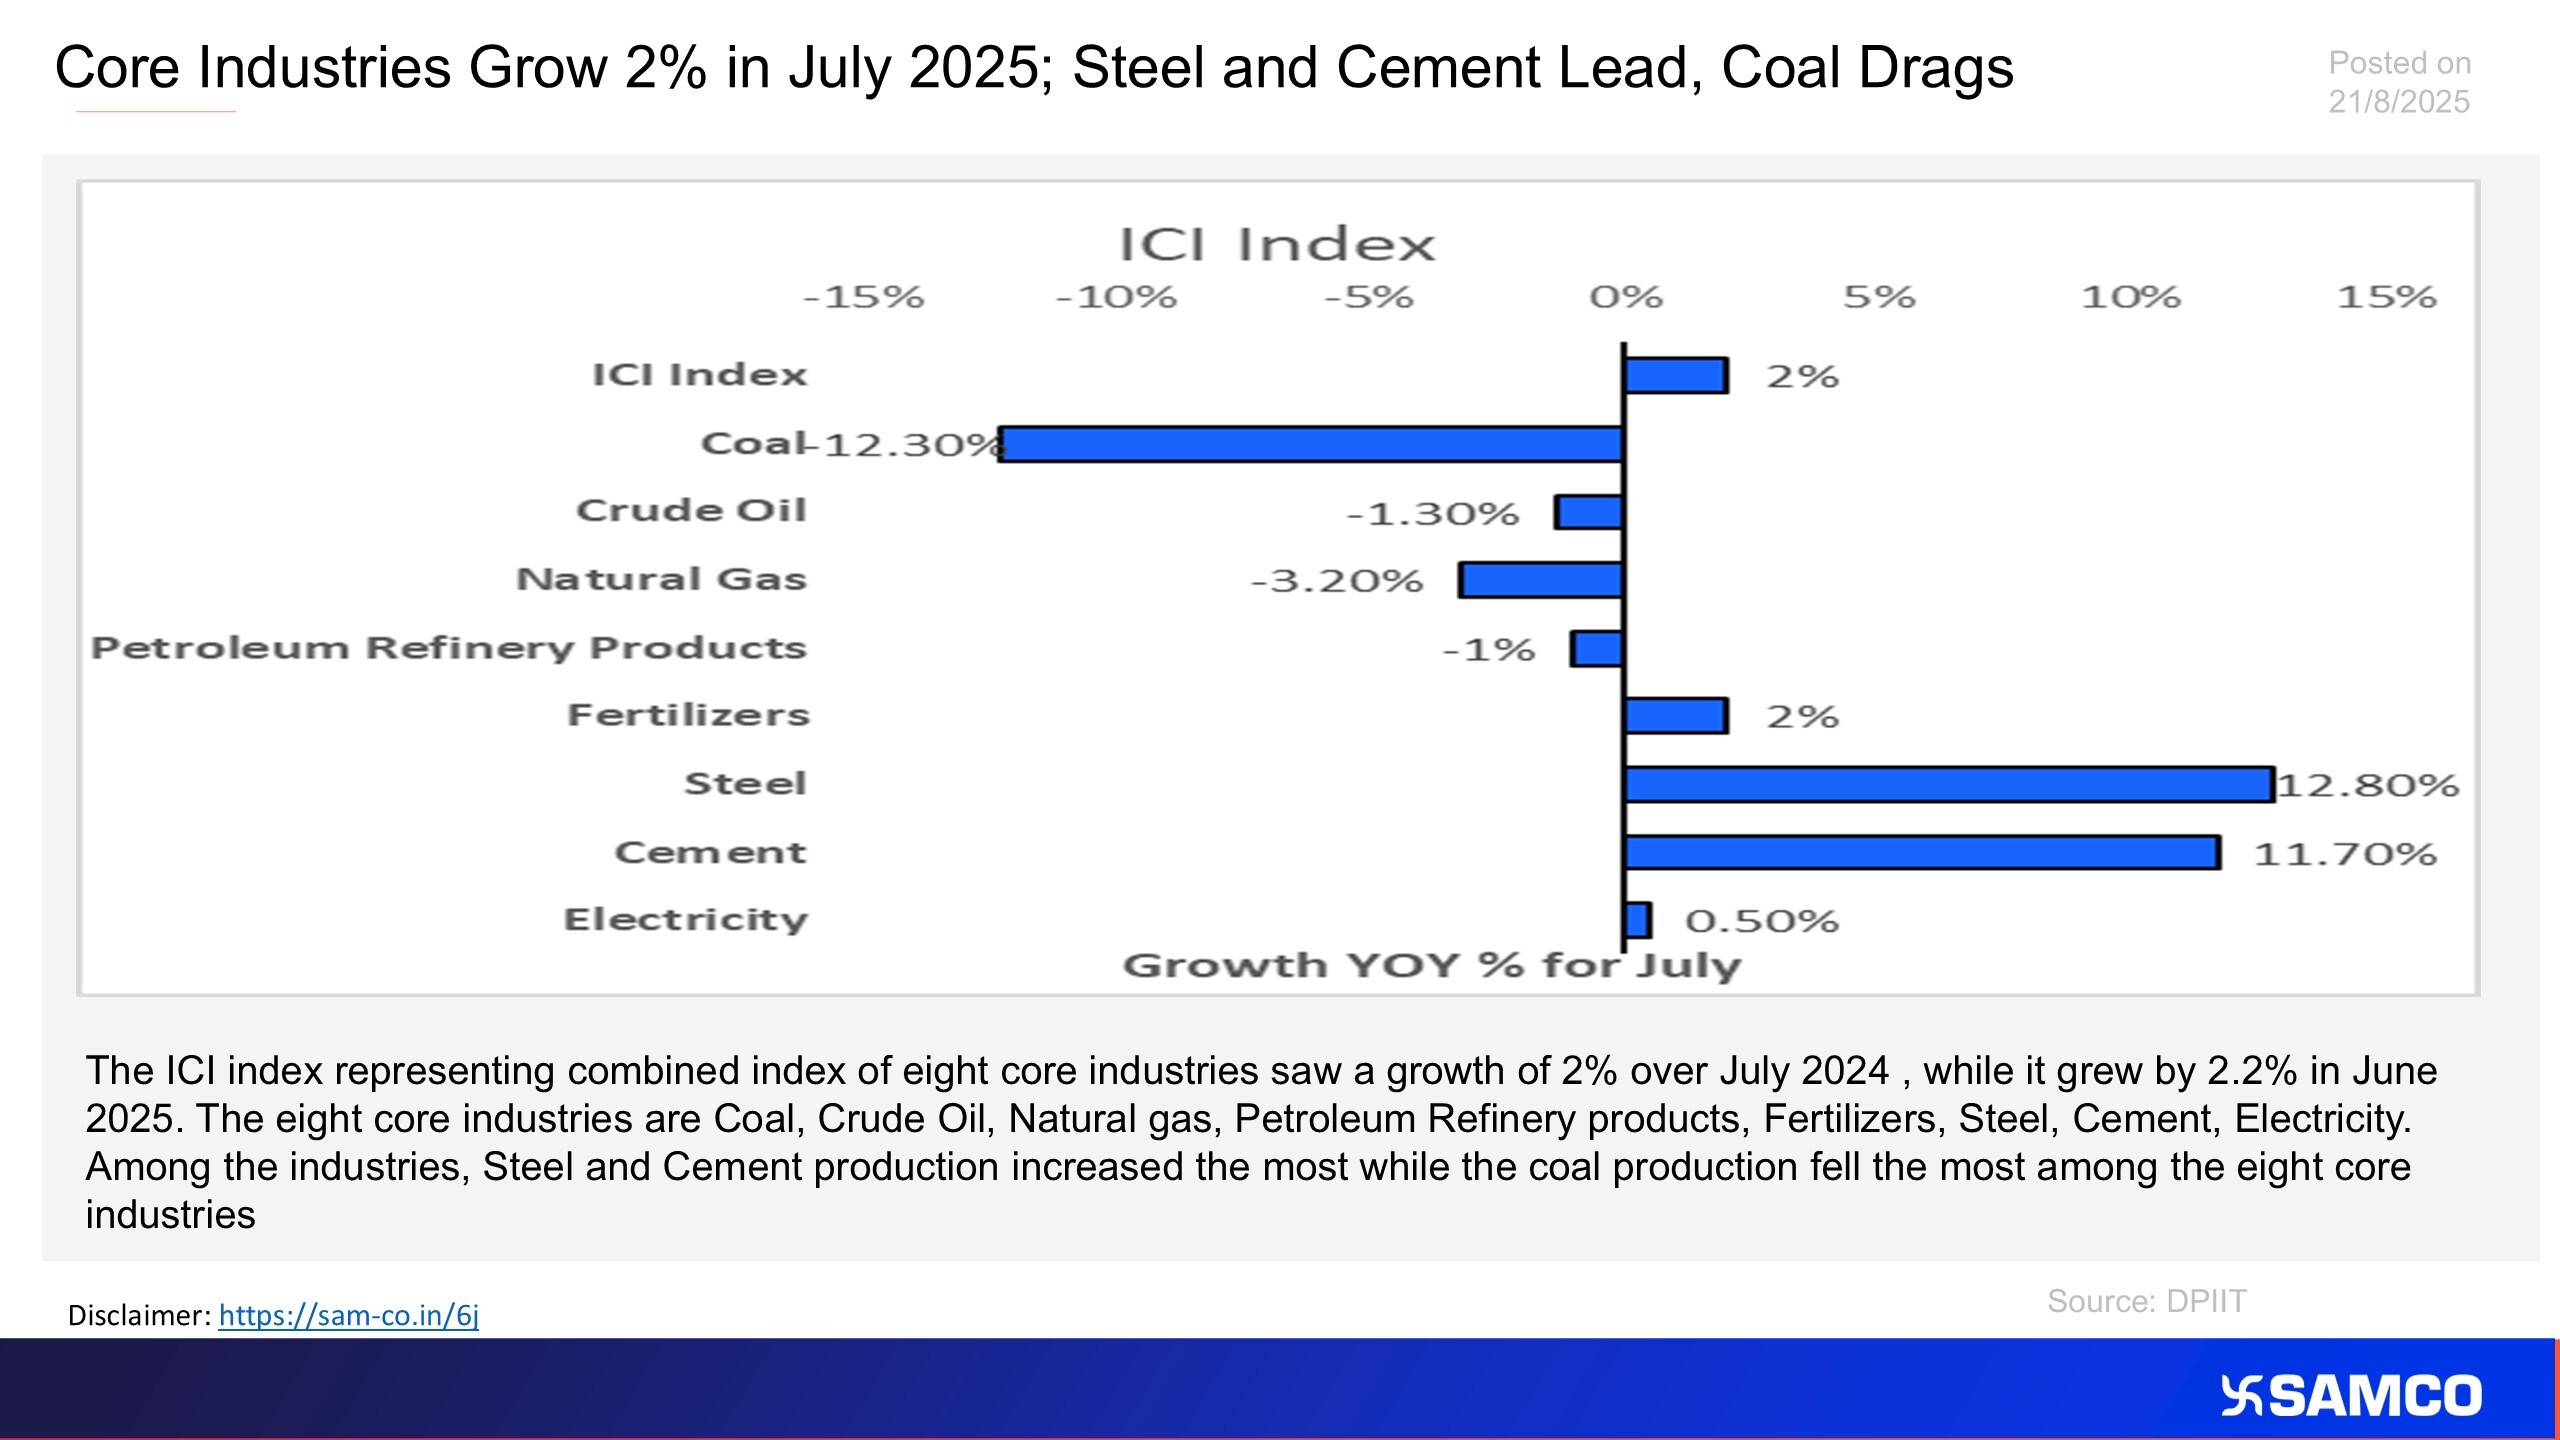
The chart evaluates the laggards and leaders of eight core industries
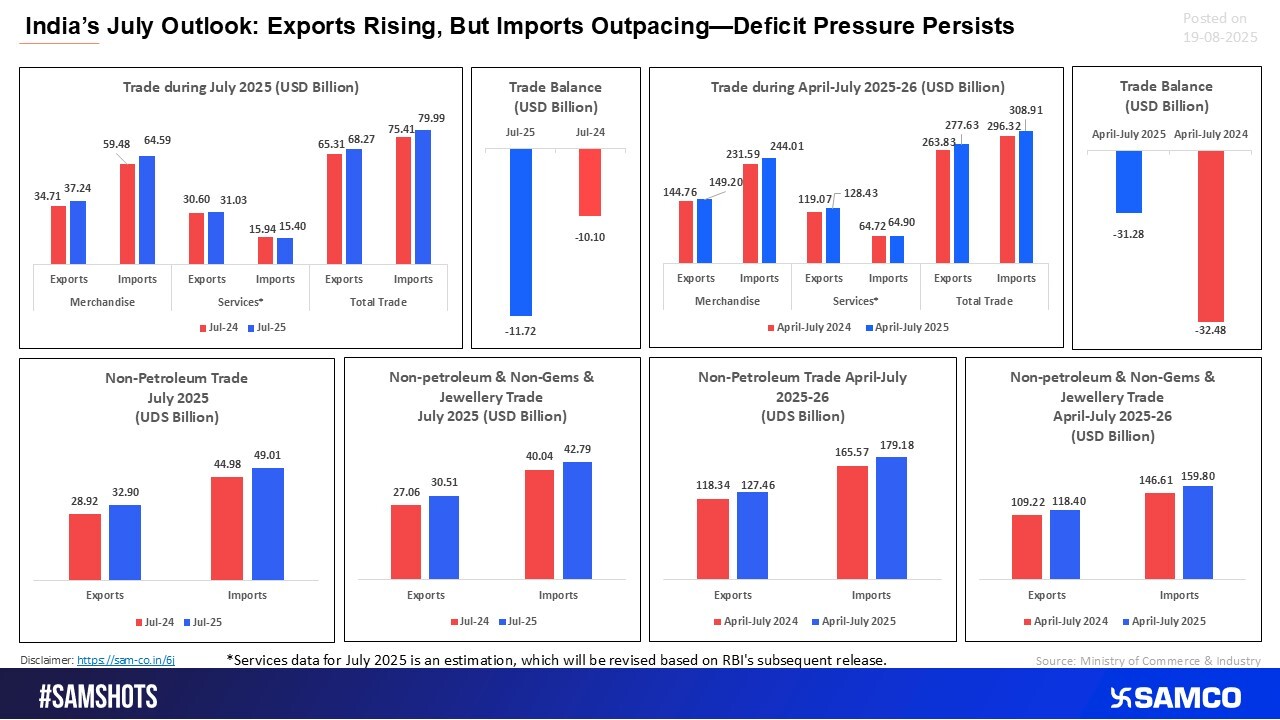
India’s trade story in July 2025 shows mixed signals
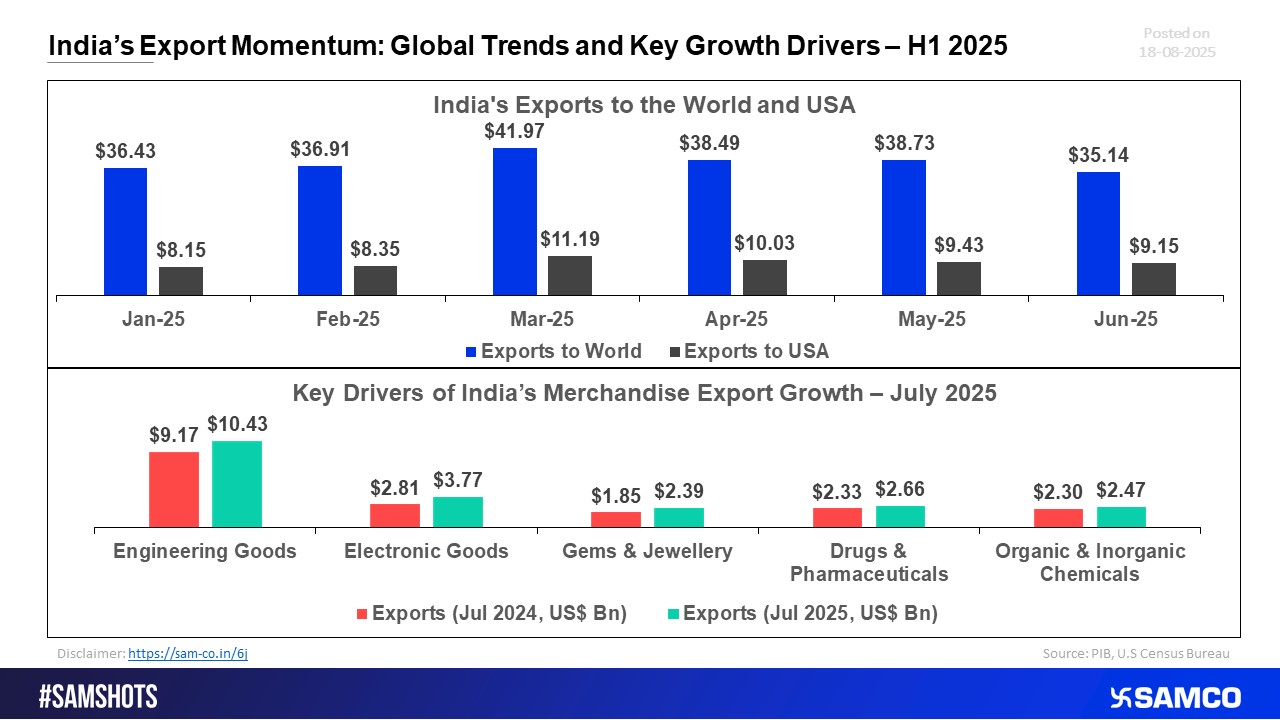
India’s Exports in H1 2025: Momentum, Global Trends, and Growth Triggers
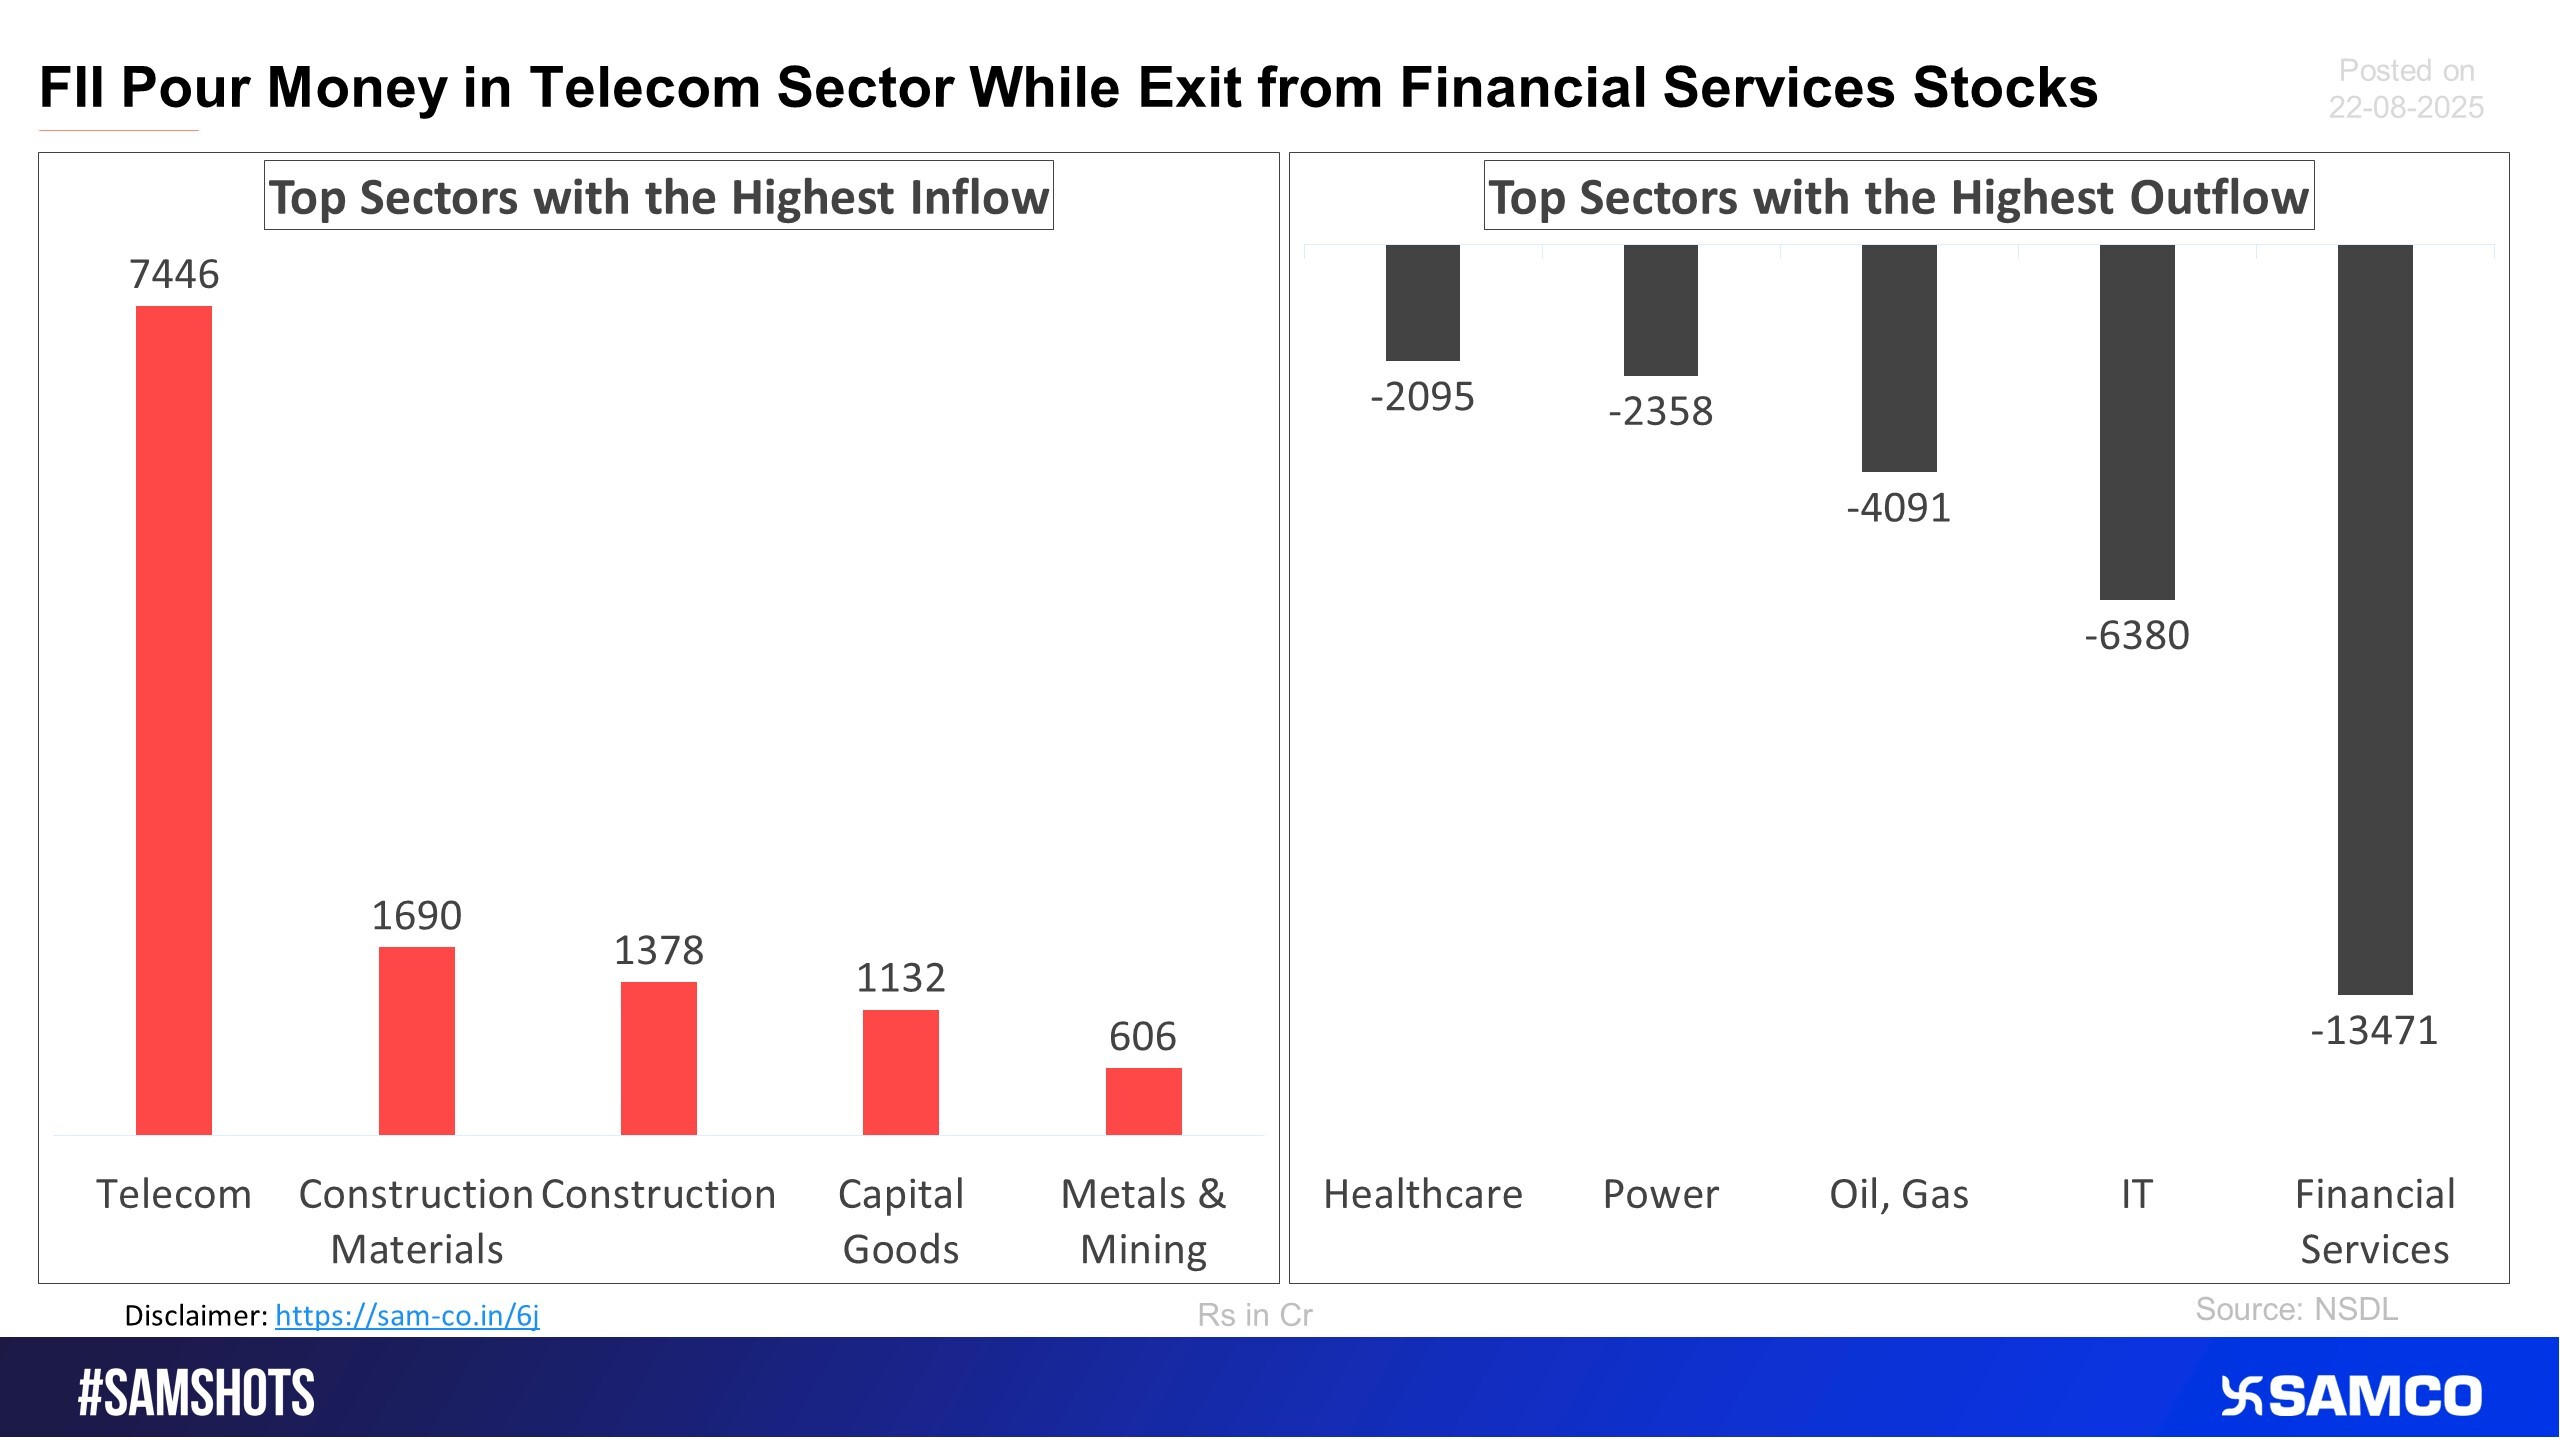
The accompanying chart shows the top 5 sectors that witnessed FPI’s highest inflow and outflow in the latest quarter
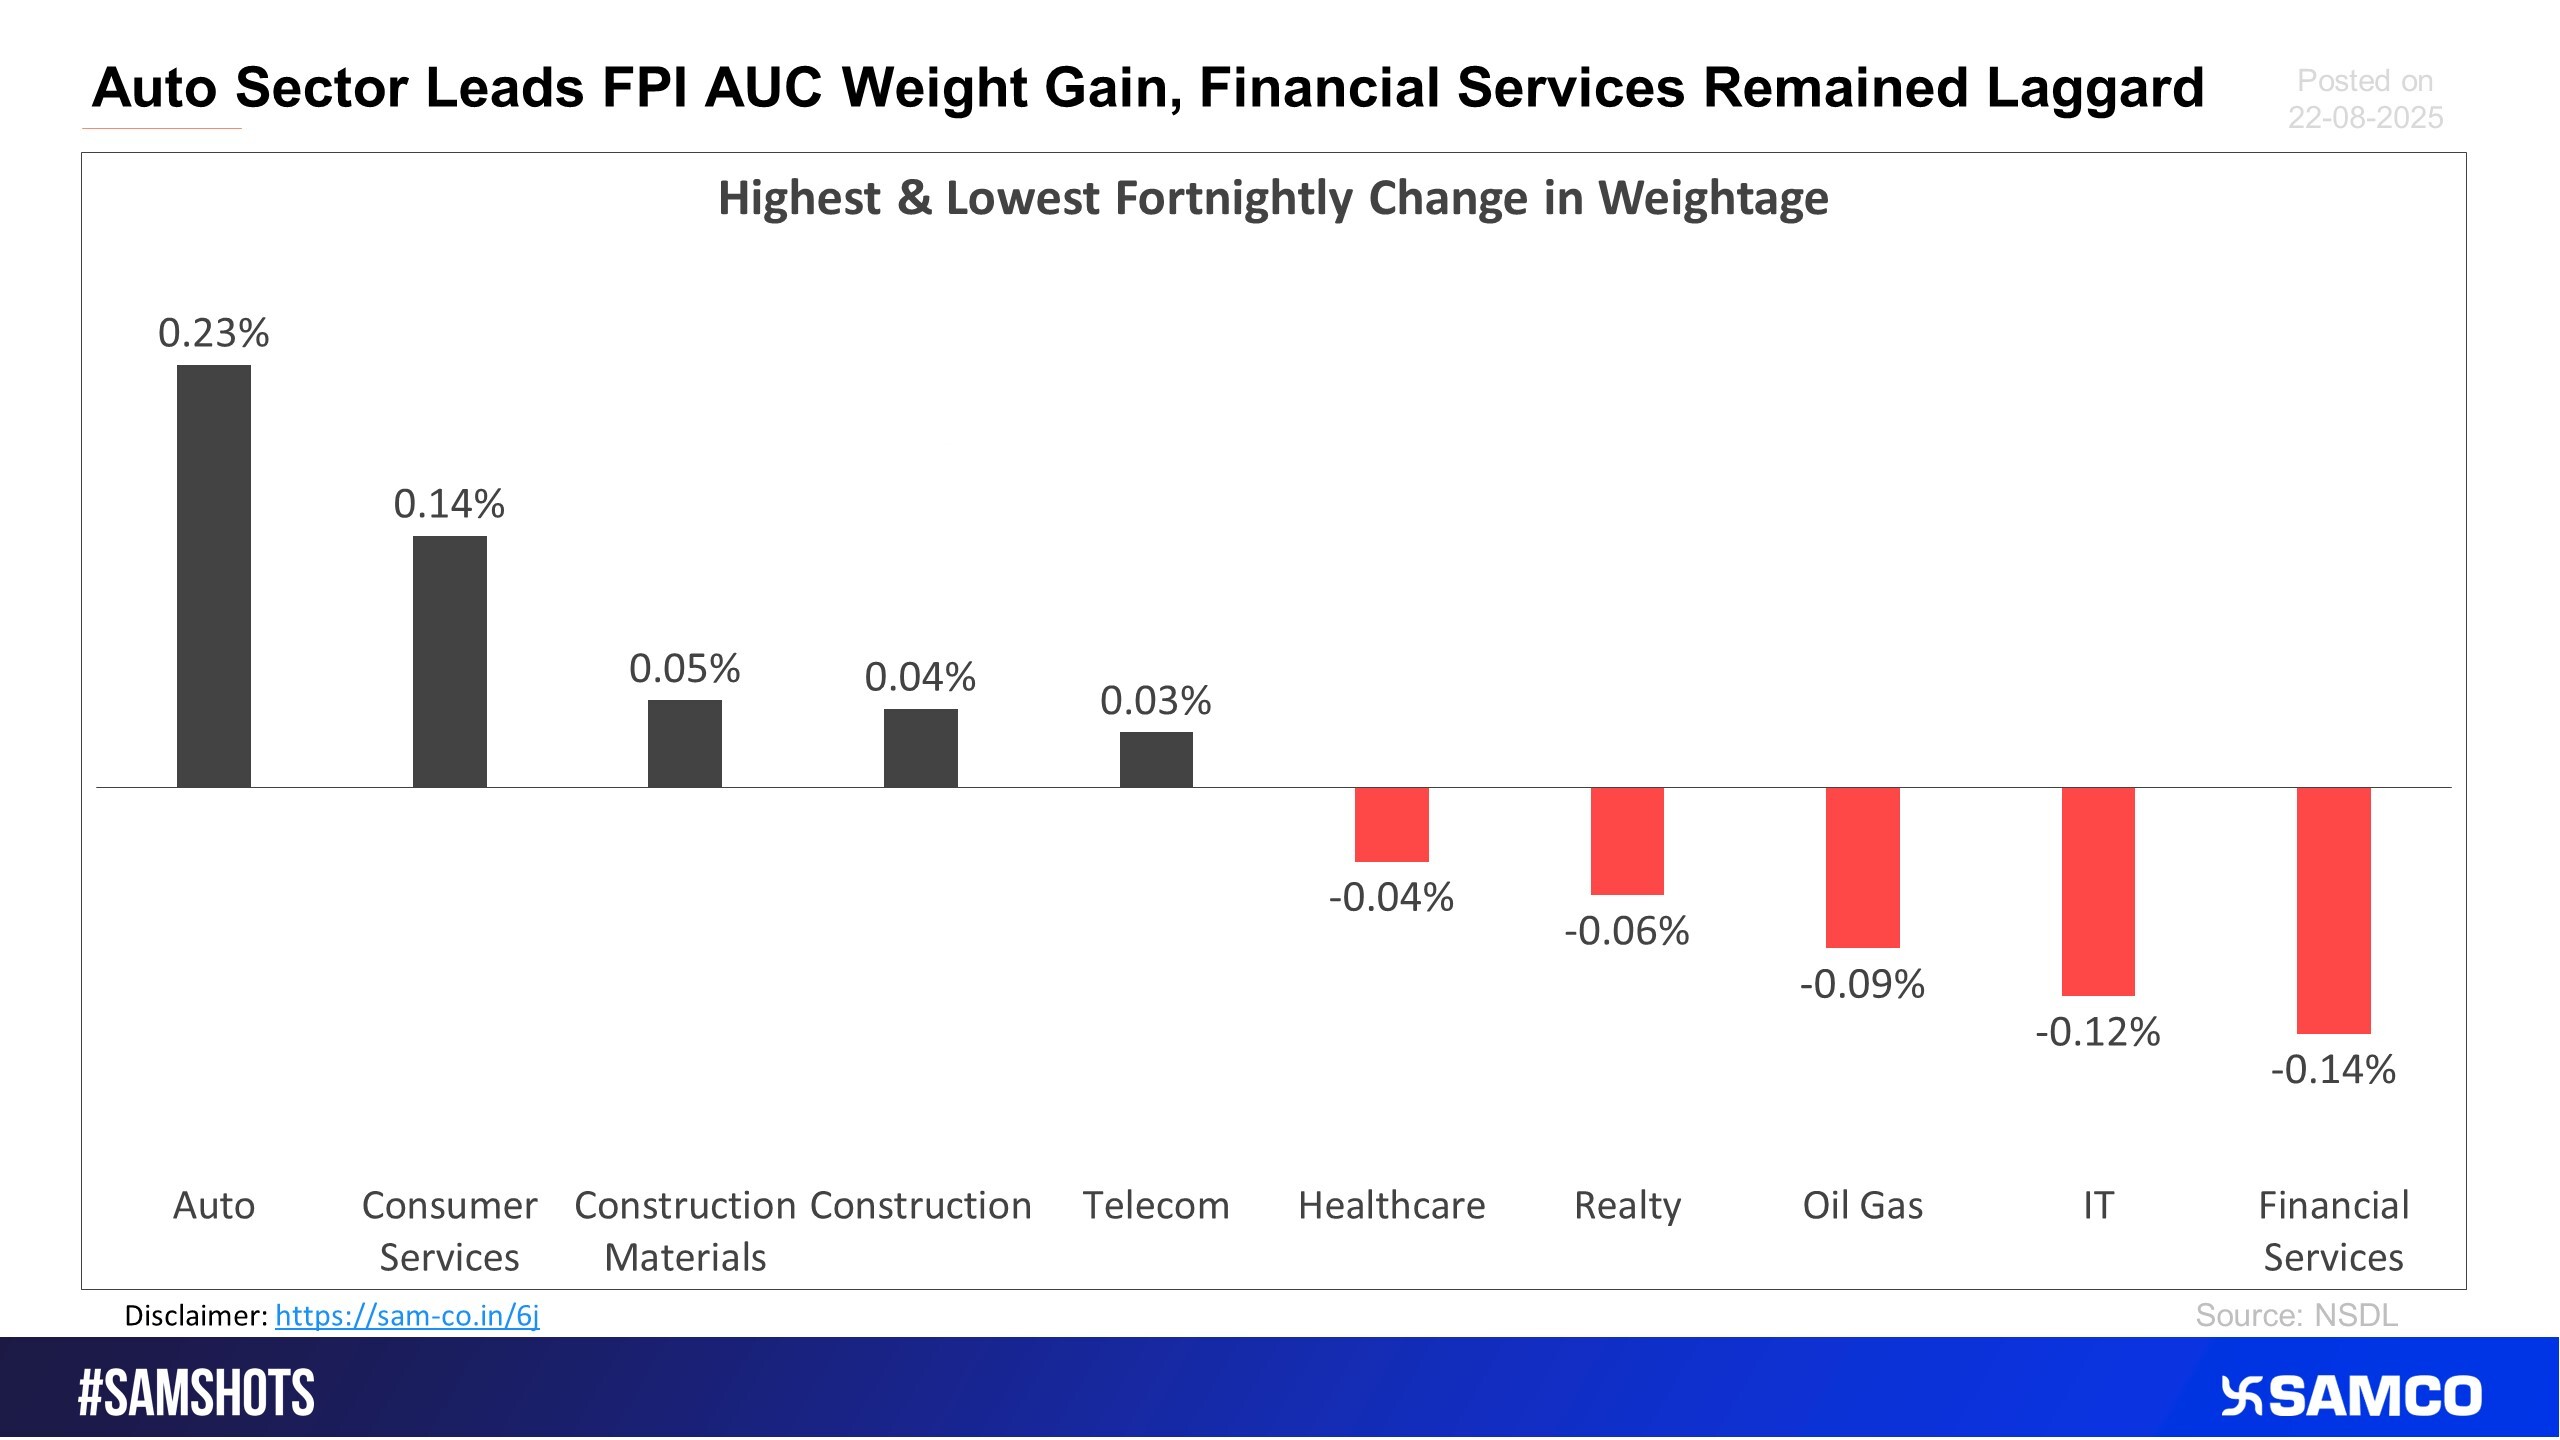
The chart below displays sectors that witnessed the highest and lowest change in the weightage of sectoral FPI holdings to the total FPI holdings compared to the previous fortnight
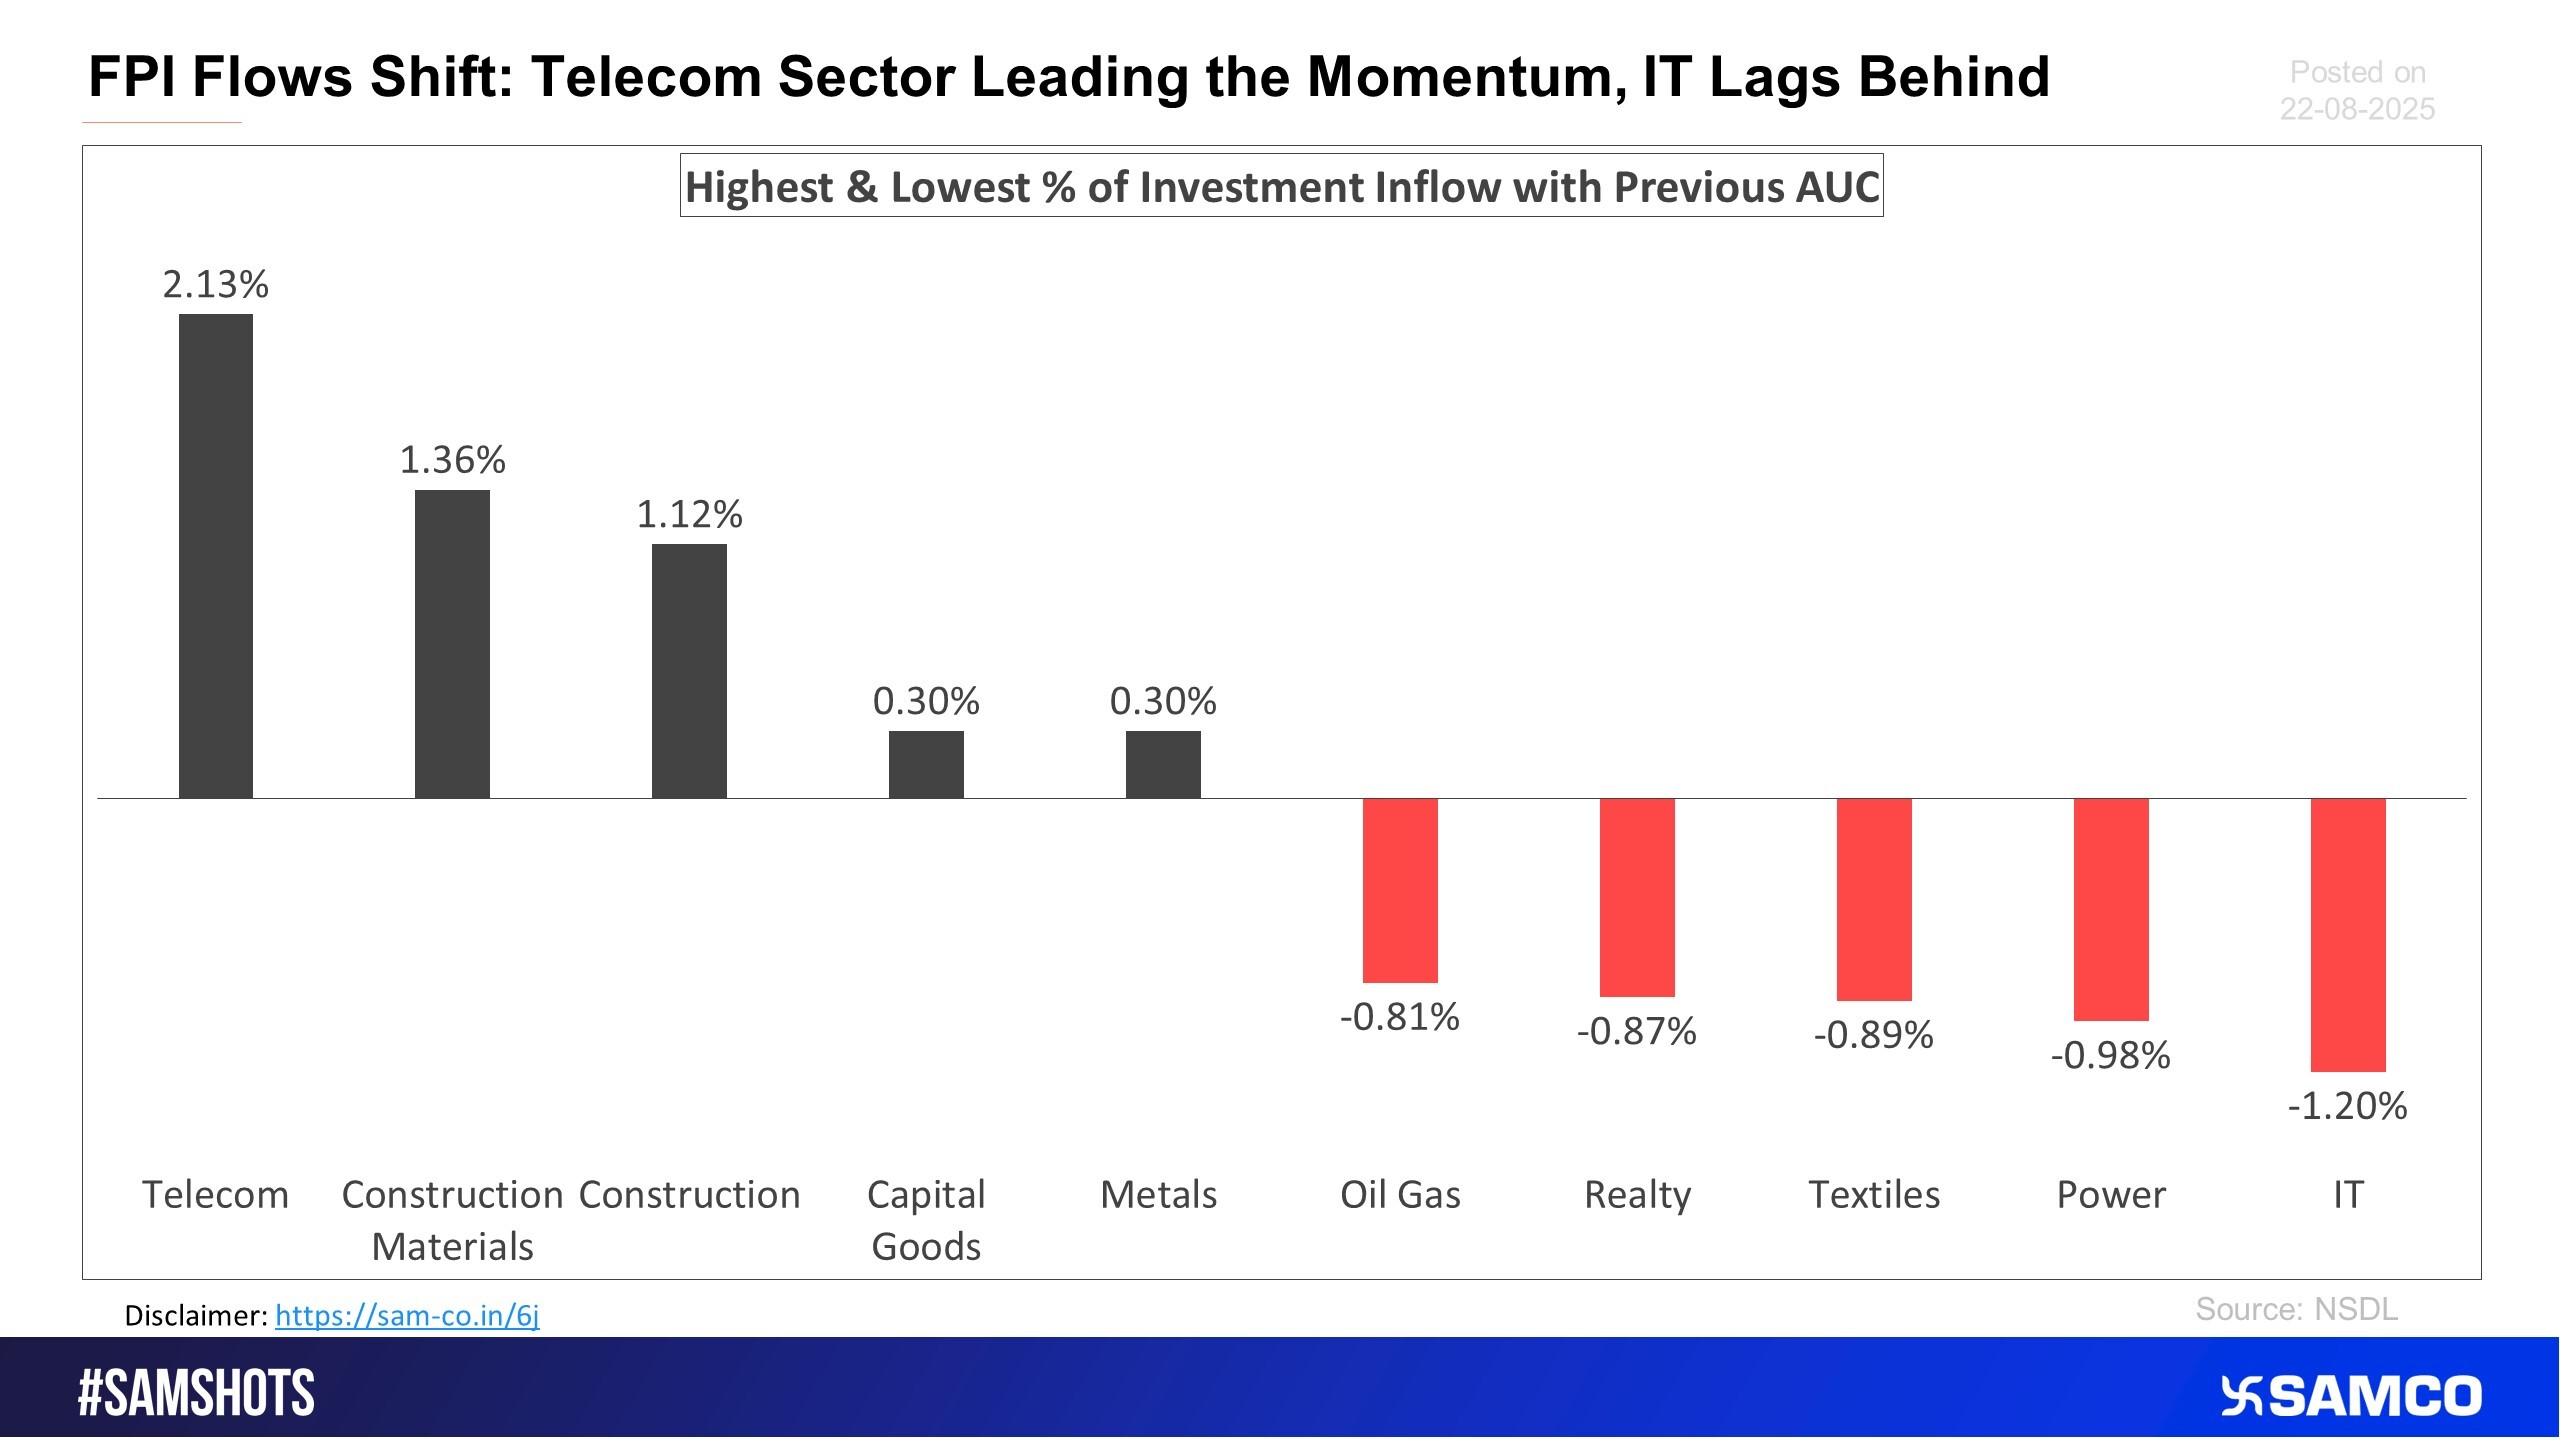
The chart below presents the highest & lowest percentage inflow of investment in the latest fortnight compared to the previous period AUC (Asset Under Custody) of FPI
EMCURE breaks out of bullish structure; momentum signals further upside
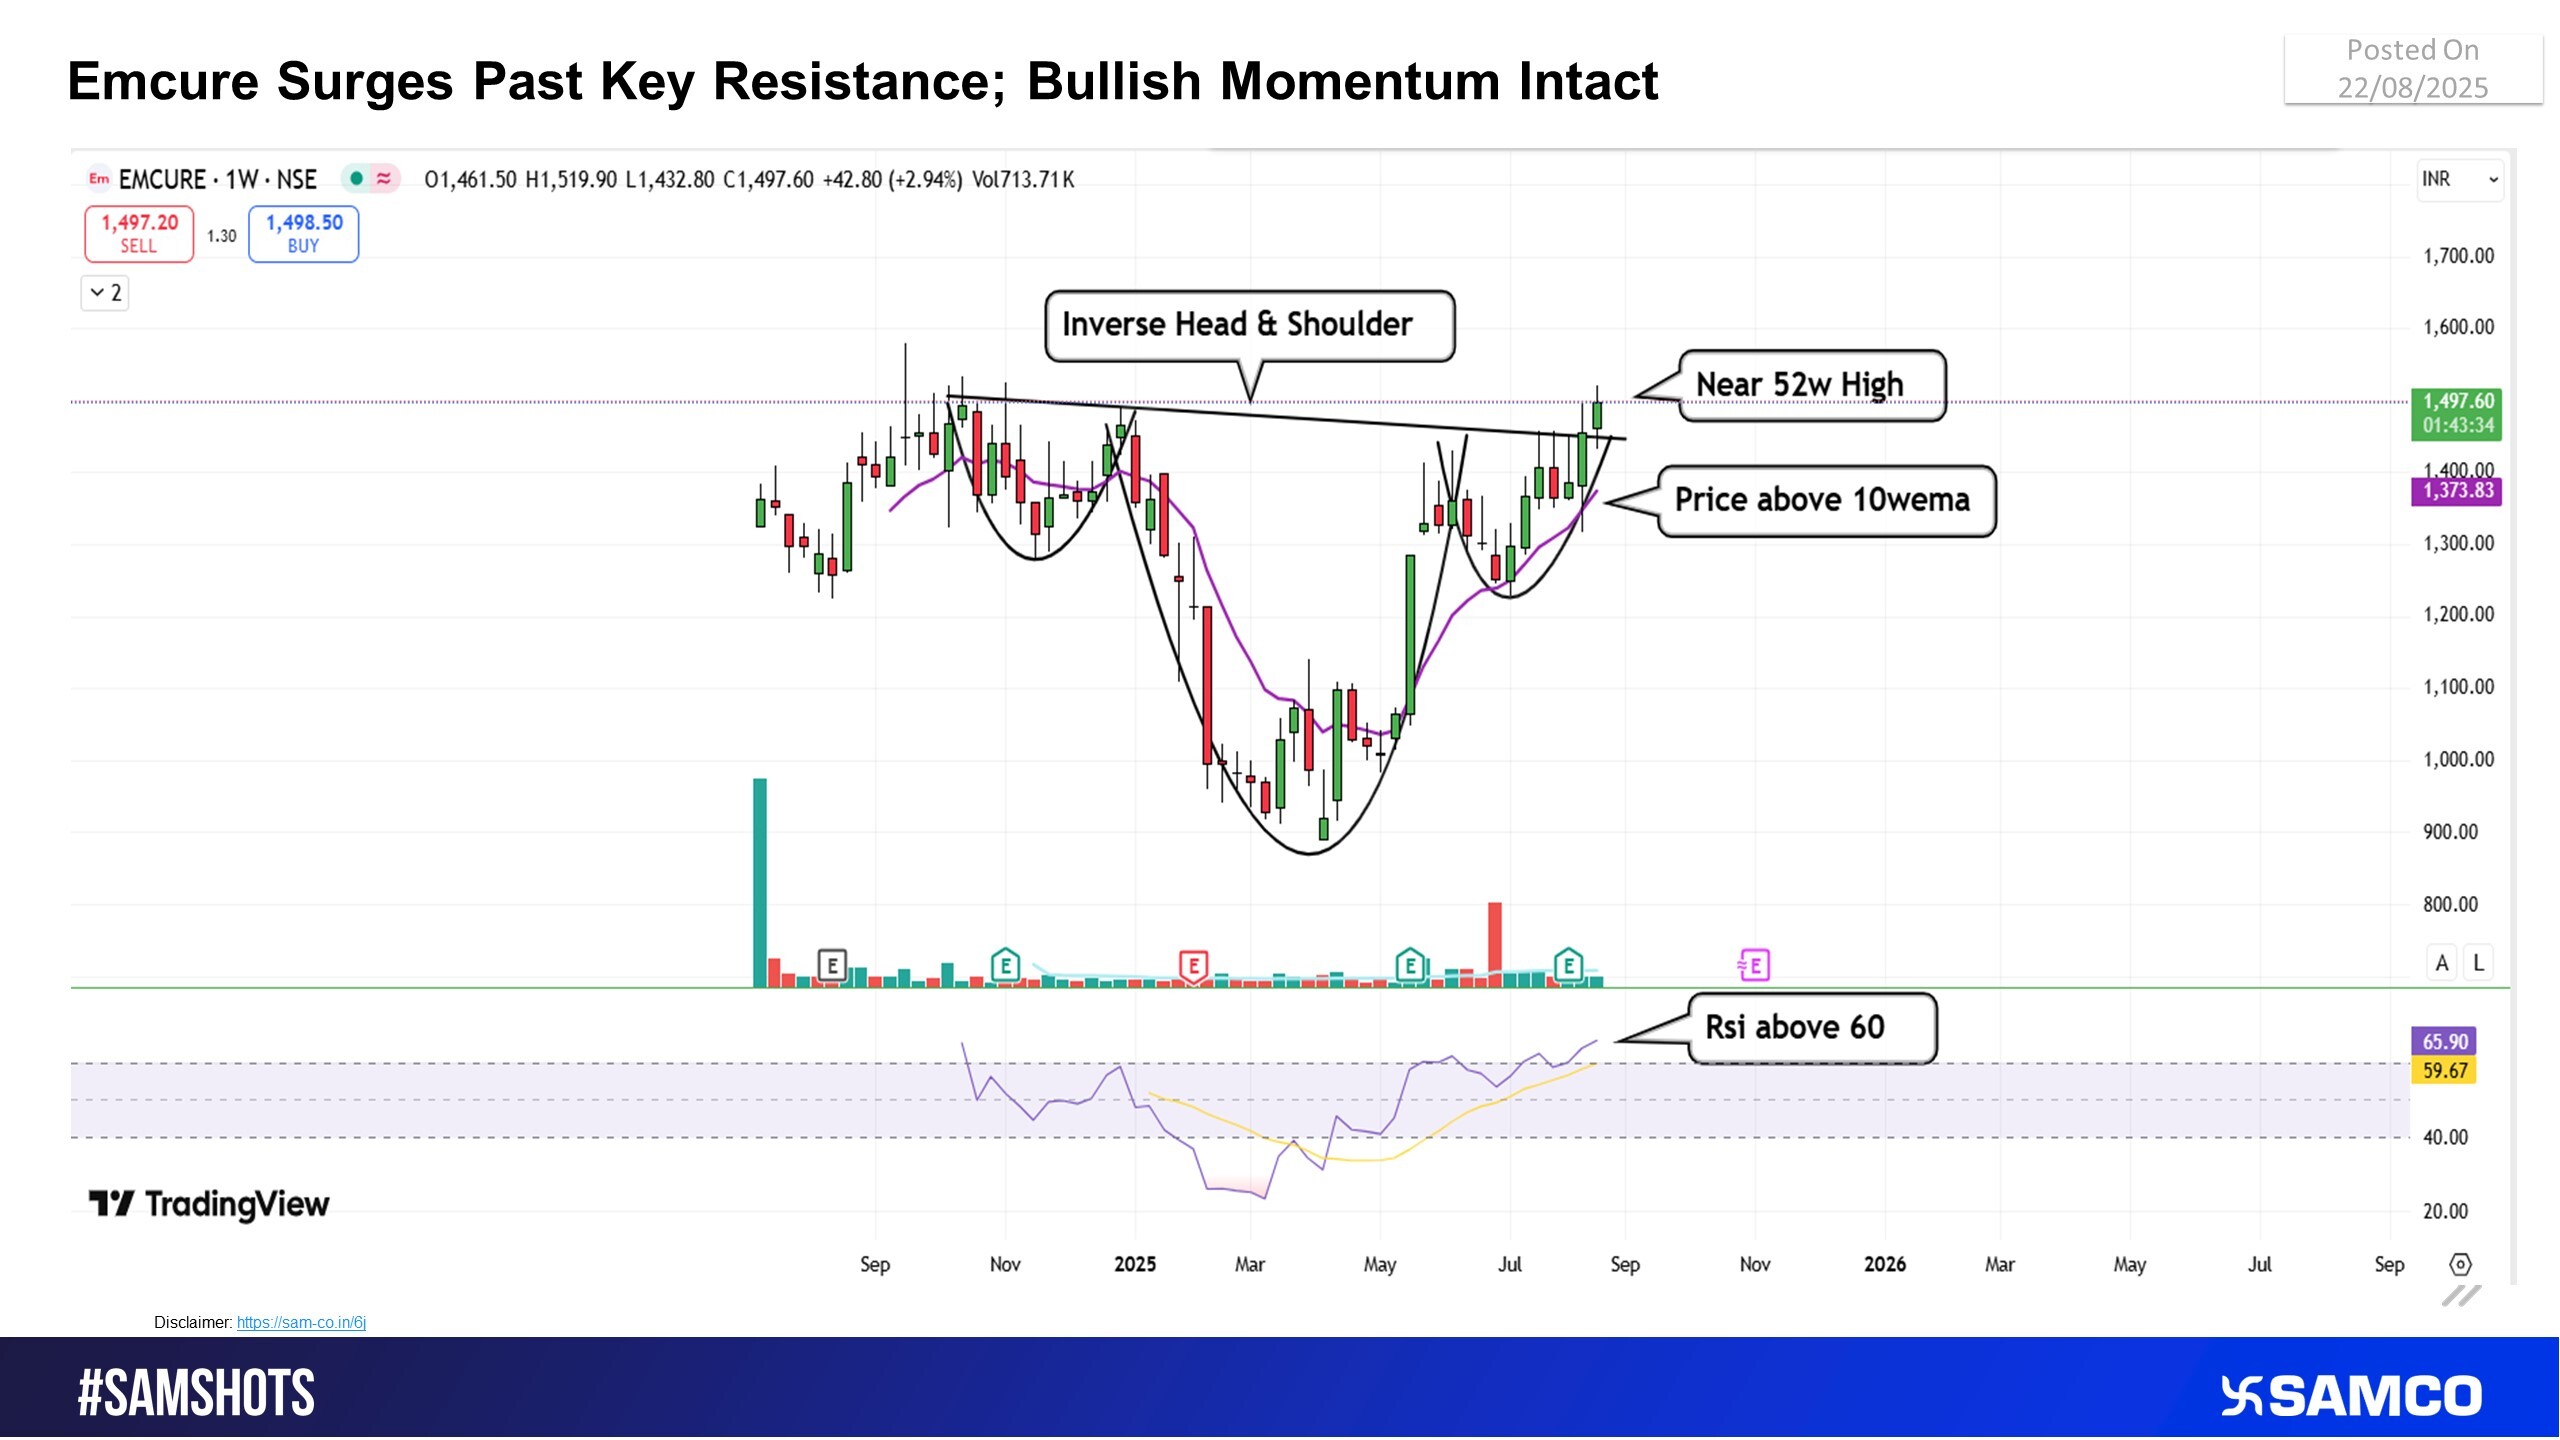
Image Source: https://www.visualcapitalist.com/global-crude-oil-trade-flows-2024/
 Easy & quick
1. Register on SCORES portal
2. Mandatory details for filling complaints on SCORES
Name | PAN | Address | Mobile | Number | E-mail ID
3. Benefits
Effective Communication
Speedy redressal of the grievances
