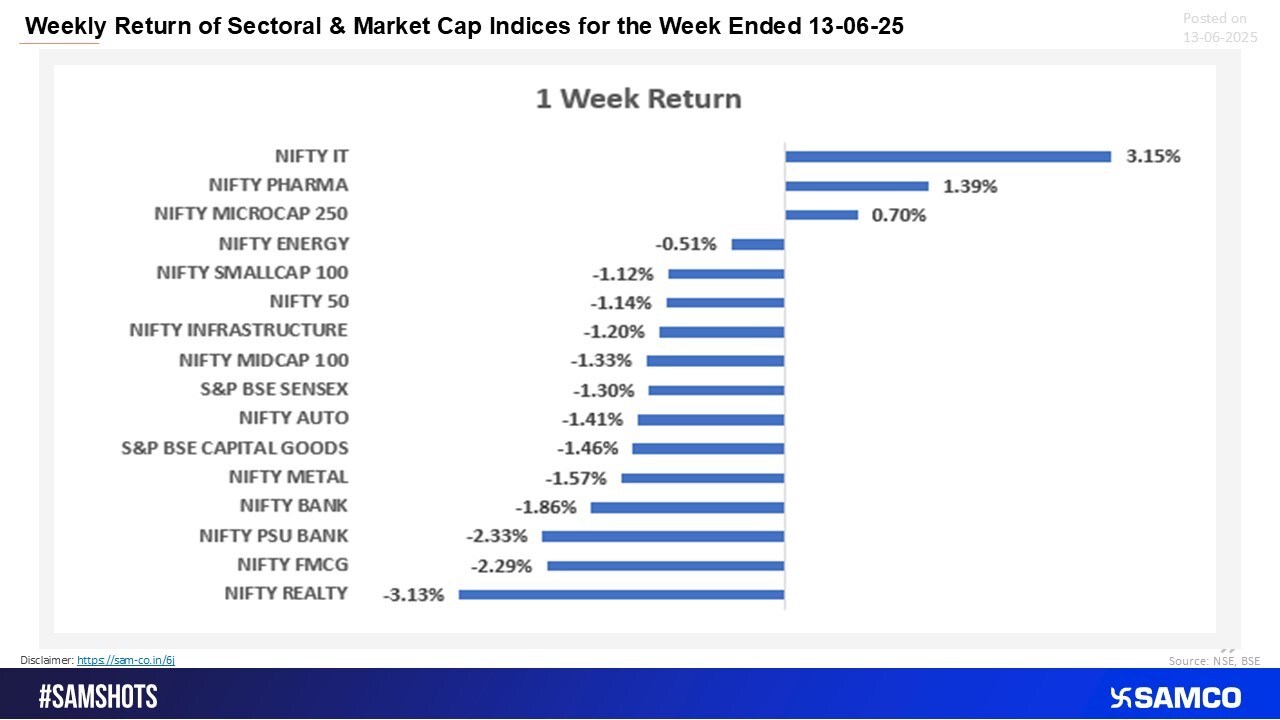
The equity markets witnessed range-bound activity in the first three sessions of the week before a sharp decline pulled benchmark indices lower. The Nifty 50 ended the week with a loss of 1.14%. Among sectoral indices, Nifty IT outperformed, gaining 3.15%, while Nifty Realty declined the most, falling 3.13%.
In the commodities space, gold prices surged 3%, reflecting heightened investor interest in safe-haven assets amid market volatility and uncertainty.
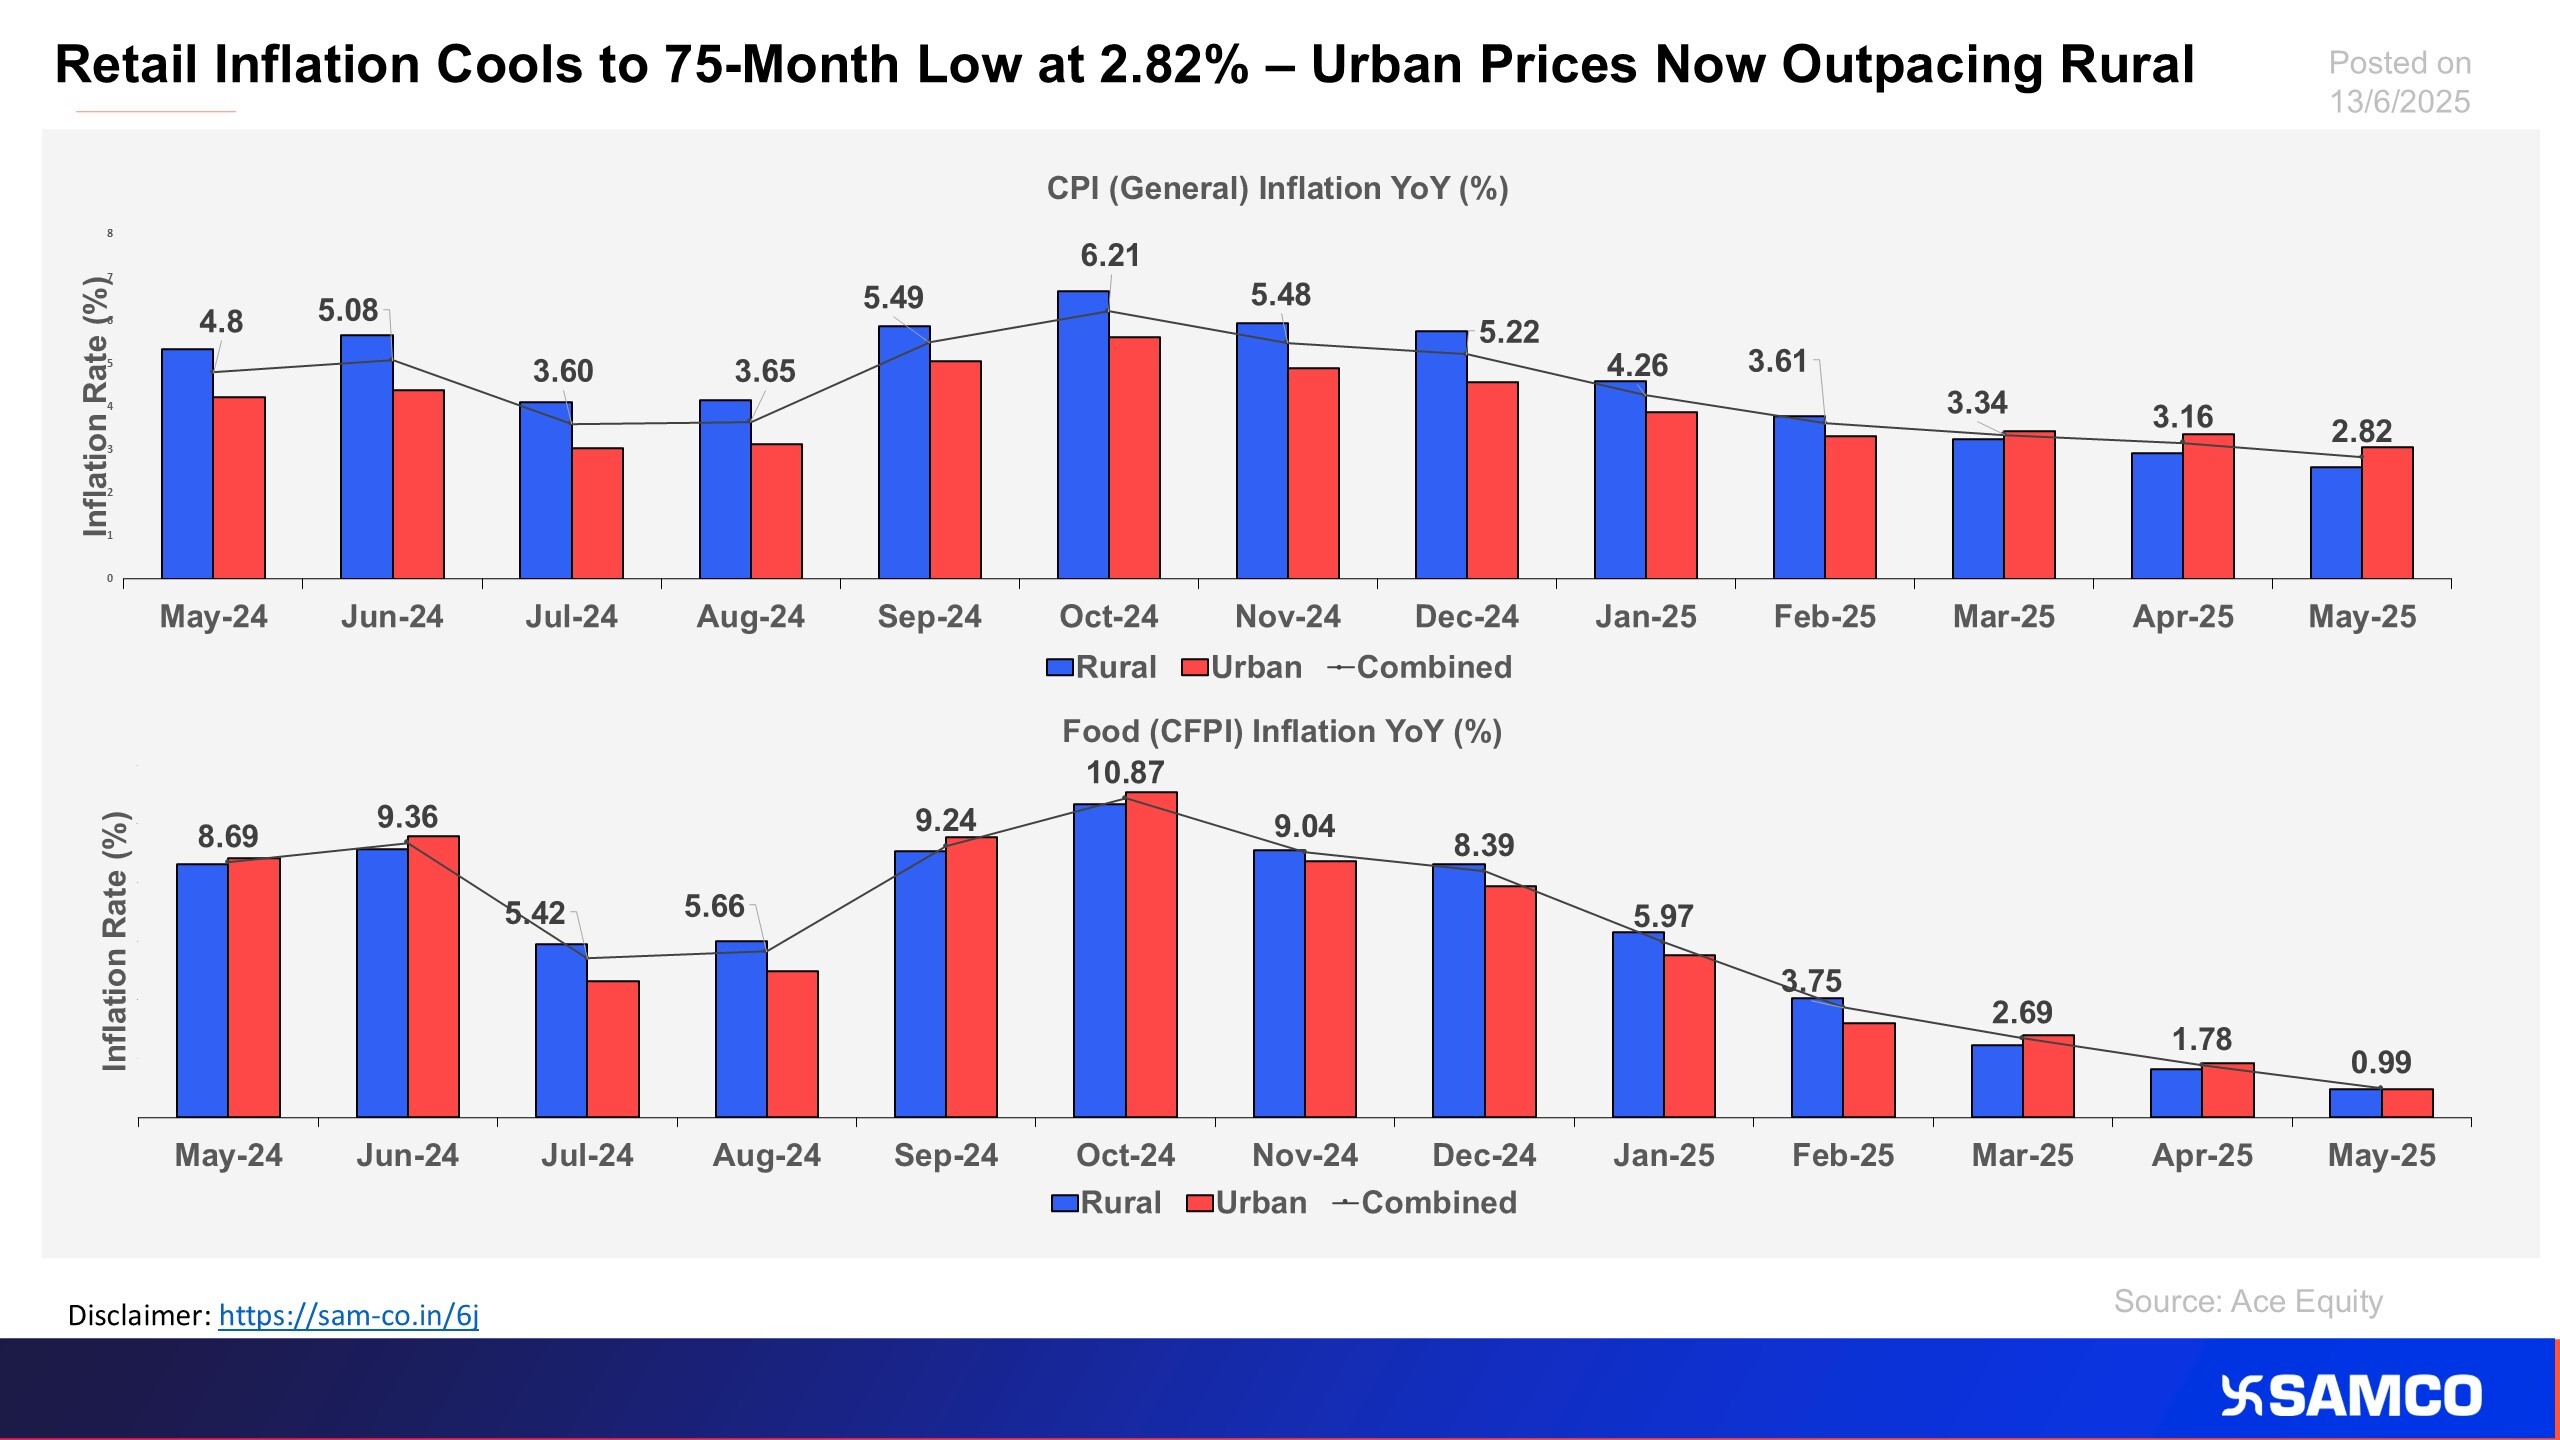
On the macro front, India's Consumer Price Index (CPI) for May 2025 stood at 2.82% YoY (provisional), easing from 3.16% in April and marking a 75-month low. Notably, urban inflation (3.07%) continued to outpace rural inflation (2.59%), a trend that began in March 2025.
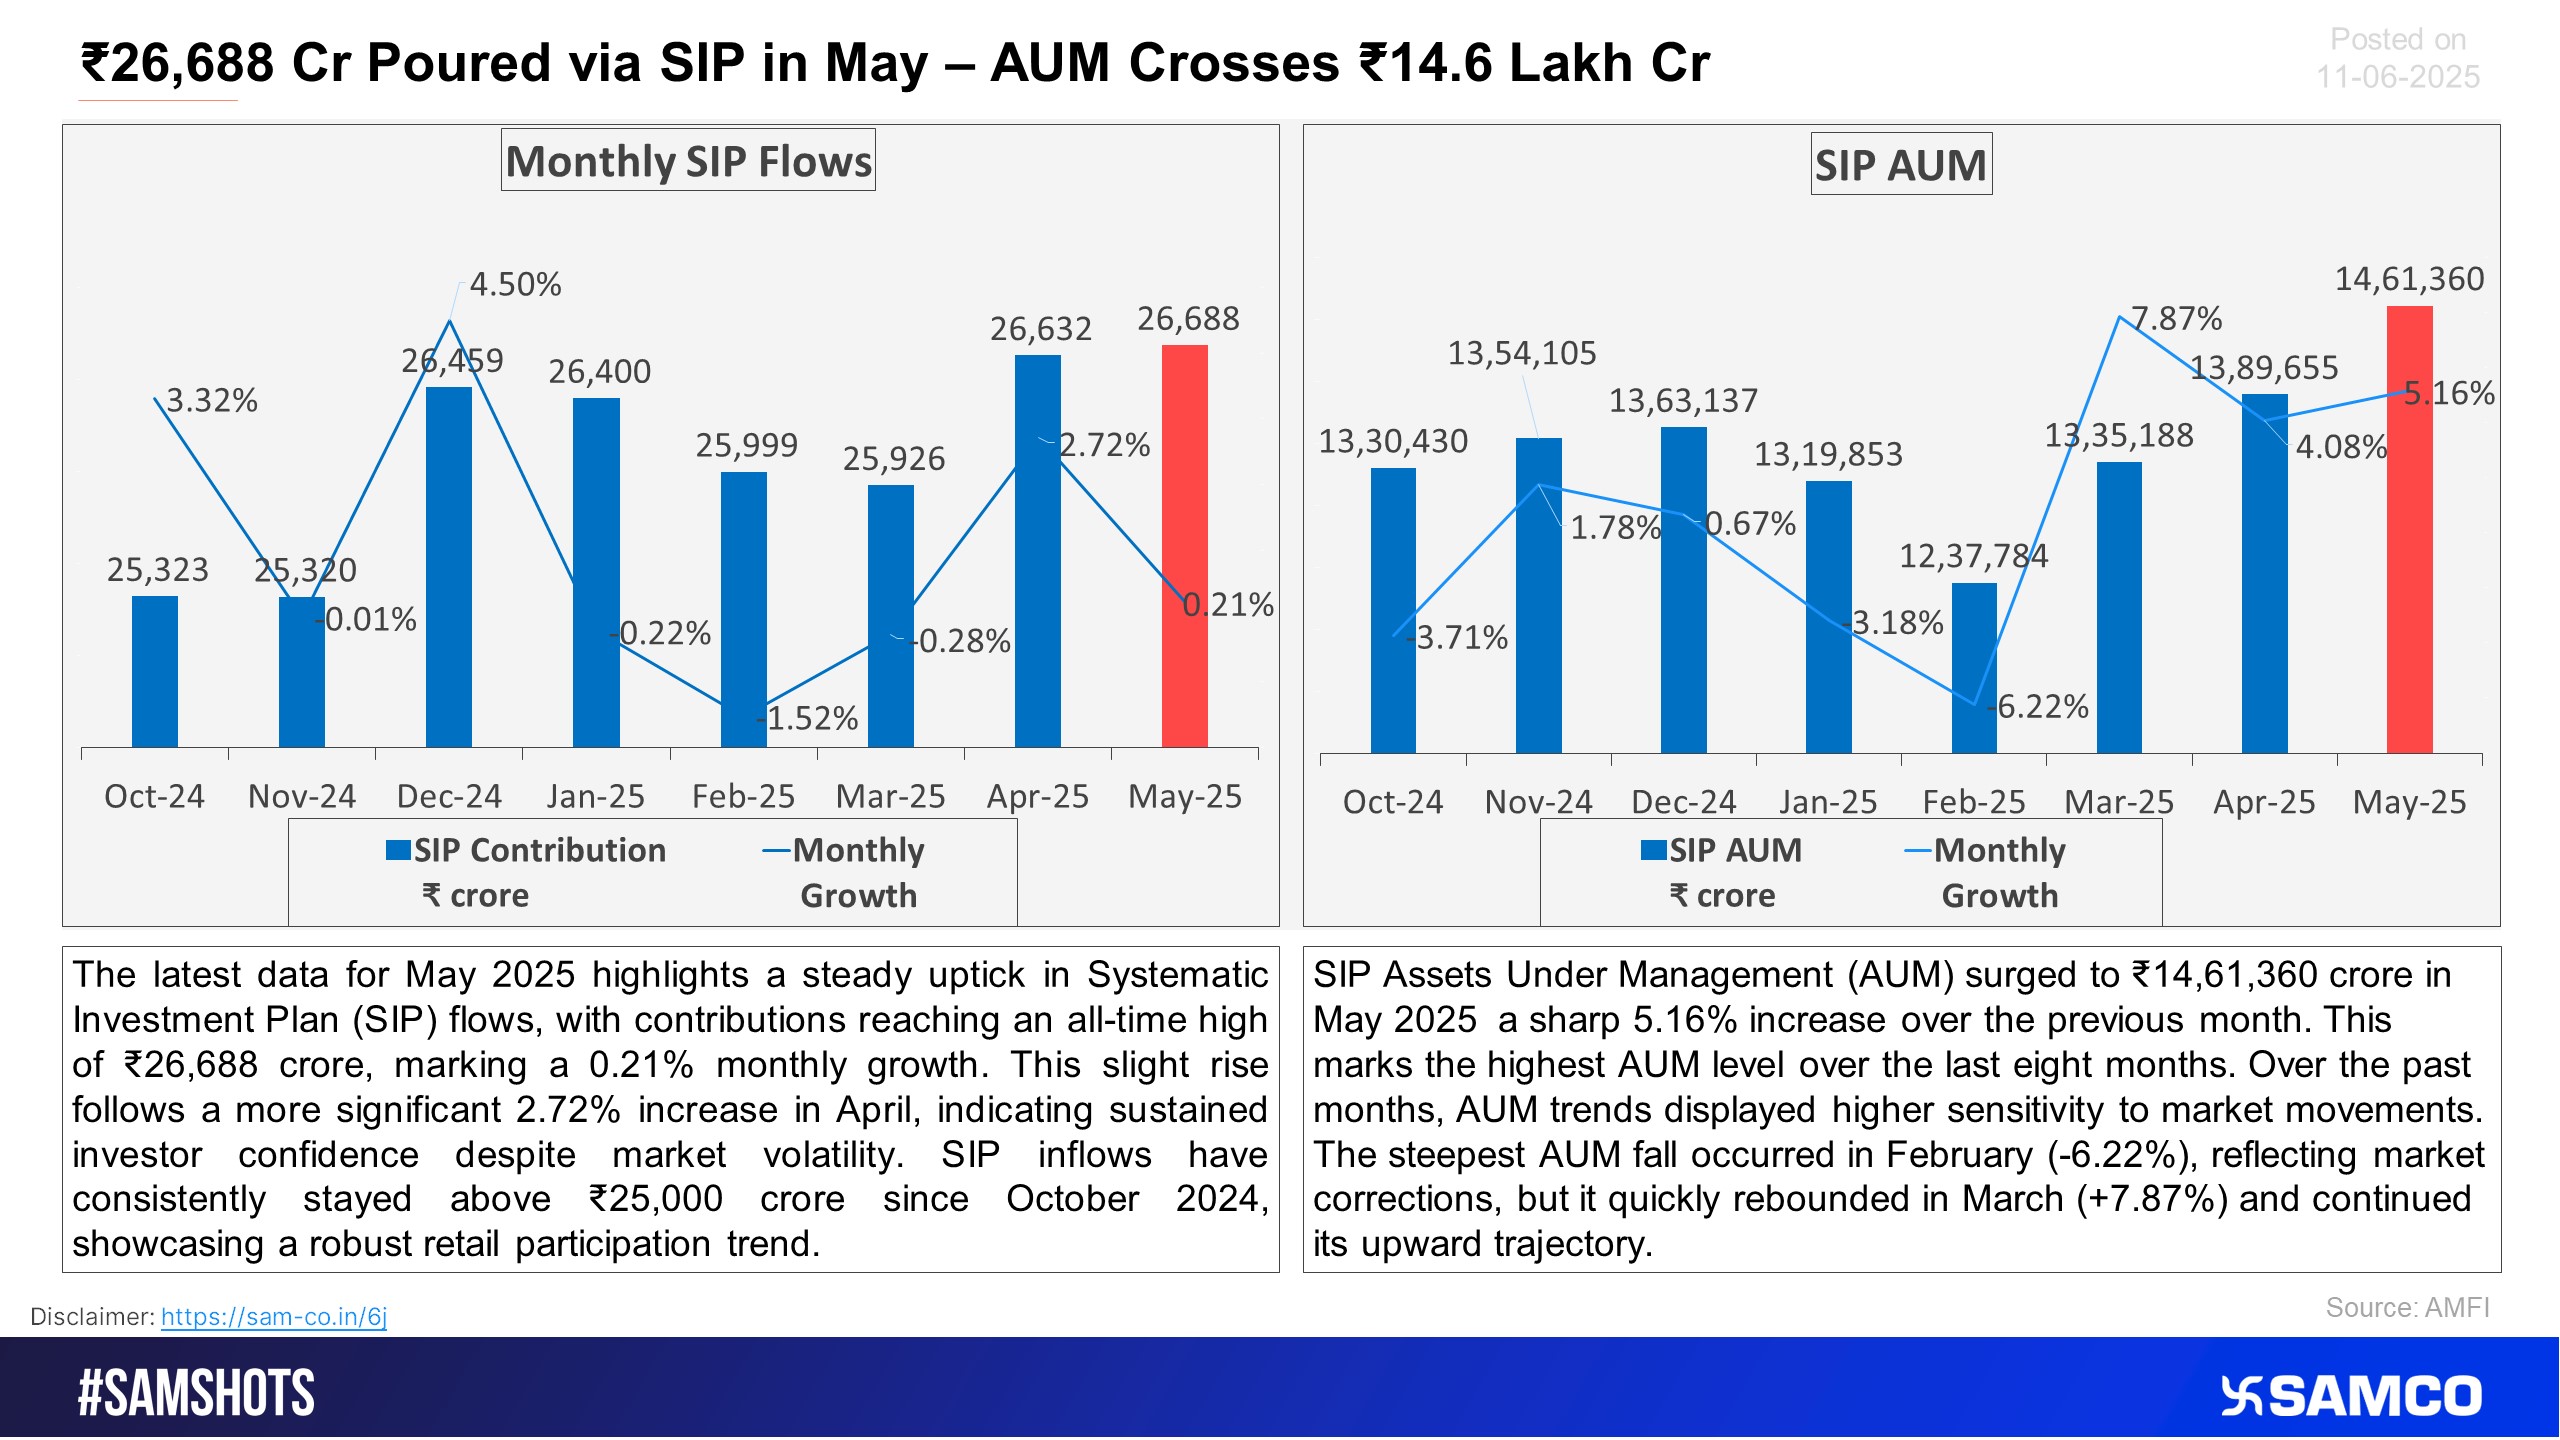
Meanwhile, SIP inflows touched a record ?26,688 crore in May 2025, registering a 0.21% monthly increase. SIP AUM rose to ?14.61 lakh crore, reaffirming strong retail investor participation through mutual fund routes.
Scroll down to understand more of such market news and perspectives for the week gone by in easily understandable charts.
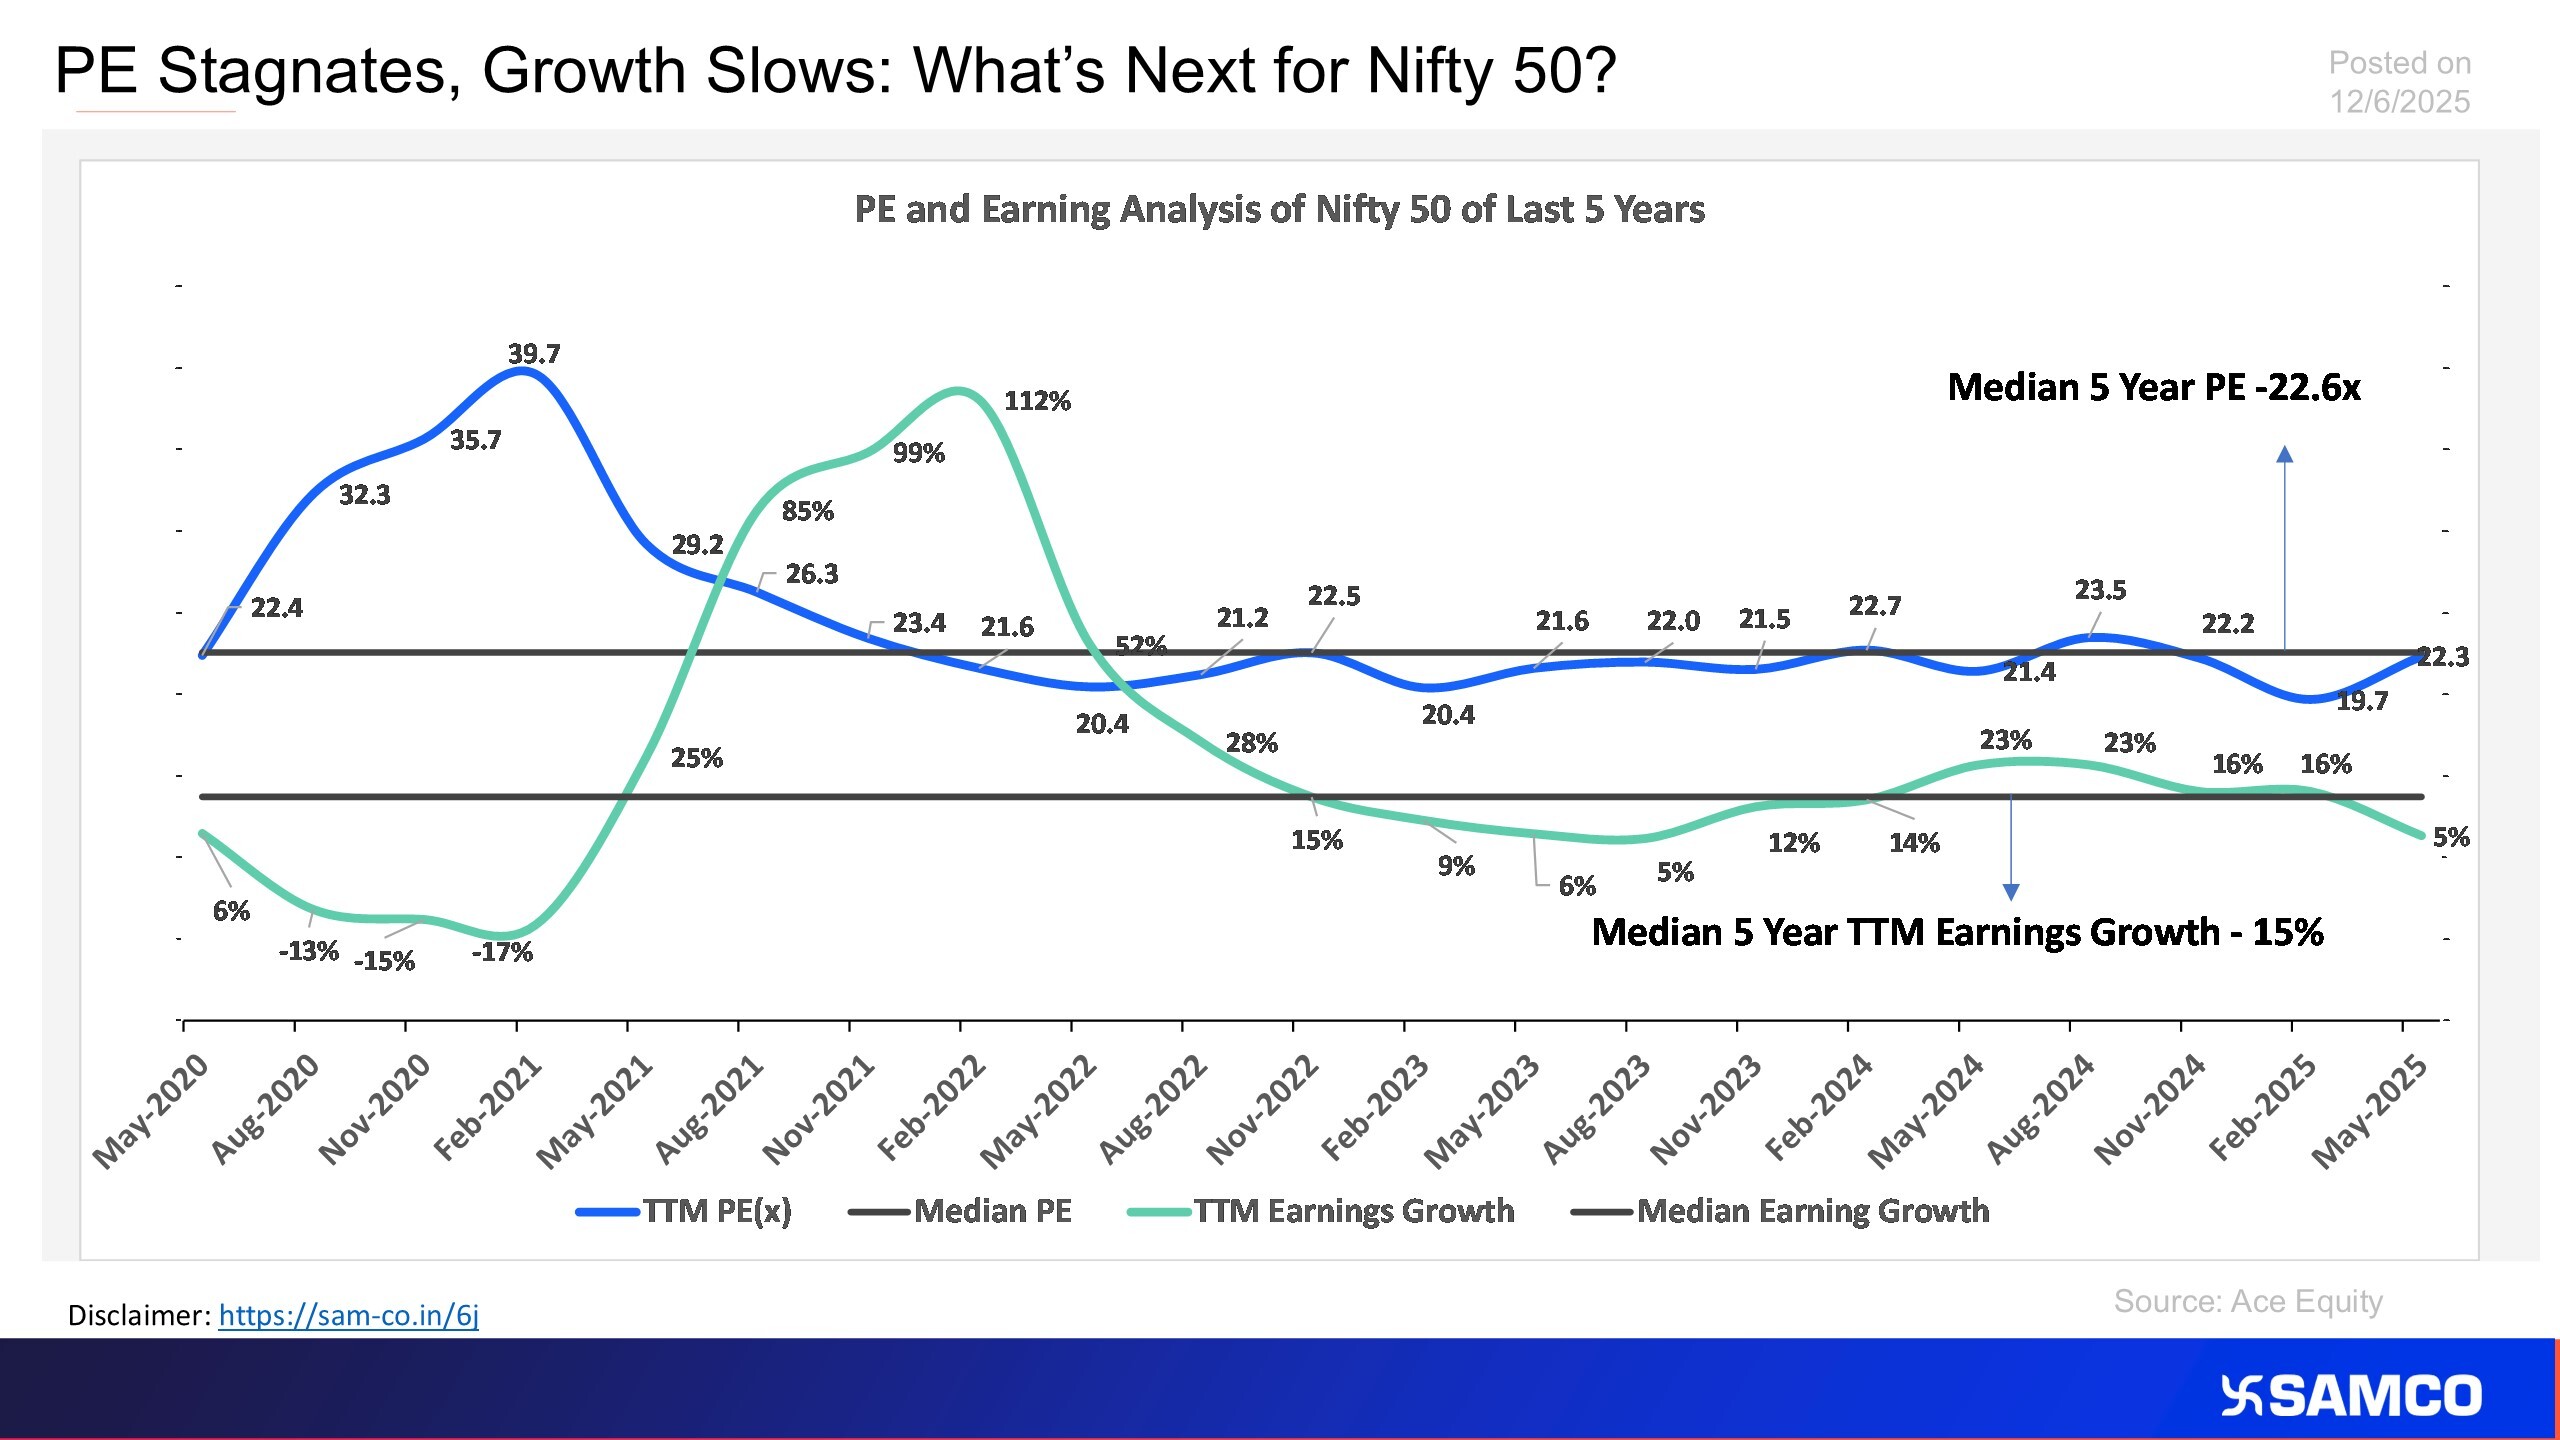
The chart evaluates Nifty 50 Price to Earning Ratio against Nifty 50 earnings growth


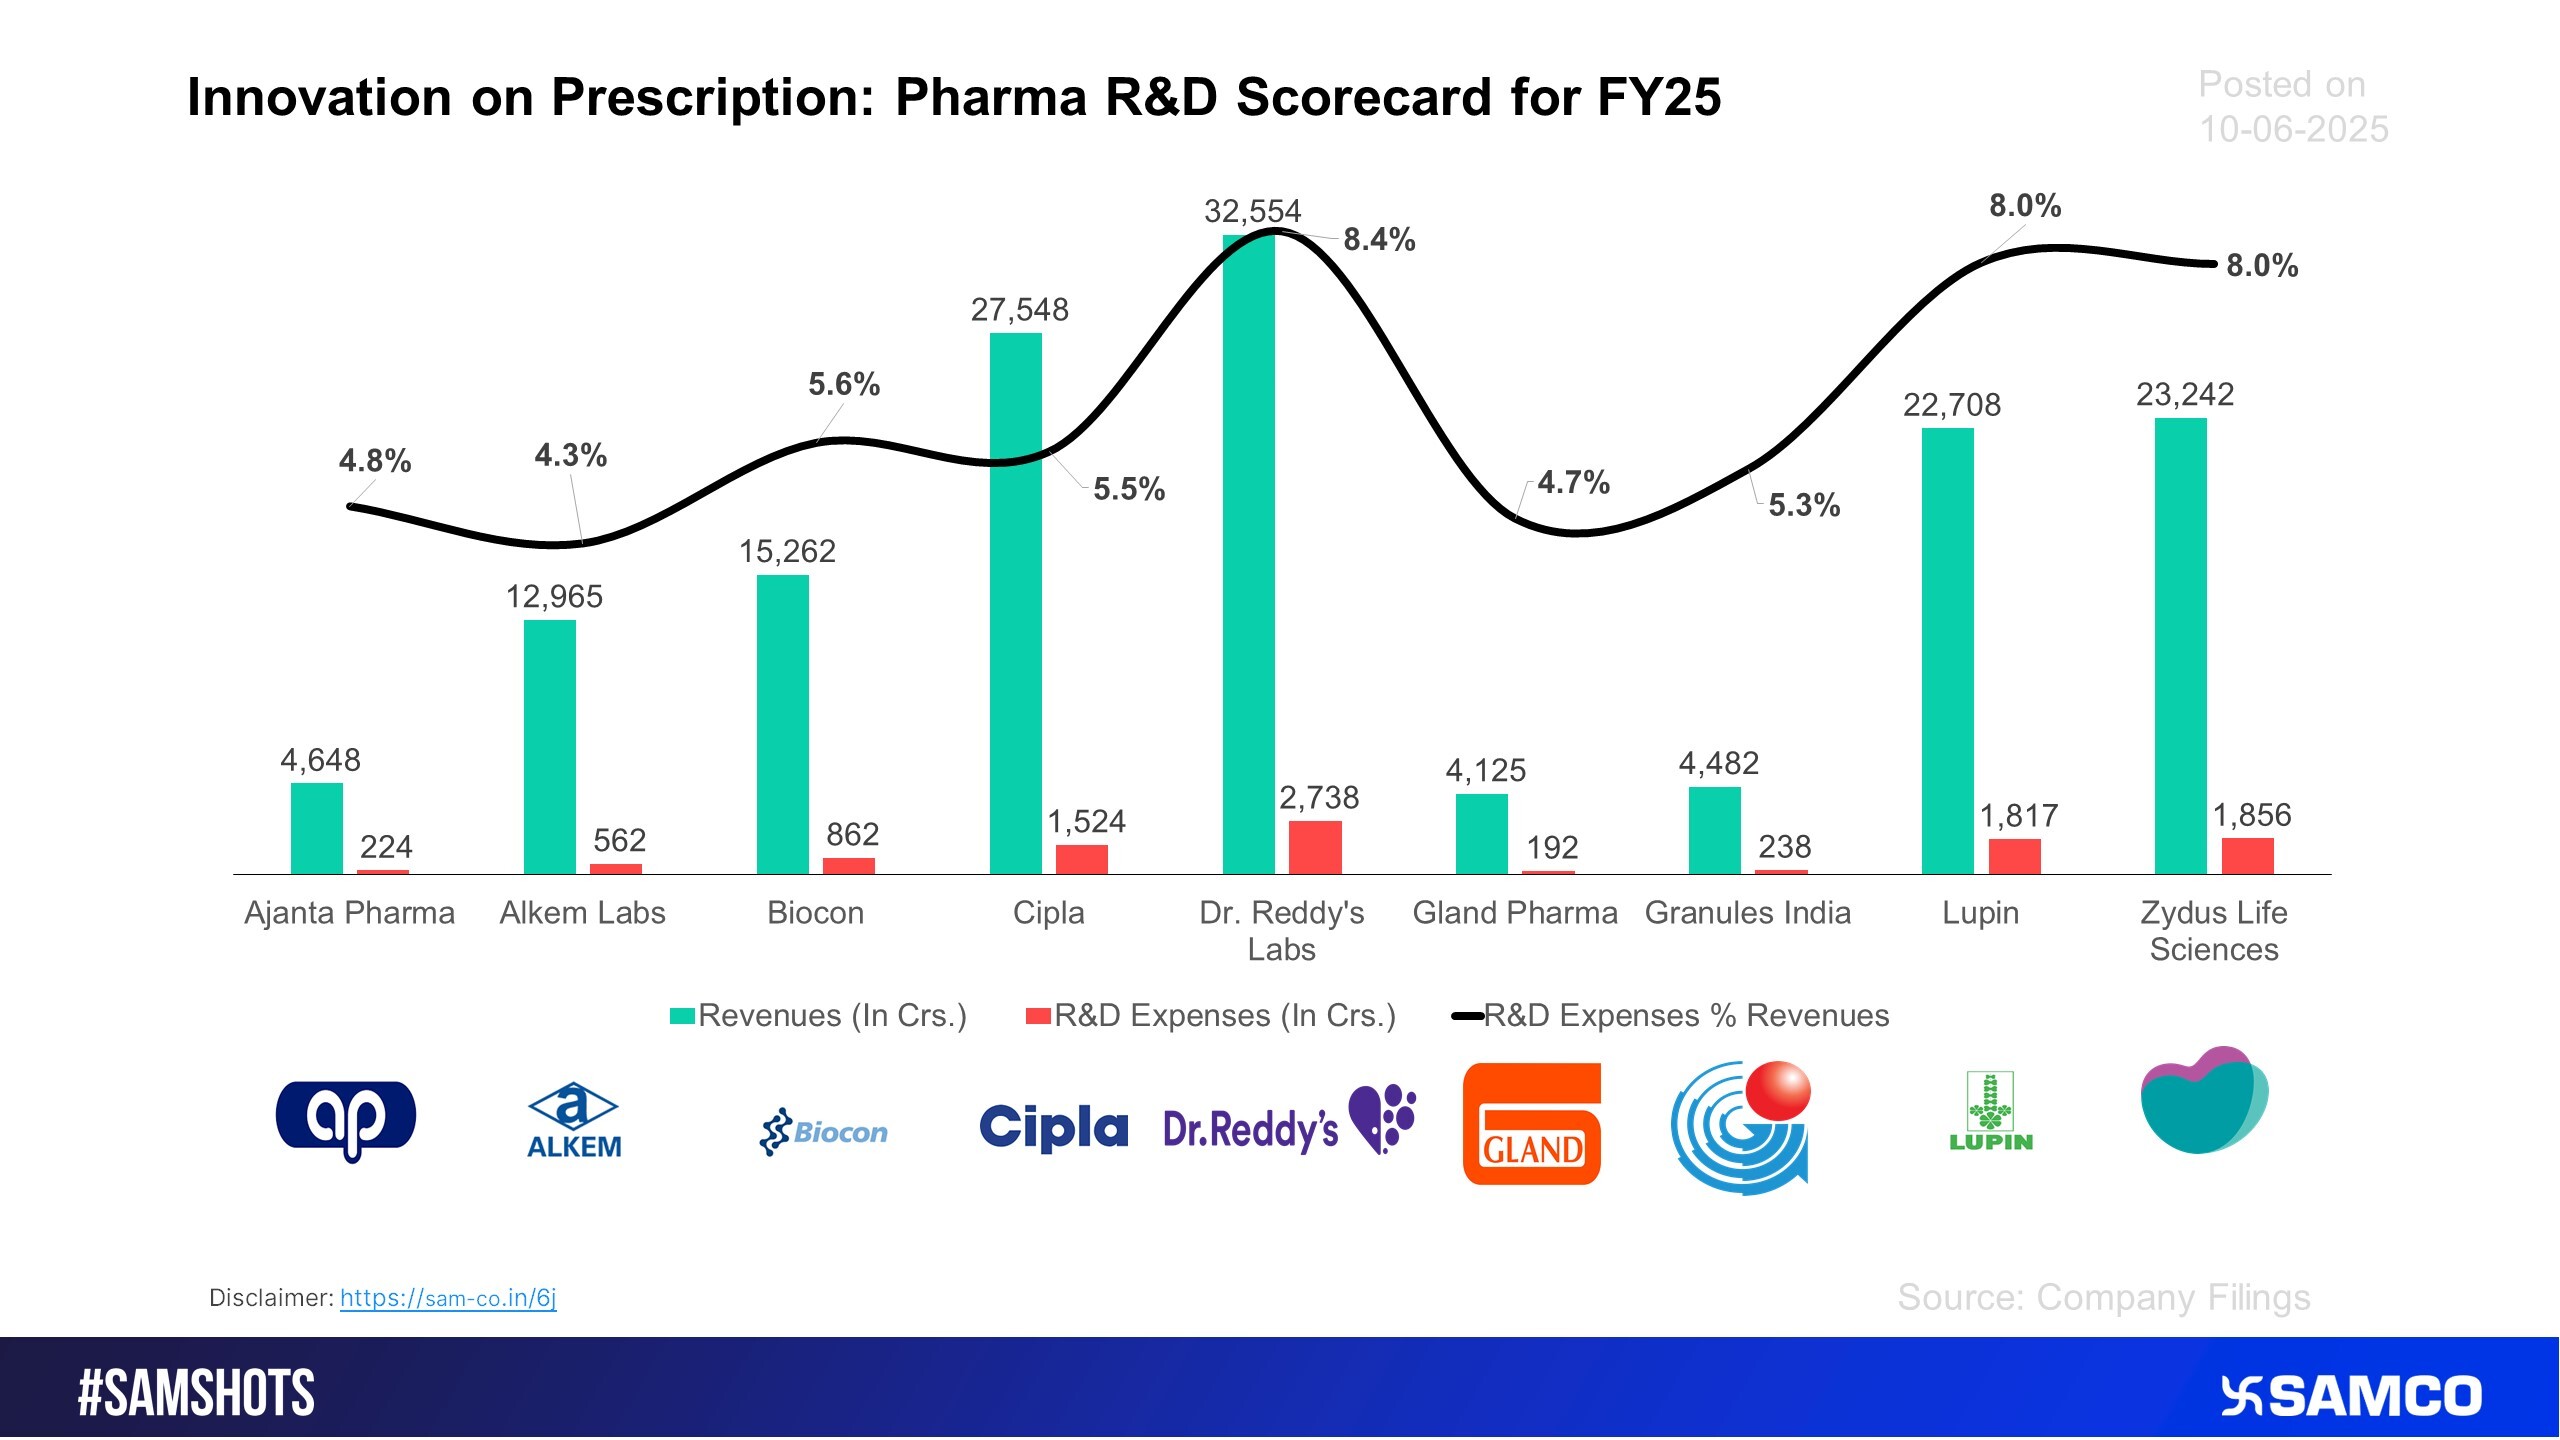
Here’s how the Pharma companies spent on R&D for the FY25.
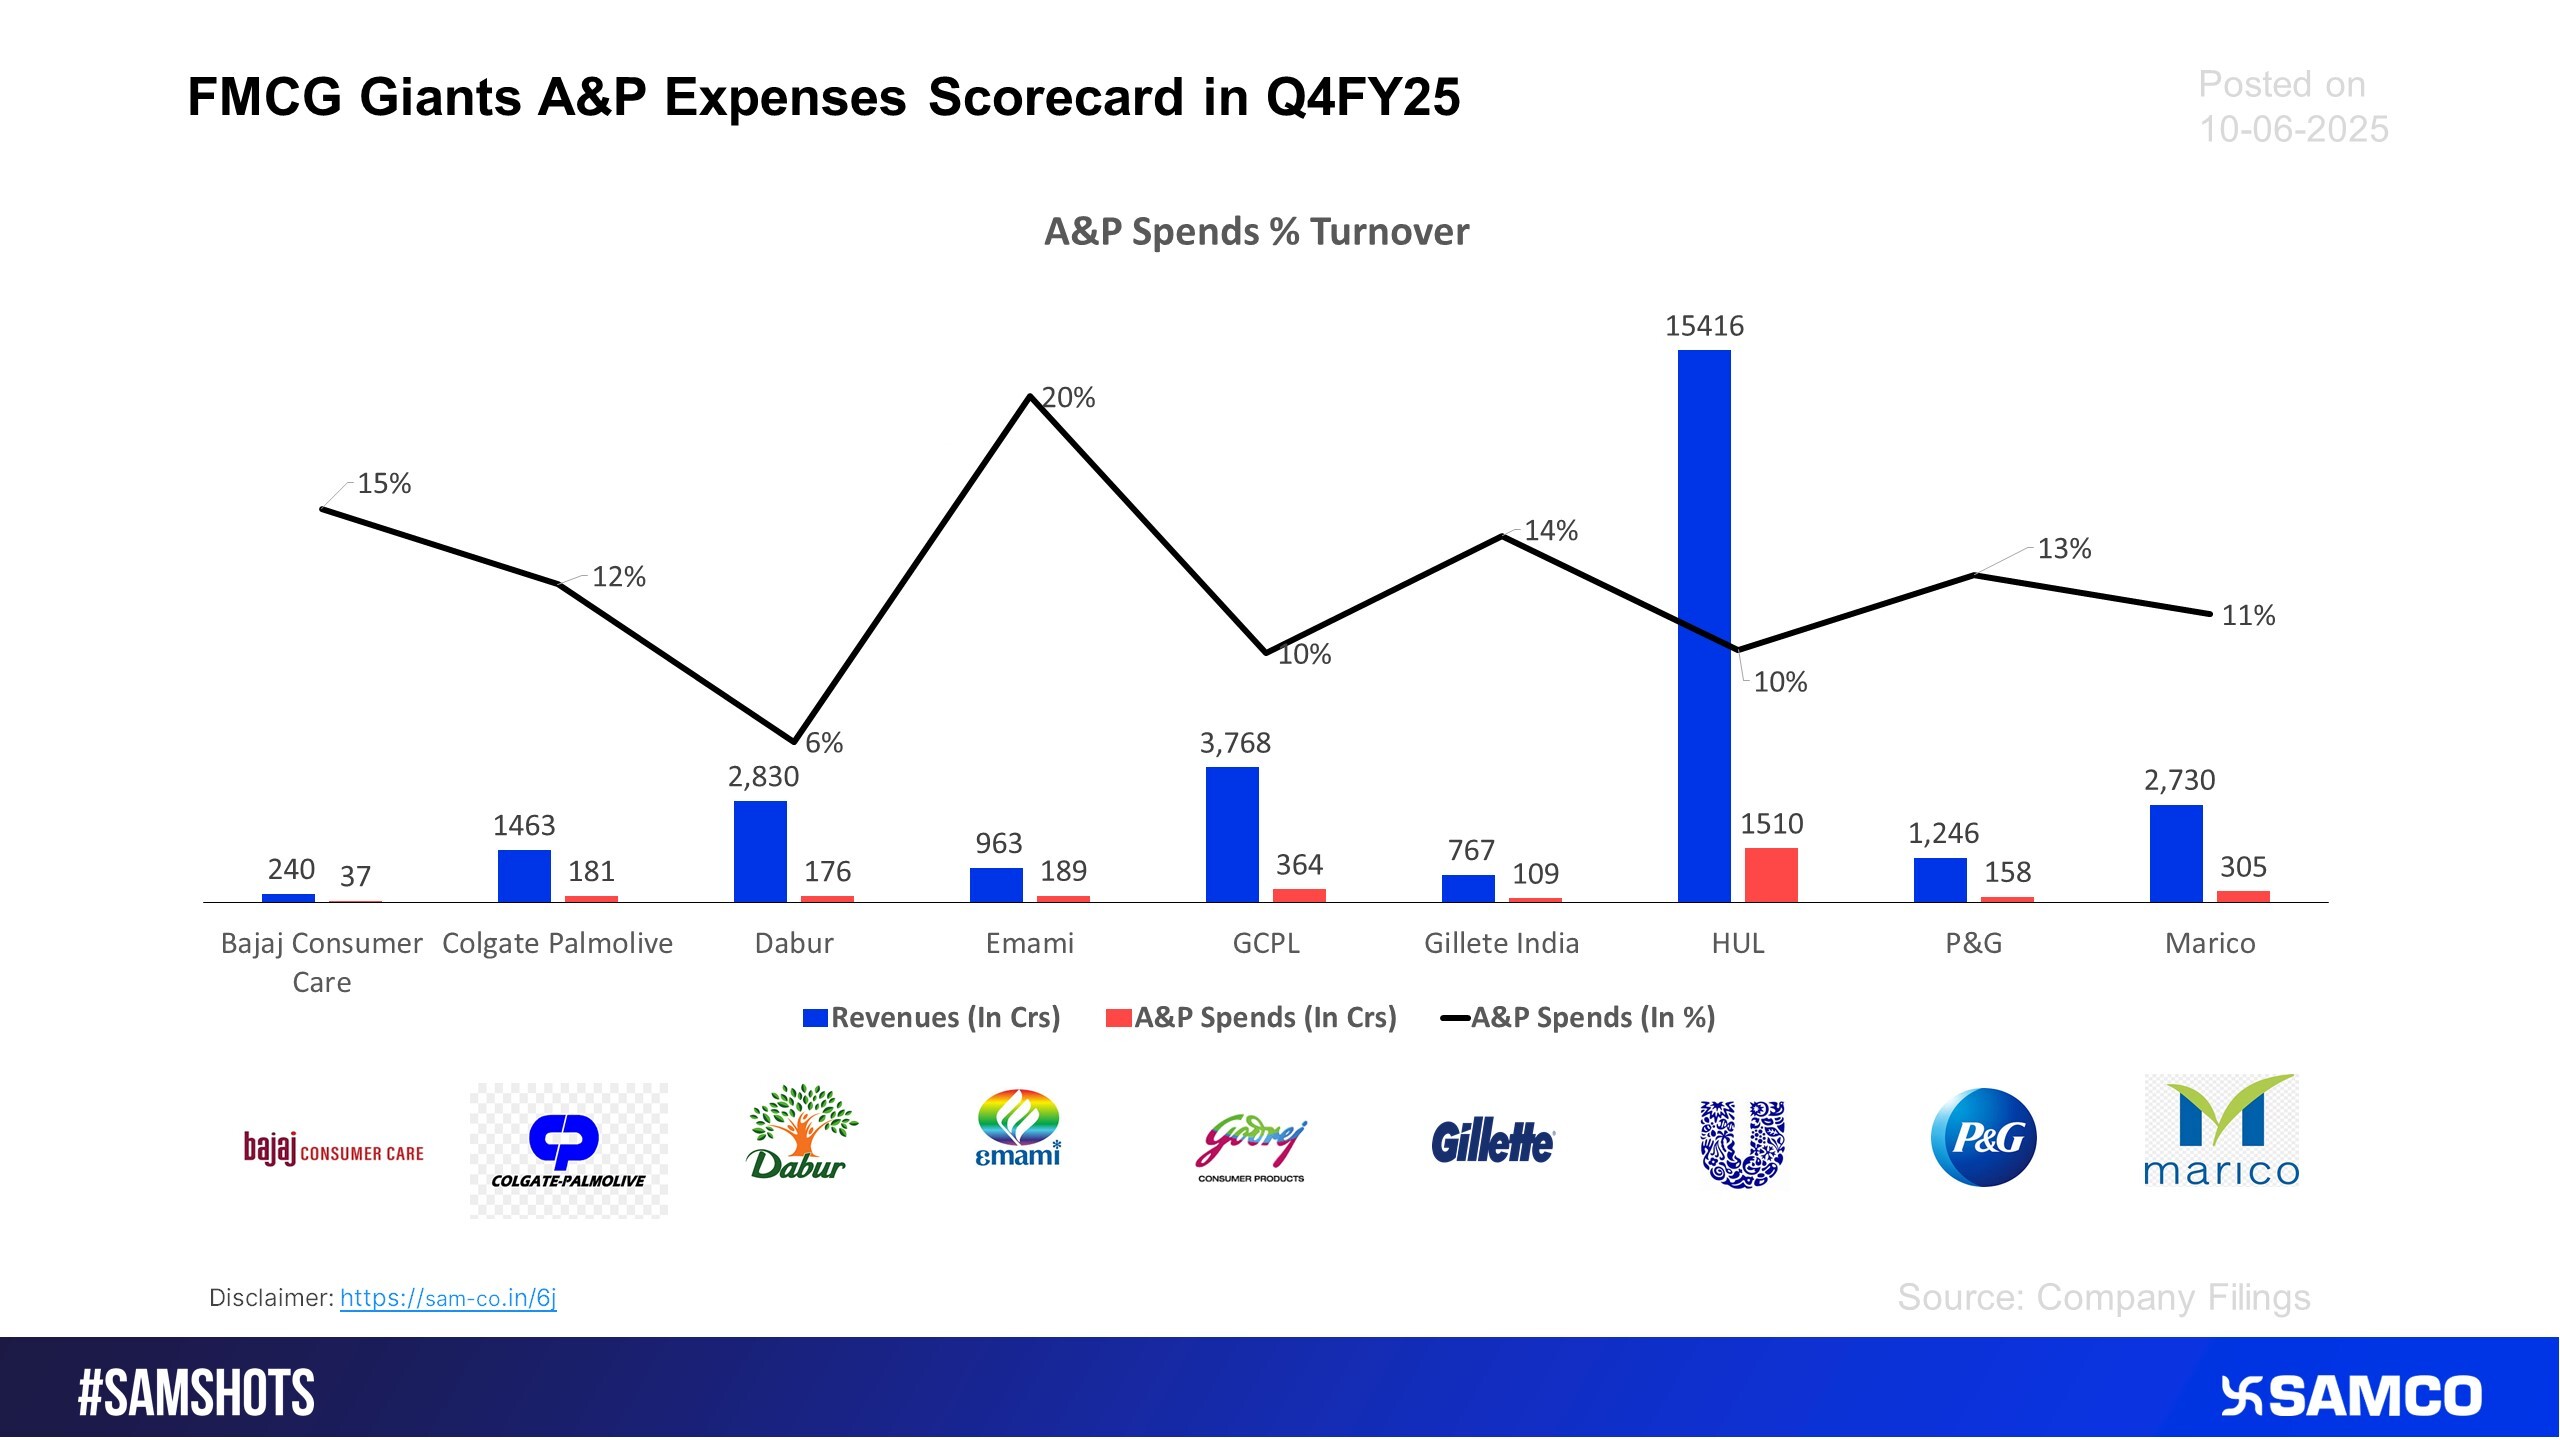
The FMCG giants’ expenditure on Advertisements & Promotions for the quarter ending Mar-25.
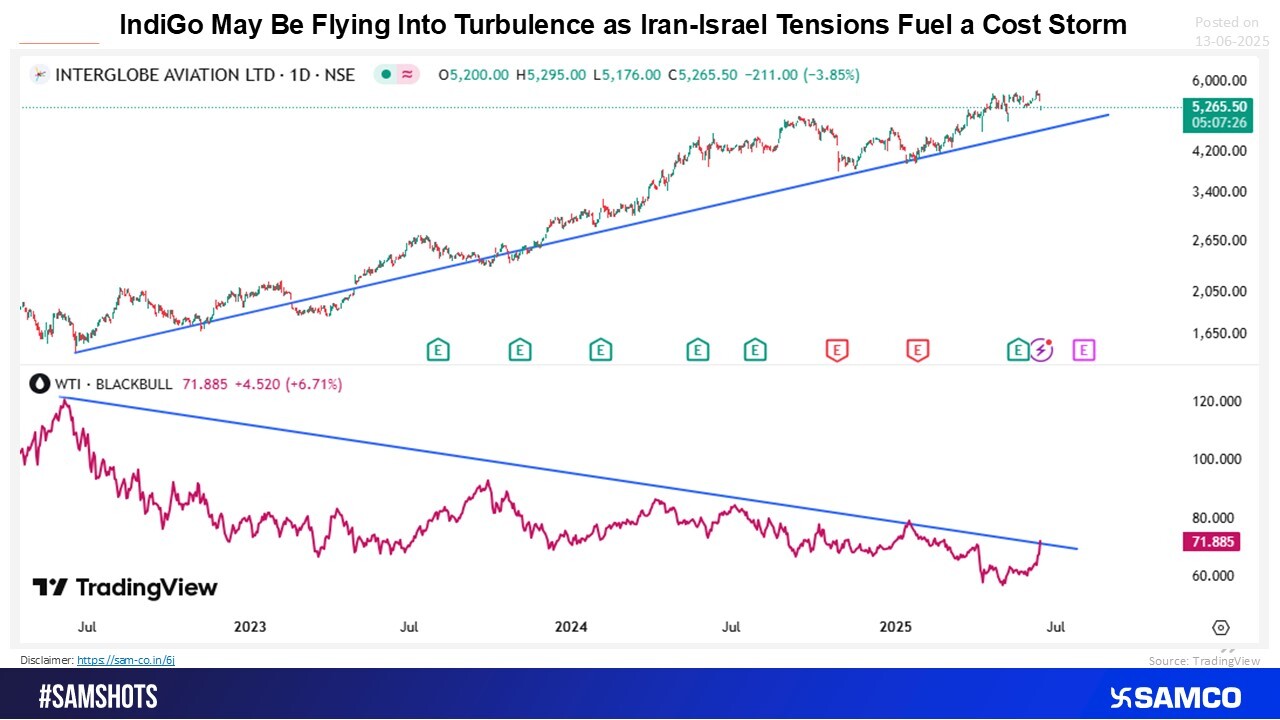
IndiGo faces turbulence ahead amid geopolitical tensions, rising fuel costs, and seasonal weakness—time to fasten seatbelts, not celebrate.
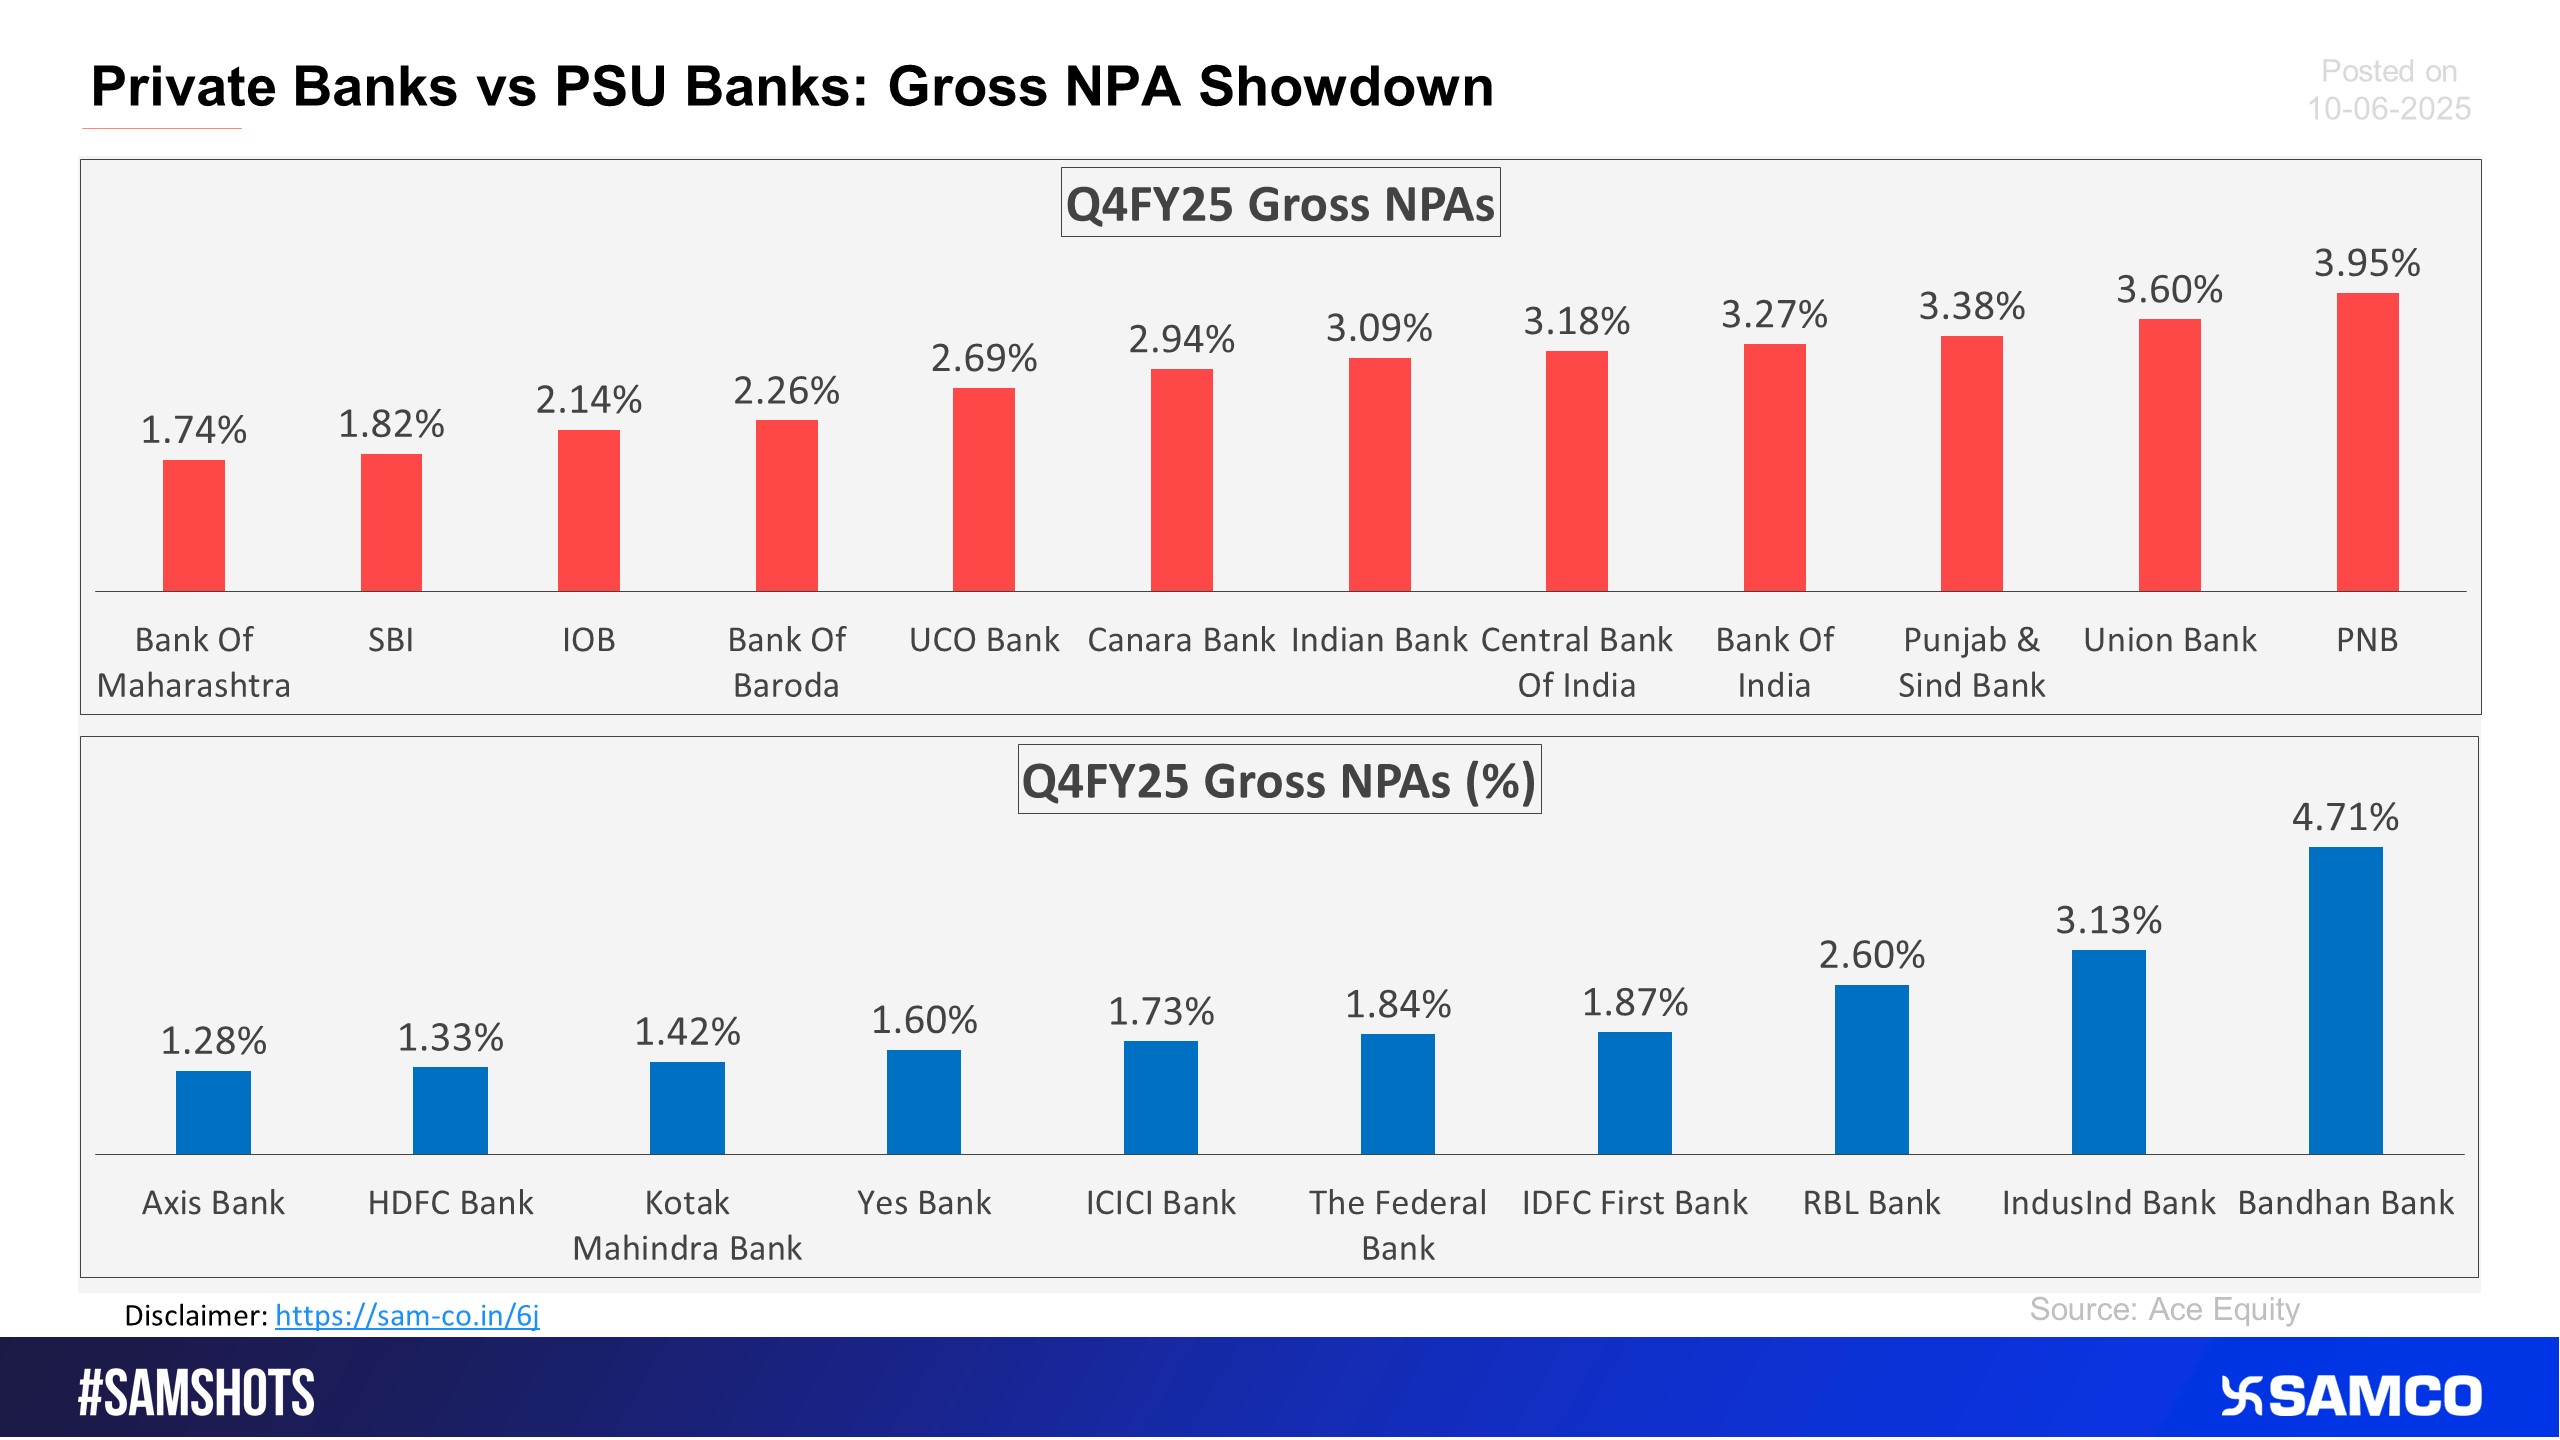
Here’s the NPA comparison of private & public sectoral banks.
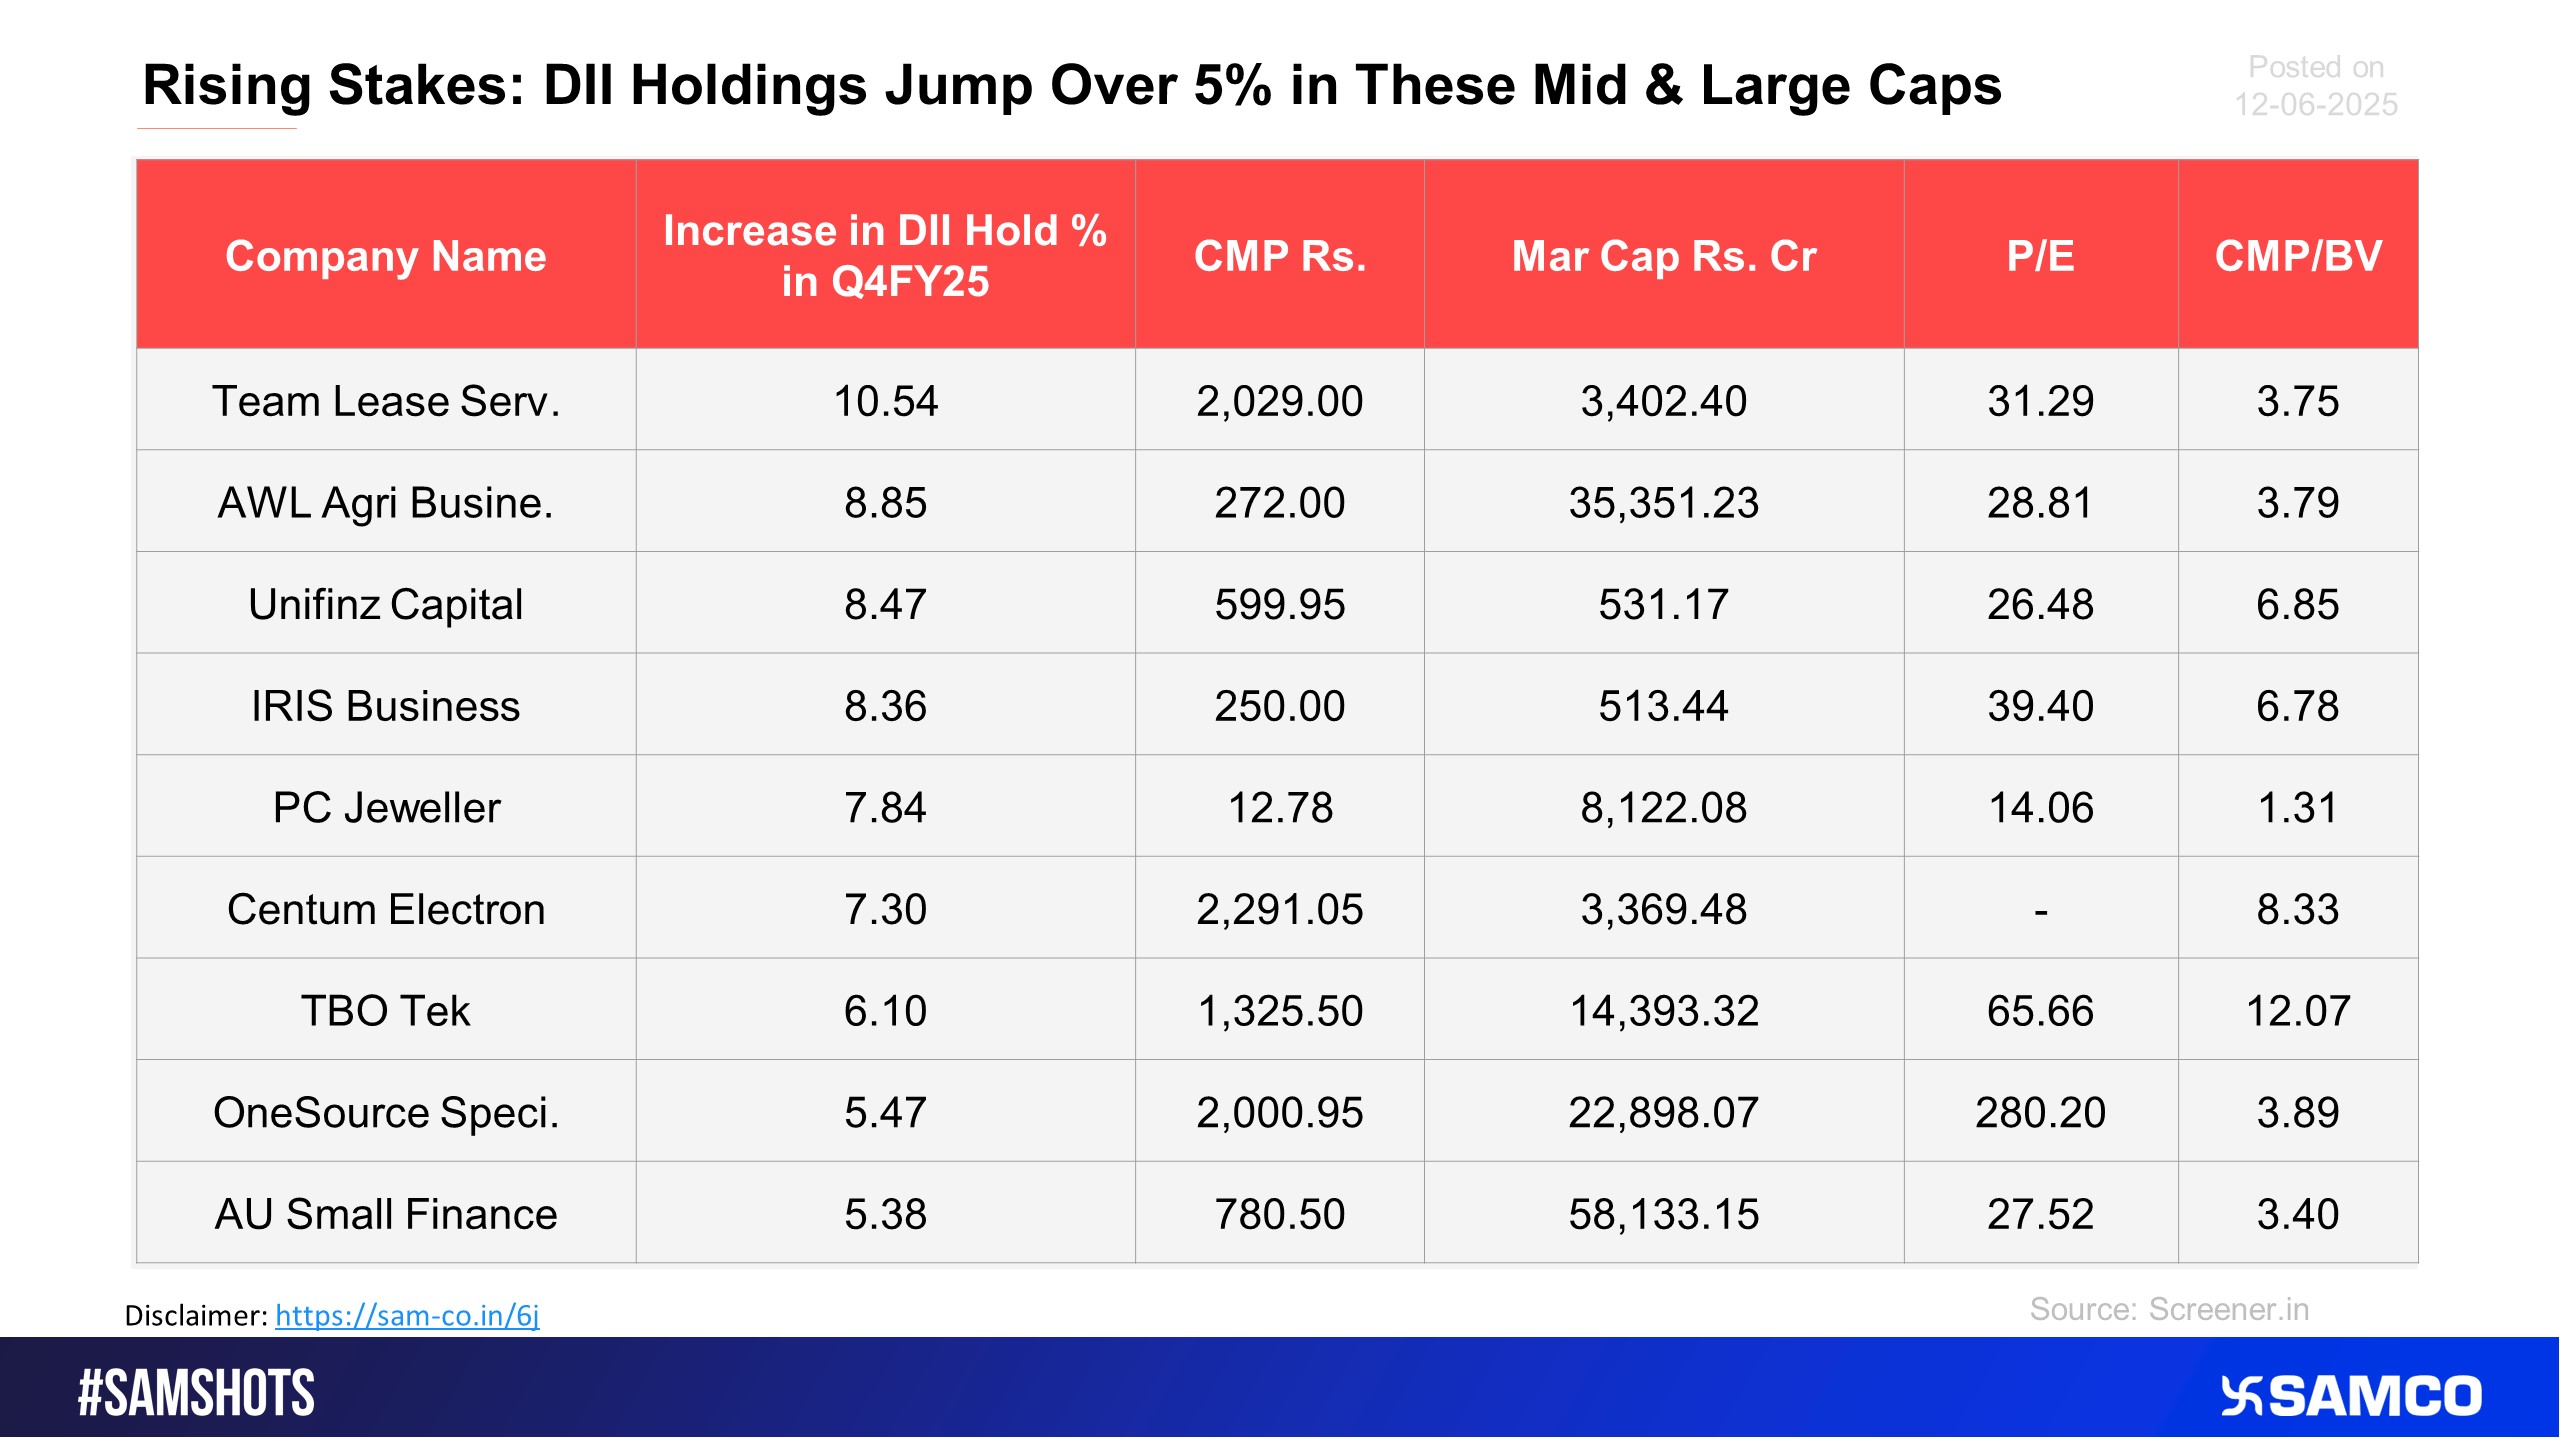
The list shows the companies which witnessed increase in DII holdings over 5% in Q4FY25.
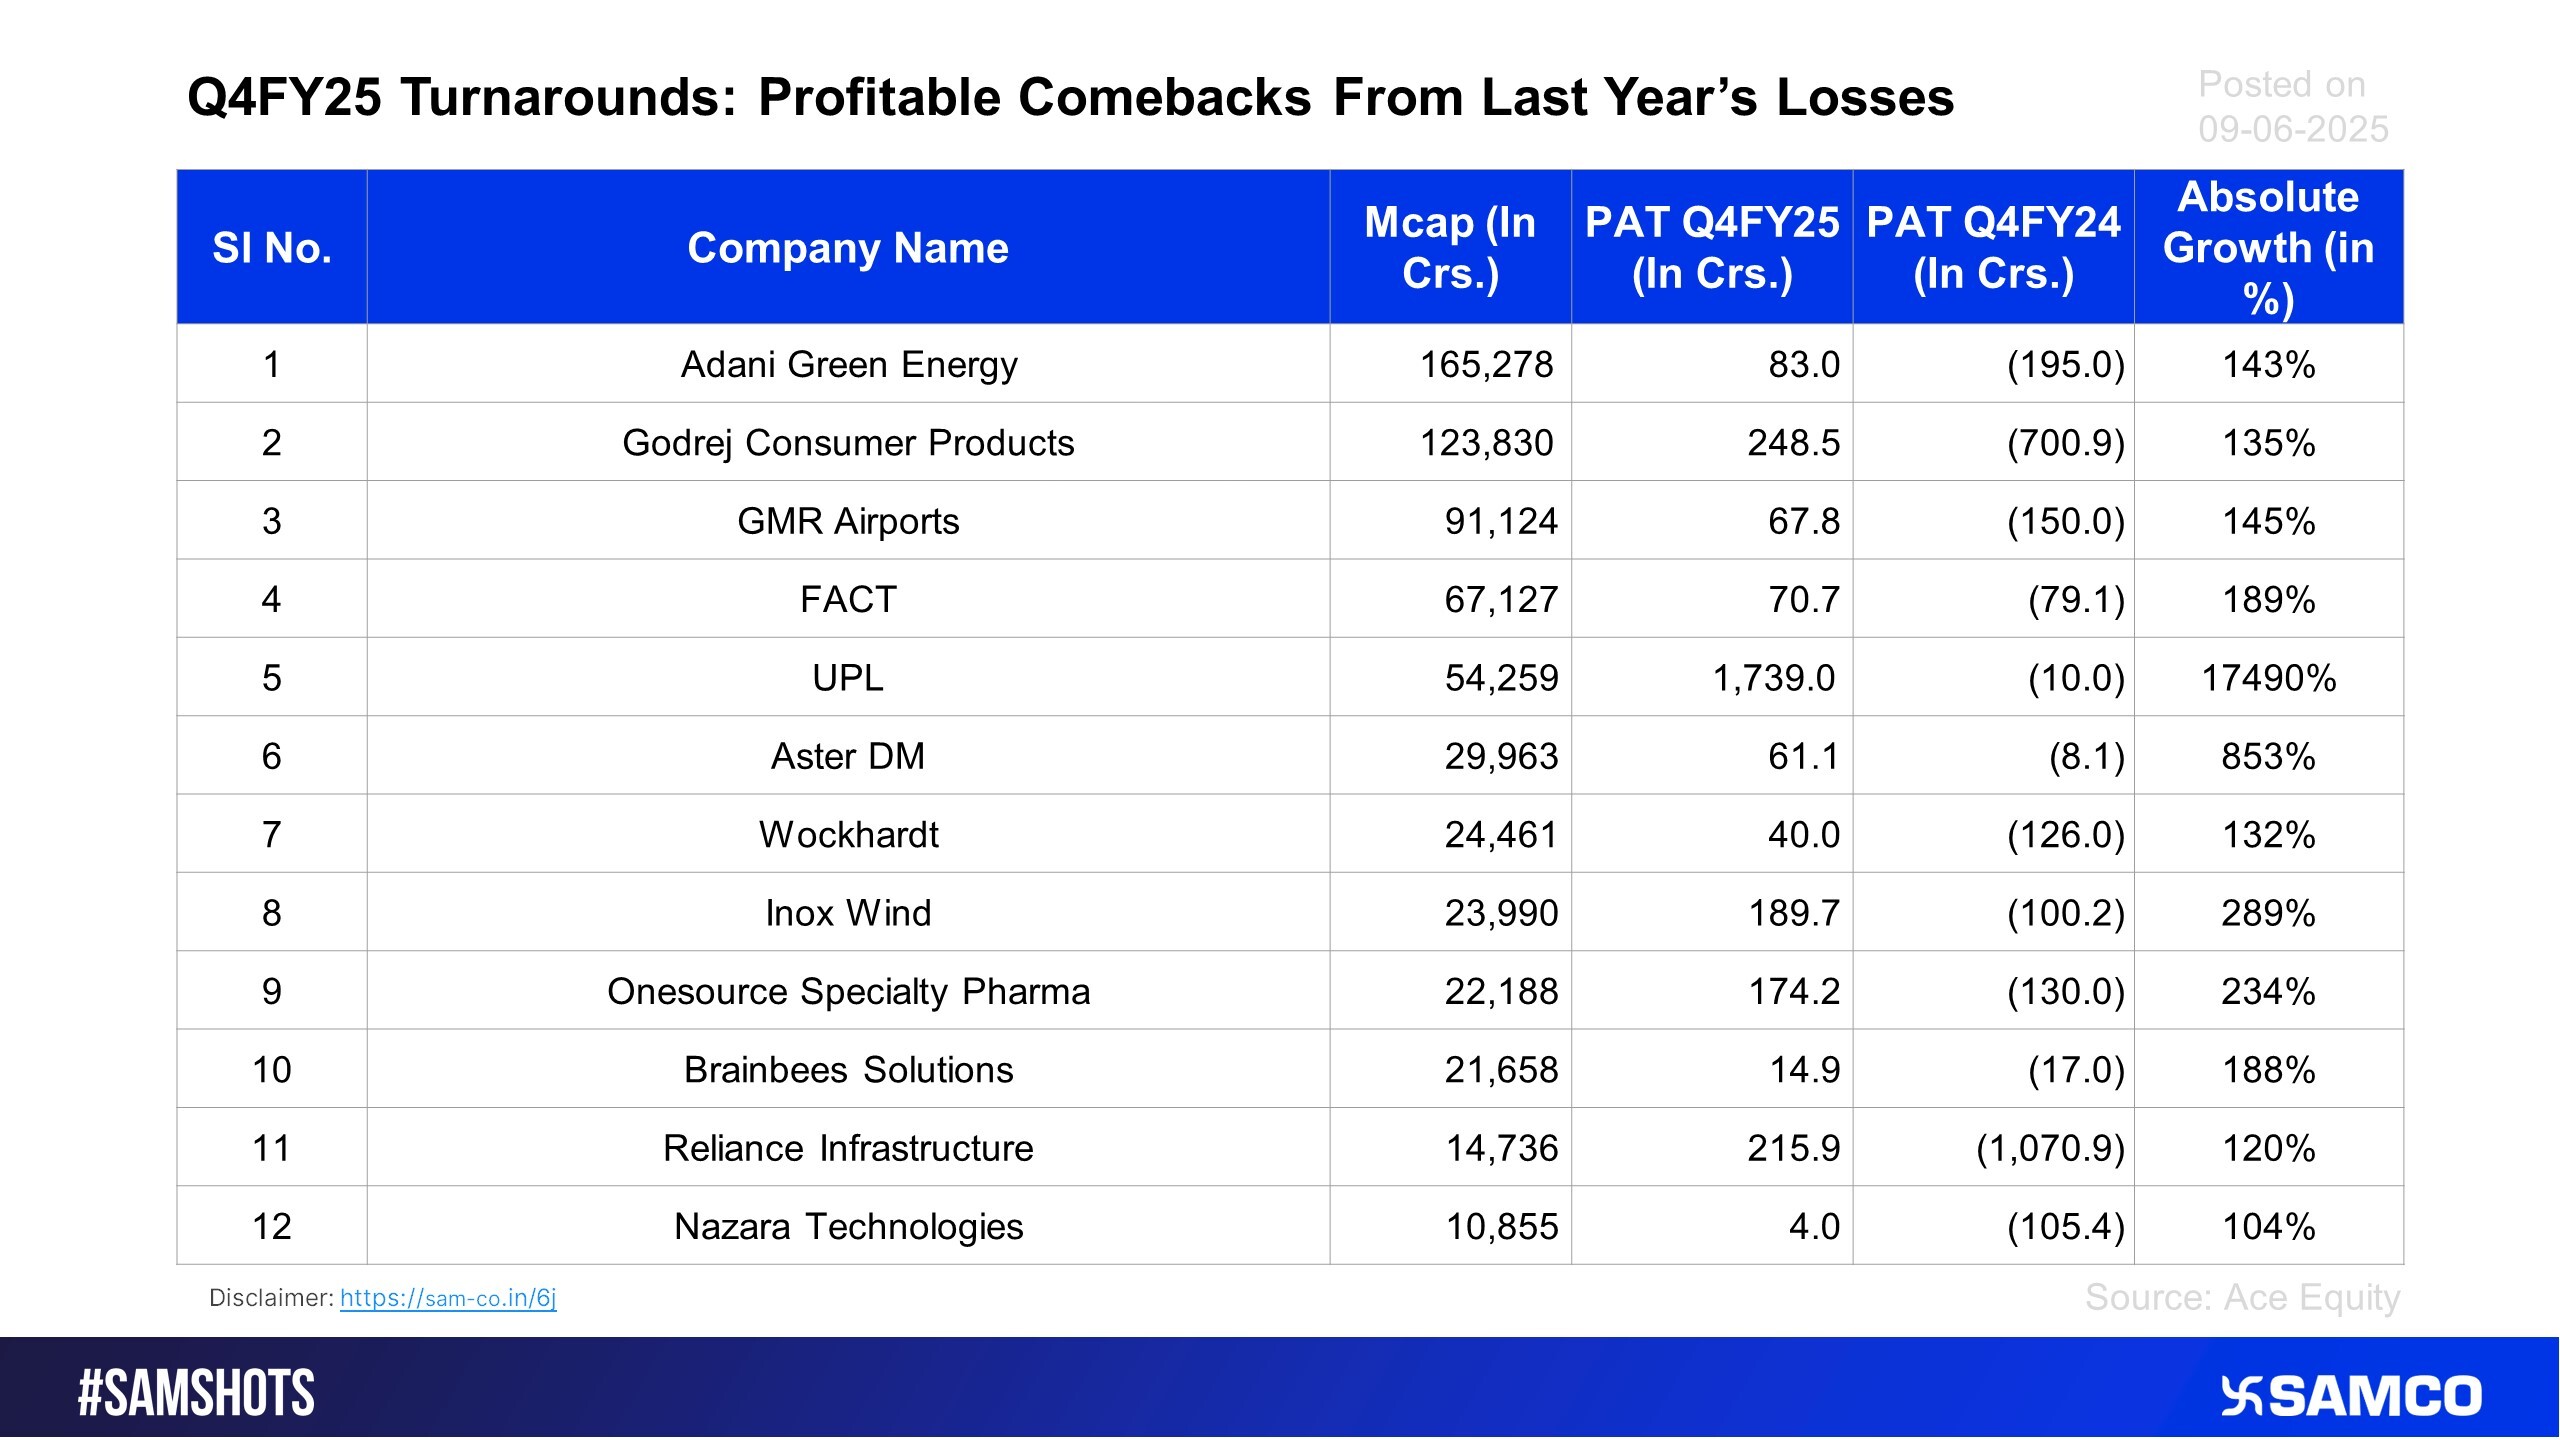
The below accompanying chart presents the companies that posted turned into positive in Q4FY25.
The chart lists low floating stocks with high interest by Promoters and DII

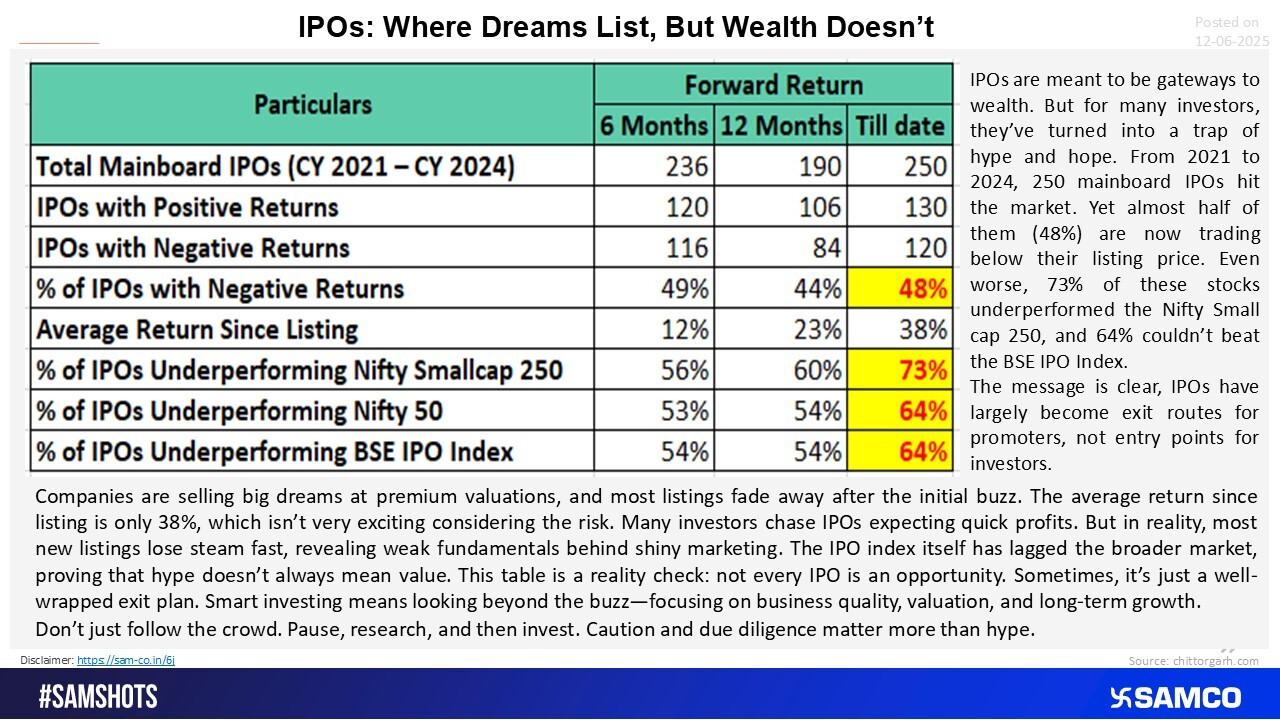
A harsh reality check for IPO investors where big hopes get listed, but real returns often go missing.
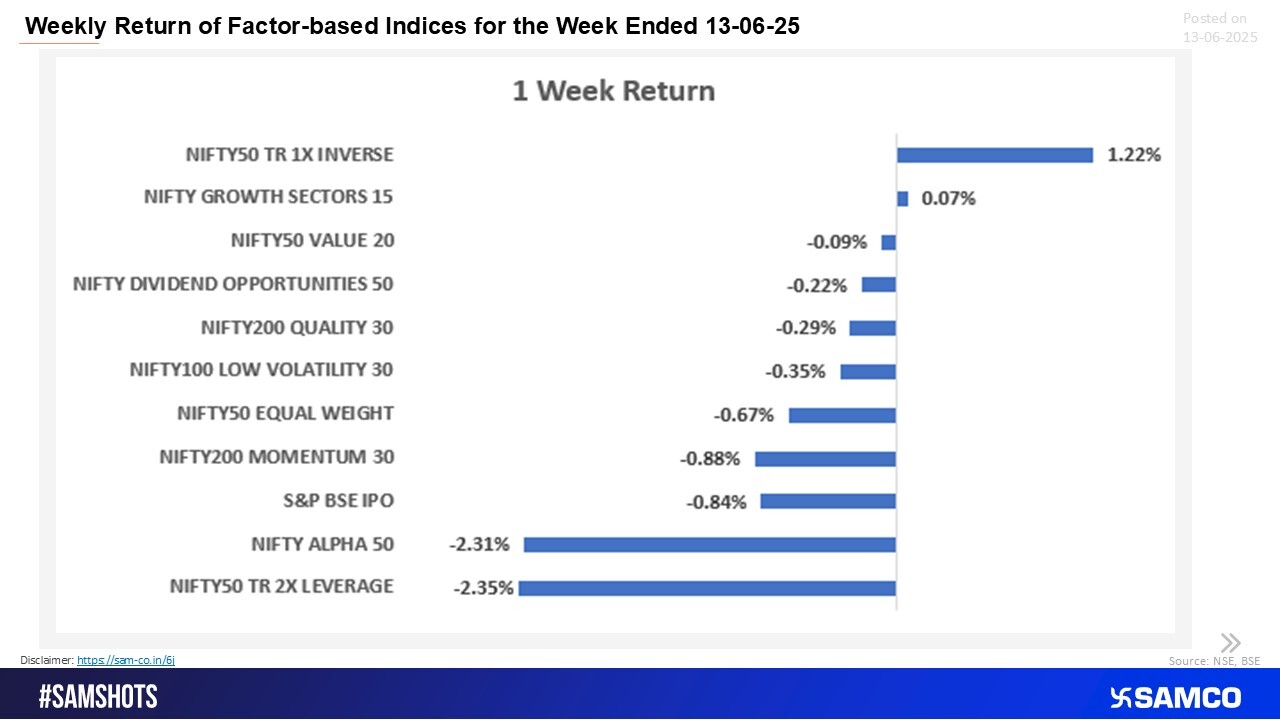
Markets leaned defensive as most indices slipped, with leveraged and alpha strategies hit hardest while only inverse and growth sectors offered refuge.
A week of sharp divergence: IT and Pharma rose, but Realty, PSU Banks, and FMCG dragged markets deep into the red.
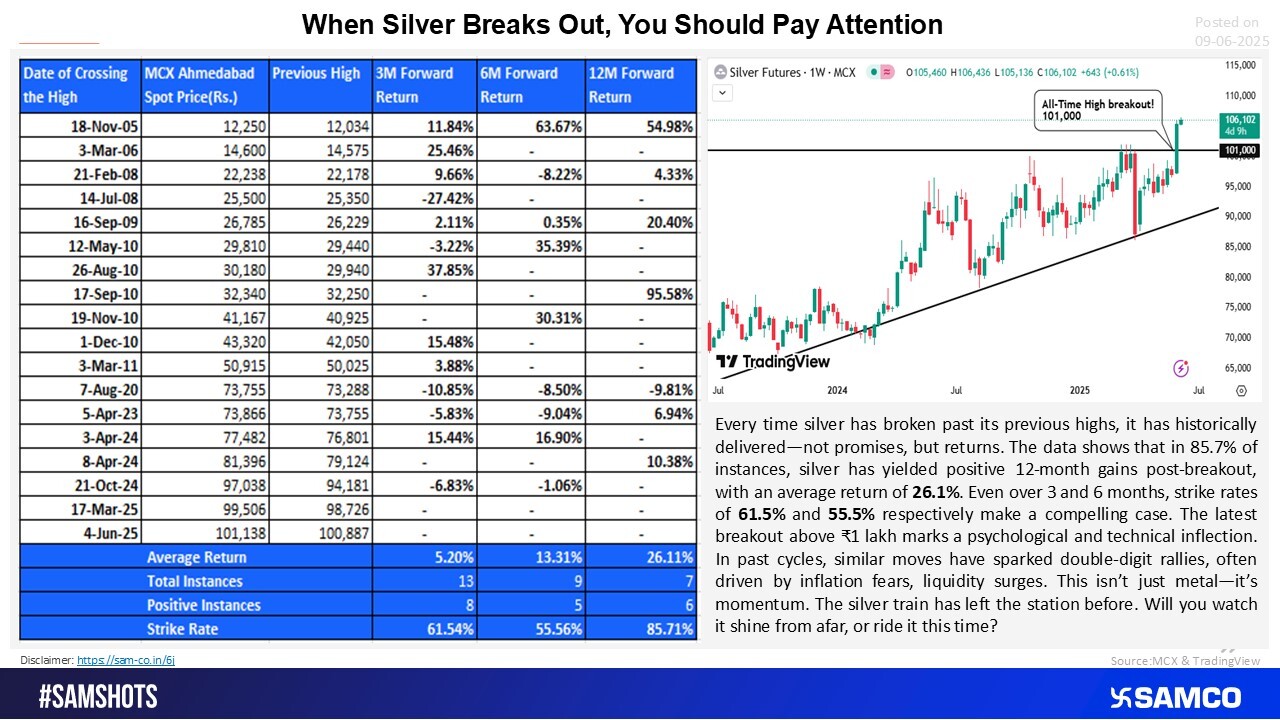
A breakout in silver often leads to strong price action.
The chart evaluates the trend of CPI and CPWI for the last 12 months
The May month witnessed 26,688 cr SIP inflow, the below chart shows the trend of SIP inflow.
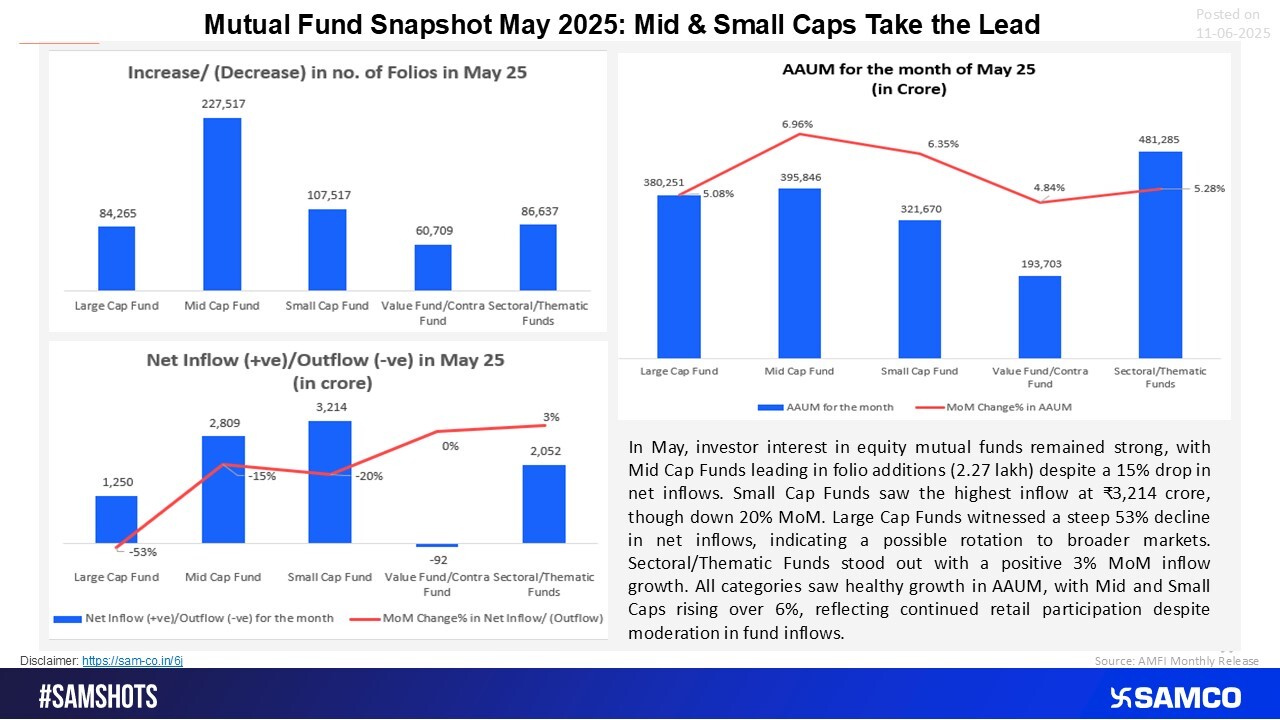
Mid & Small Caps Dominate Despite Inflow Dip; Sectoral Funds See Fresh Interest
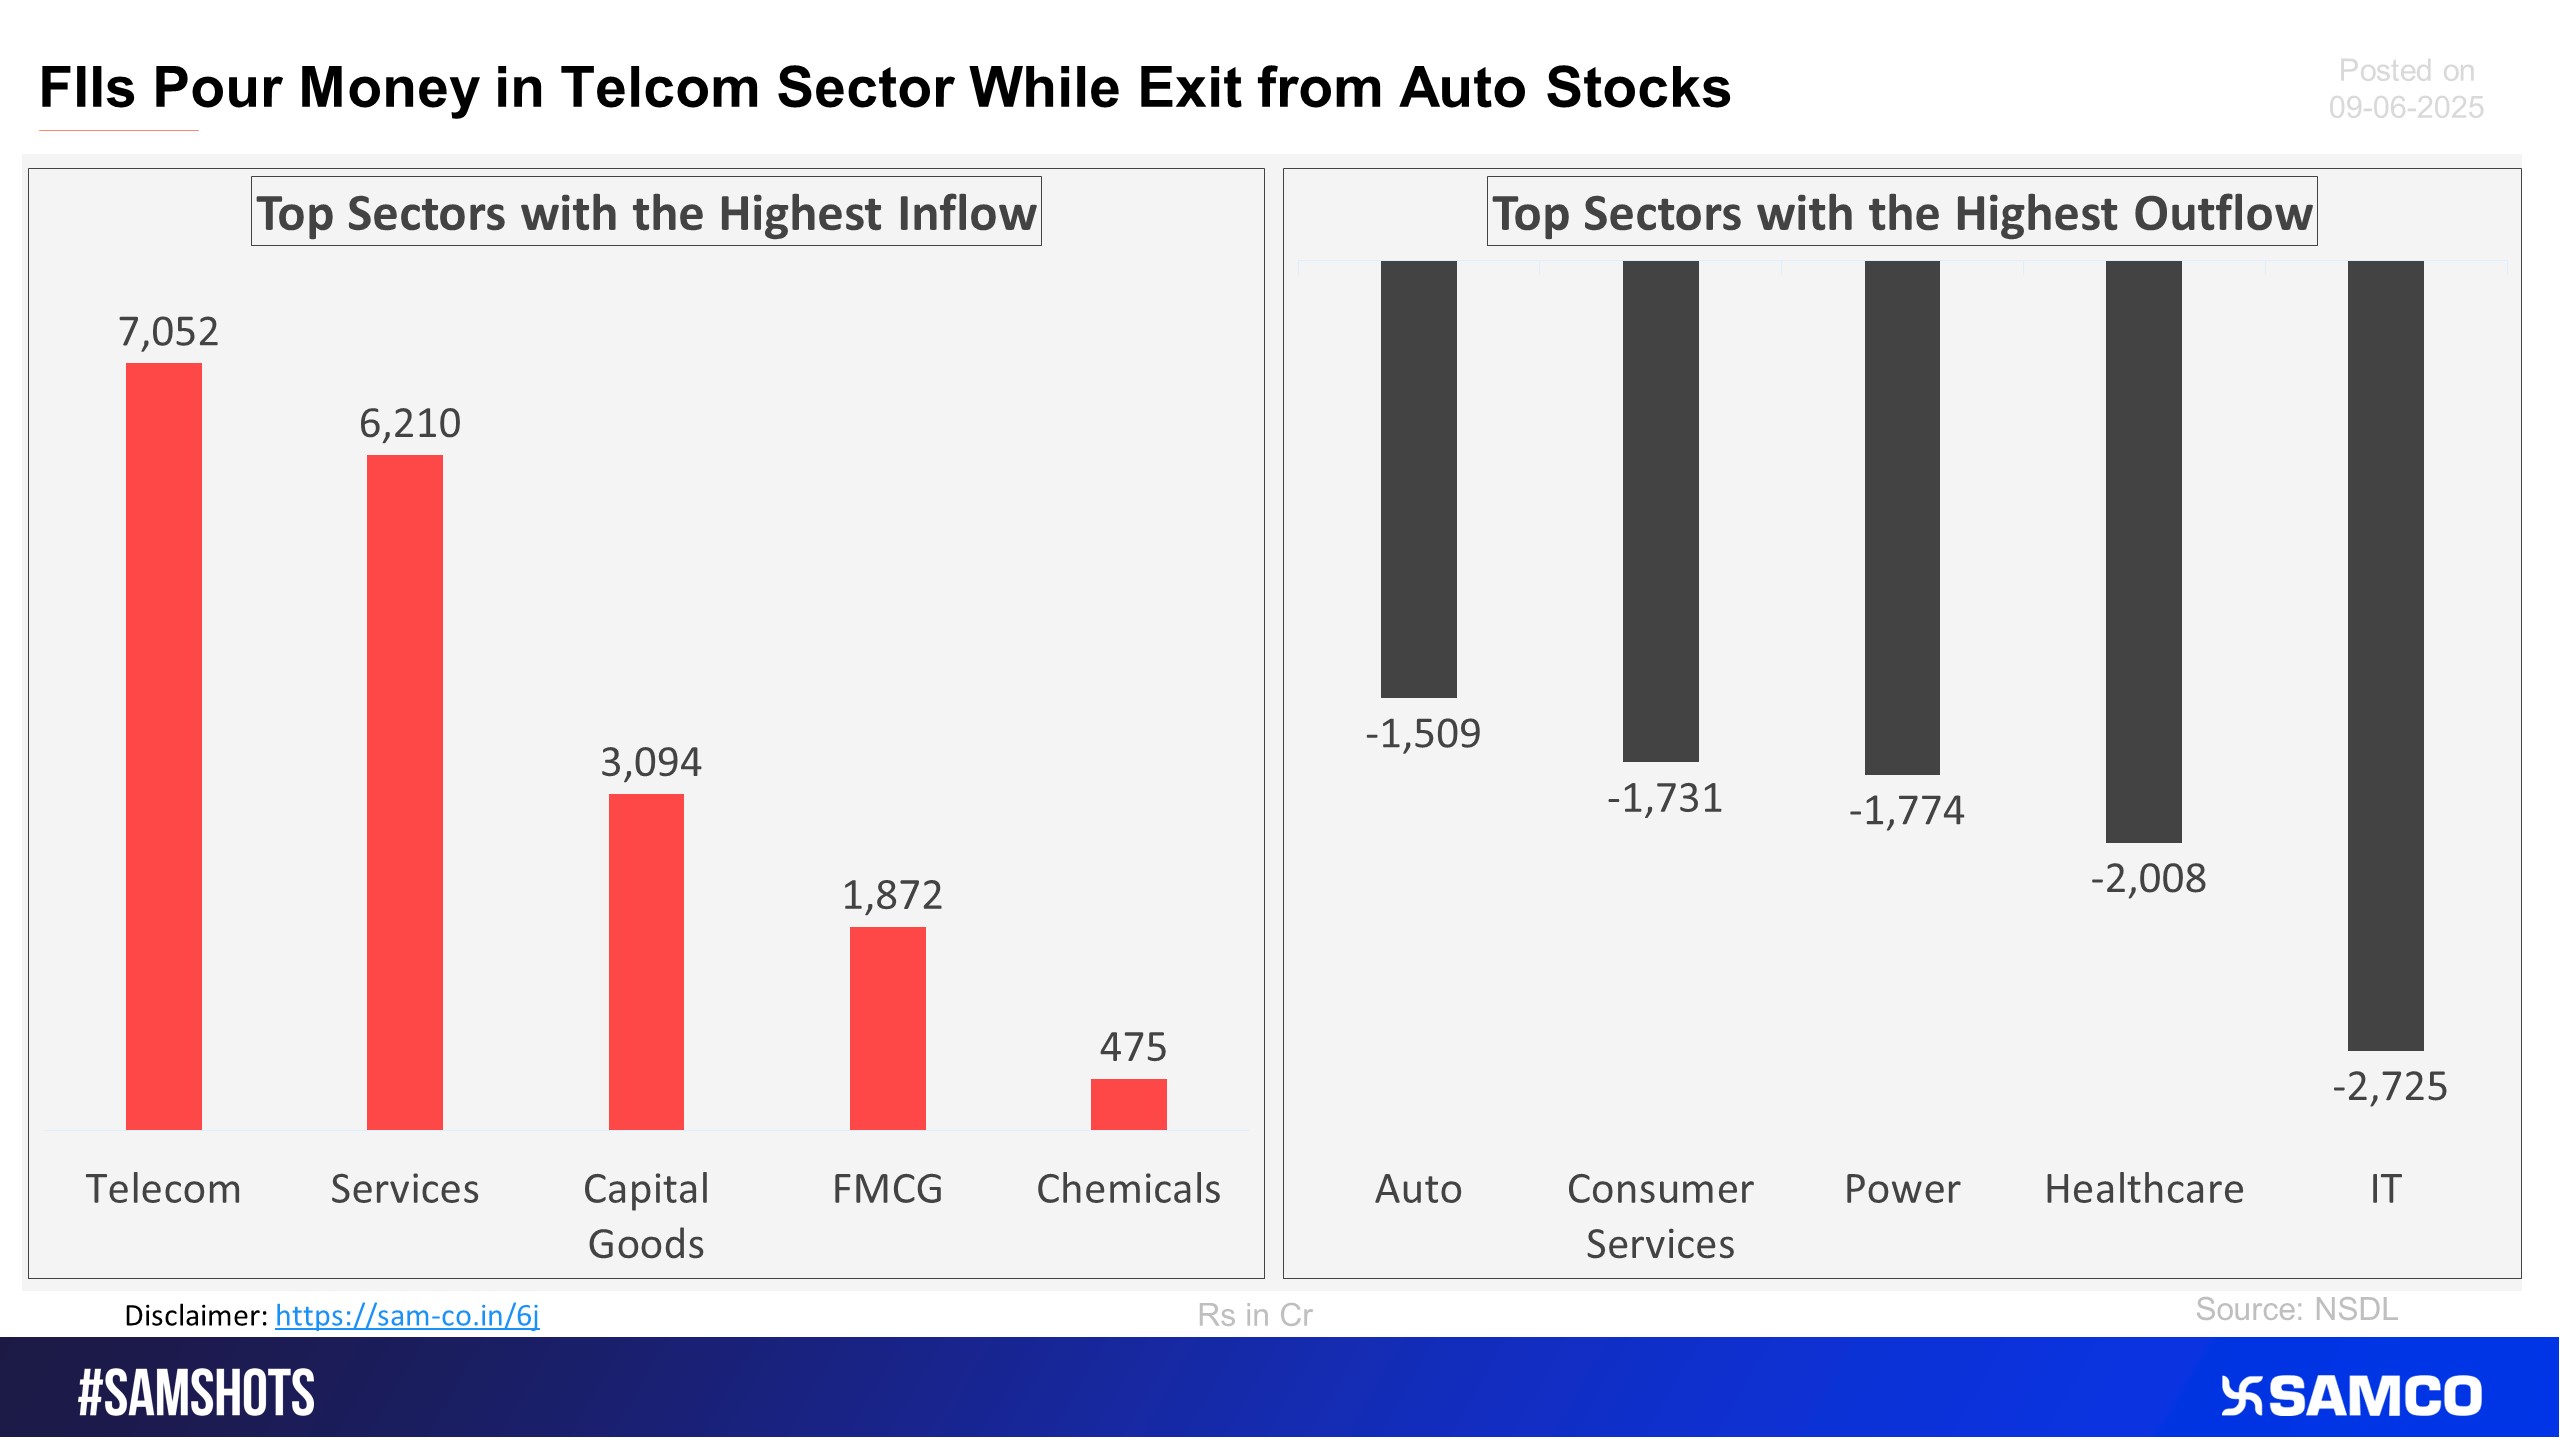
The accompanying chart shows the top 5 sectors that witnessed FPI’s highest inflow and outflow in the latest quarter.
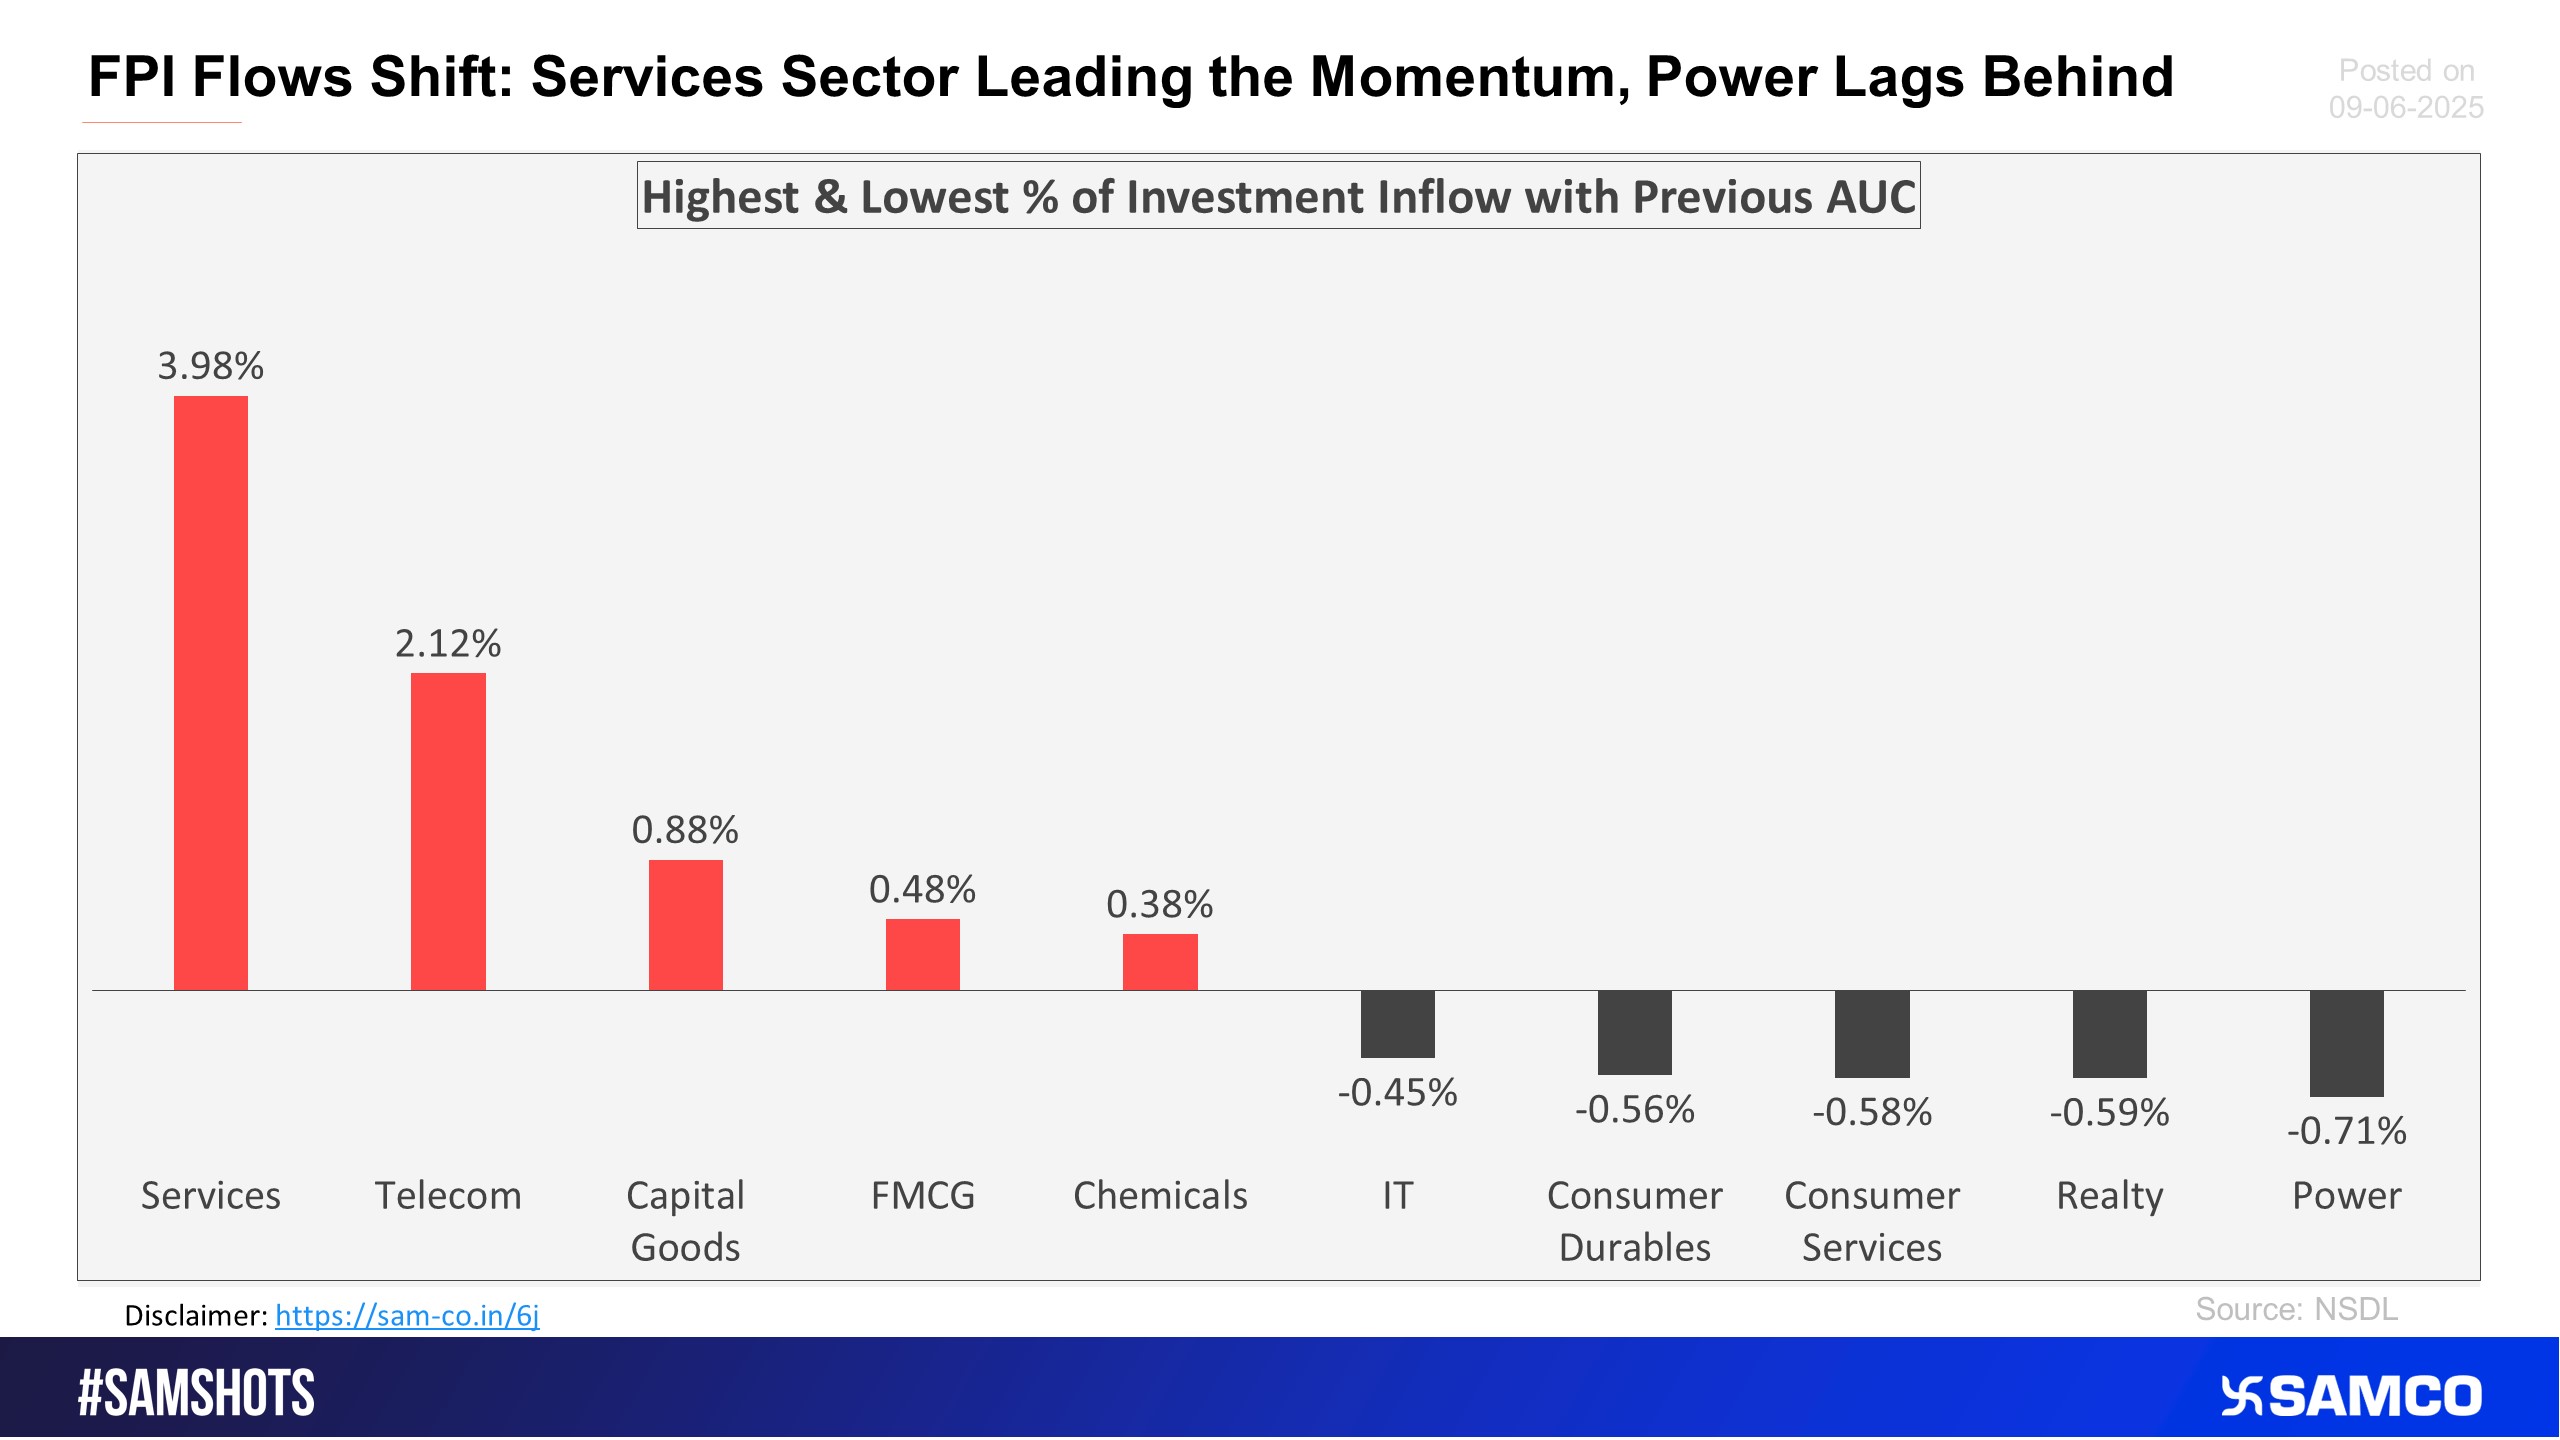
The below chart presents the highest & lowest percentage inflow of investment in the latest fortnight compared to the previous period AUC (Asset Under Custody) of FPI.
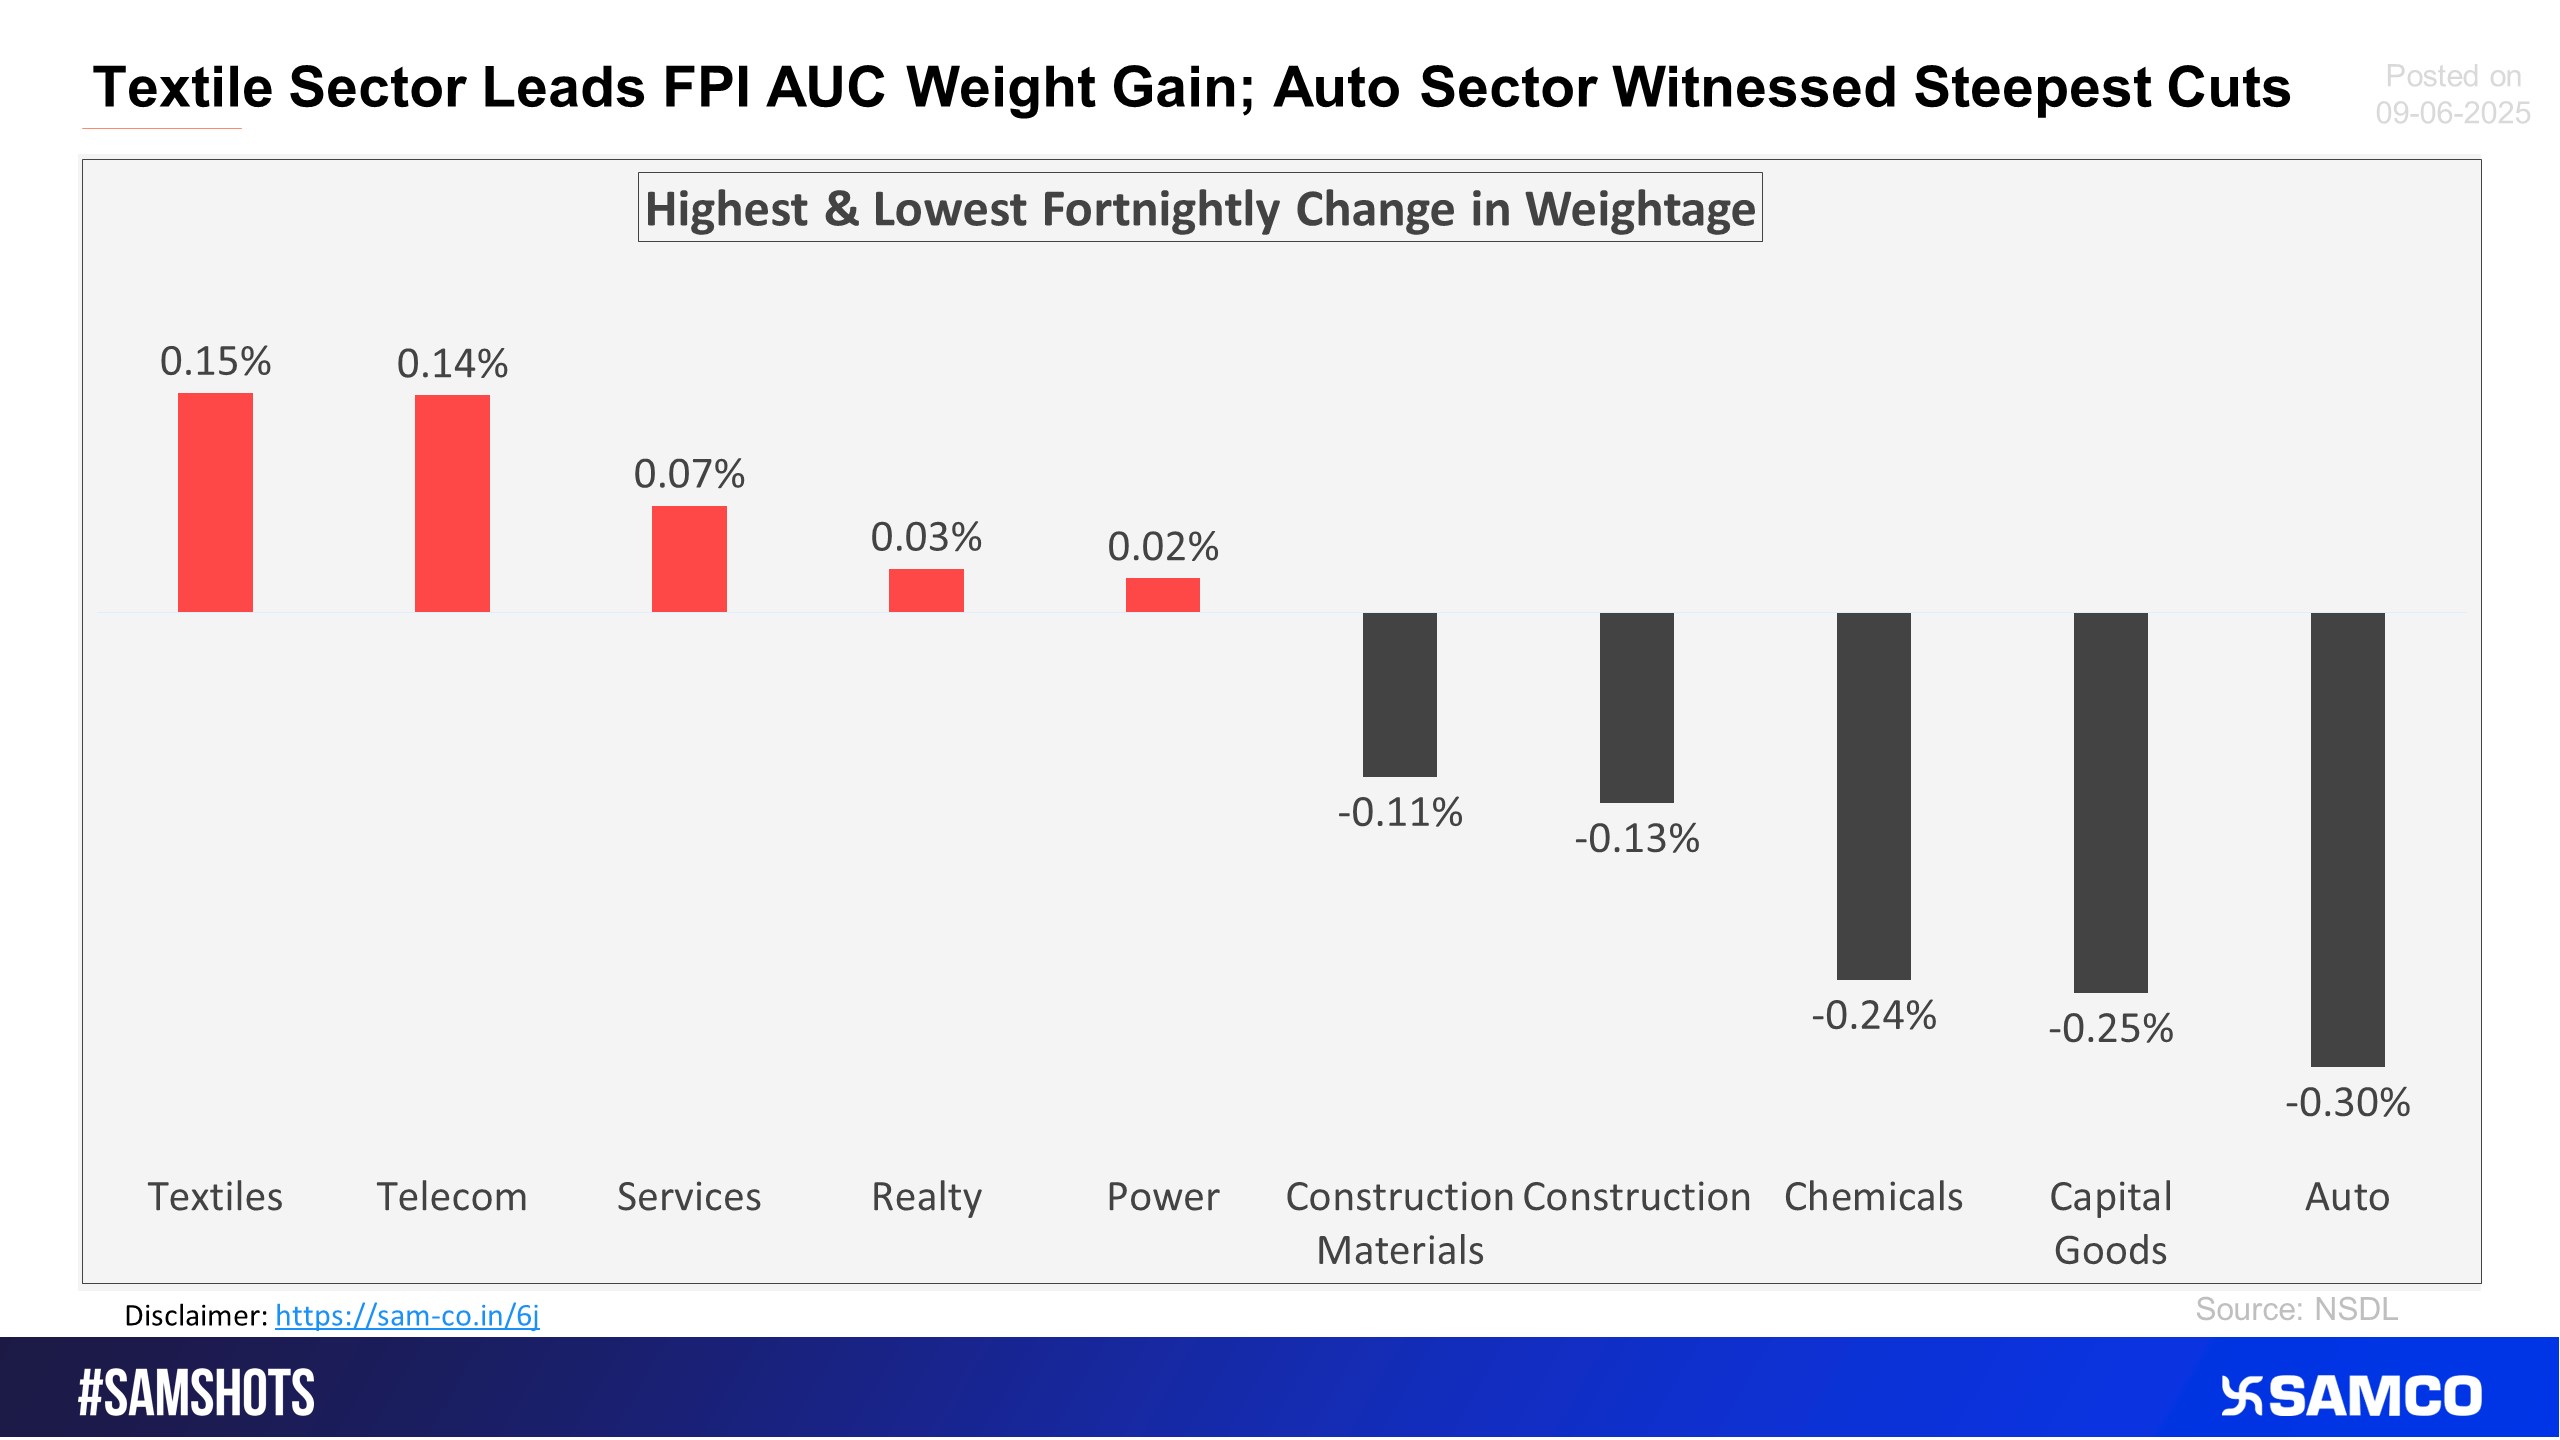
The chart below displays sectors that witnessed the highest and lowest change in the weightage of sectoral FPI holdings to the total FPI holdings compared to the previous fortnight.
Bullish Engulfing Sparks Fresh Upside in Nazara
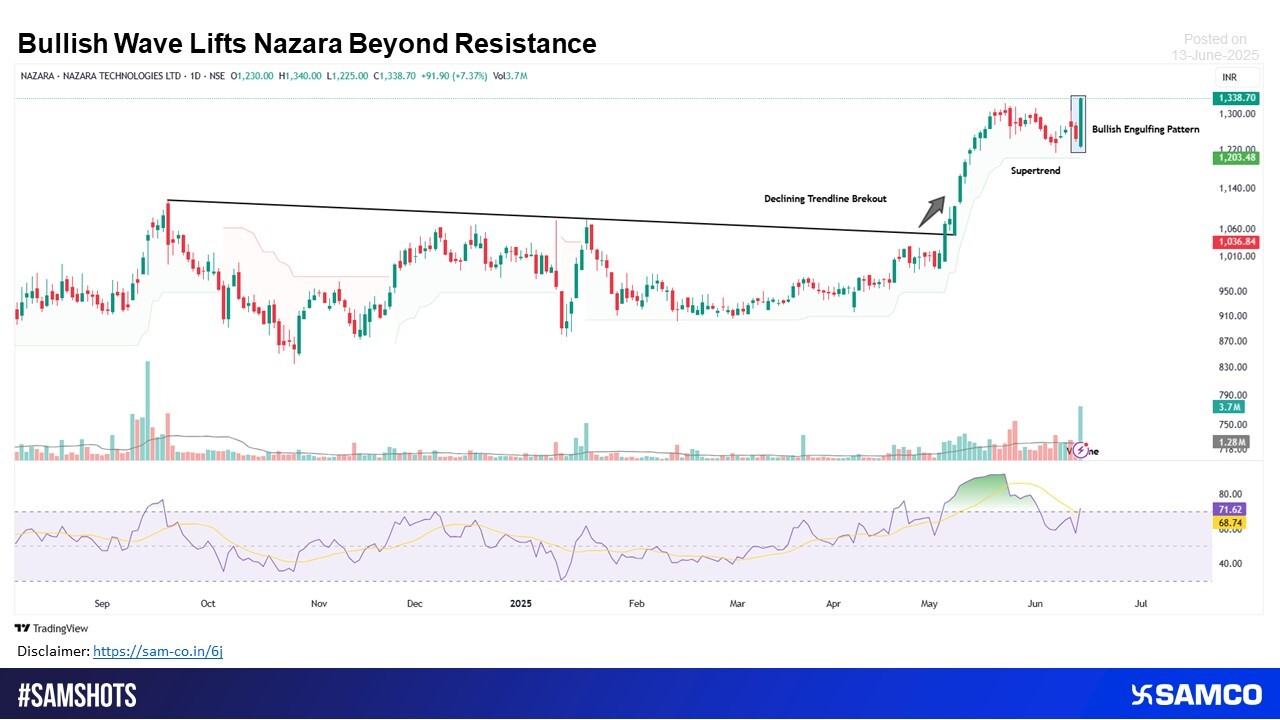
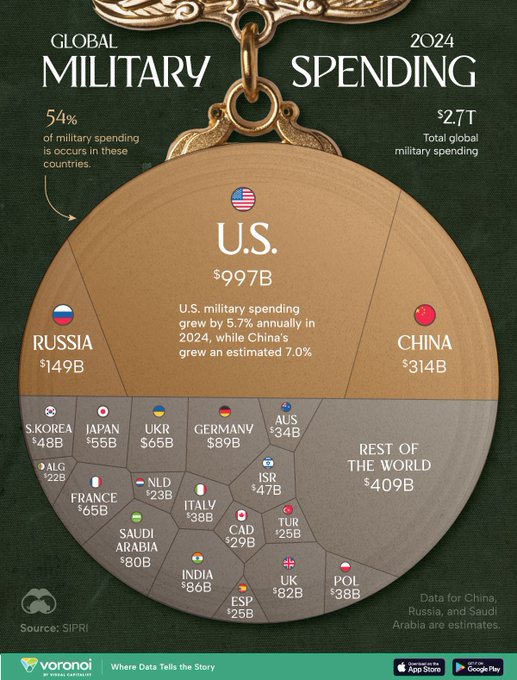
Image Source: @ VisualCap (Twitter)
 Easy & quick
1. Register on SCORES portal
2. Mandatory details for filling complaints on SCORES
Name | PAN | Address | Mobile | Number | E-mail ID
3. Benefits
Effective Communication
Speedy redressal of the grievances
