The Indian equity market extended its bullish momentum this week, continuing the positive trend from the previous week. The ceasefire announcement acted as a key catalyst, boosting investor sentiment and driving broad-based buying across sectors. Notably, small-cap and mid-cap stocks witnessed heightened investor interest, reflecting renewed risk appetite.
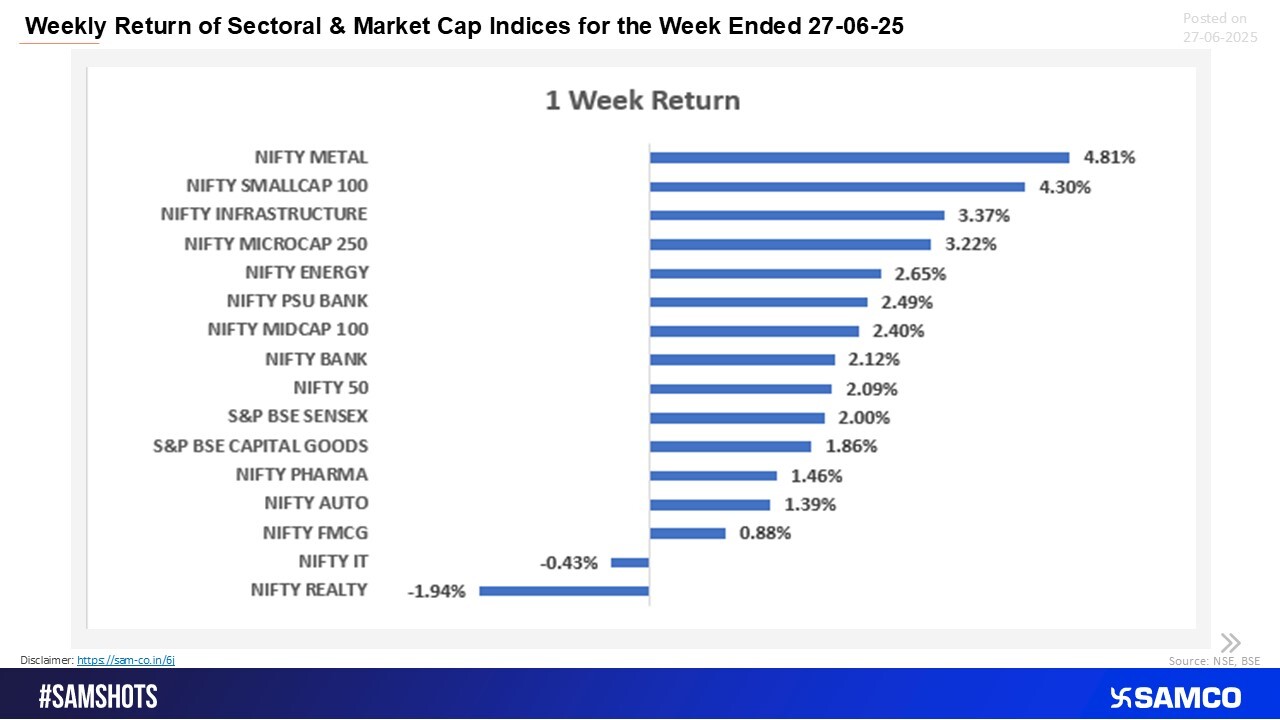
The Nifty 50 advanced 2.09%, while the Nifty Midcap and Small-cap indices surged 2.4% and 4.30% respectively, highlighting strong participation beyond large caps. On the sectoral front, Nifty Metal emerged as the top gainer, climbing 4.81%, supported by global commodity strength. In contrast, Nifty Realty underperformed, slipping 1.94%.
In commodities, crude oil prices corrected sharply, falling over 12% post-ceasefire due to easing supply concerns. Meanwhile, gold prices declined by more than 2%, pausing after a sustained rally; further reinforcing investor confidence in equities as an attractive asset class.
Scroll down to understand more of such market news and perspectives for the week gone by in easily understandable charts.
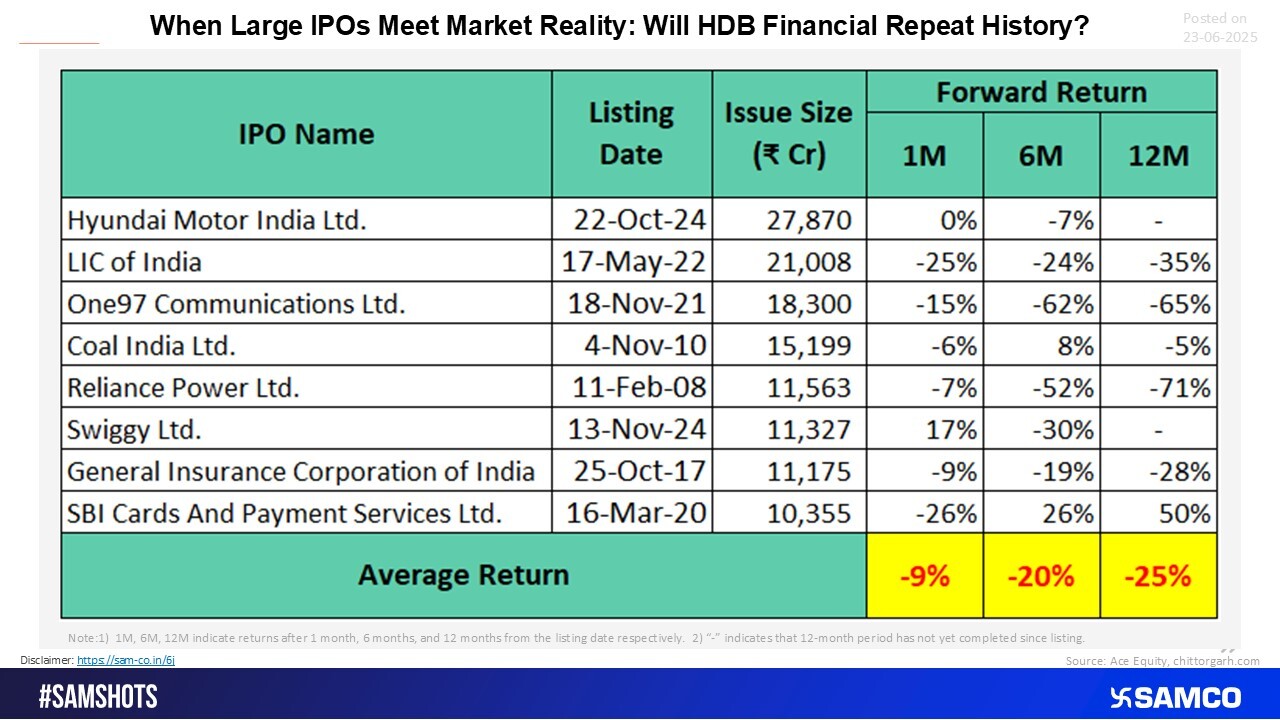
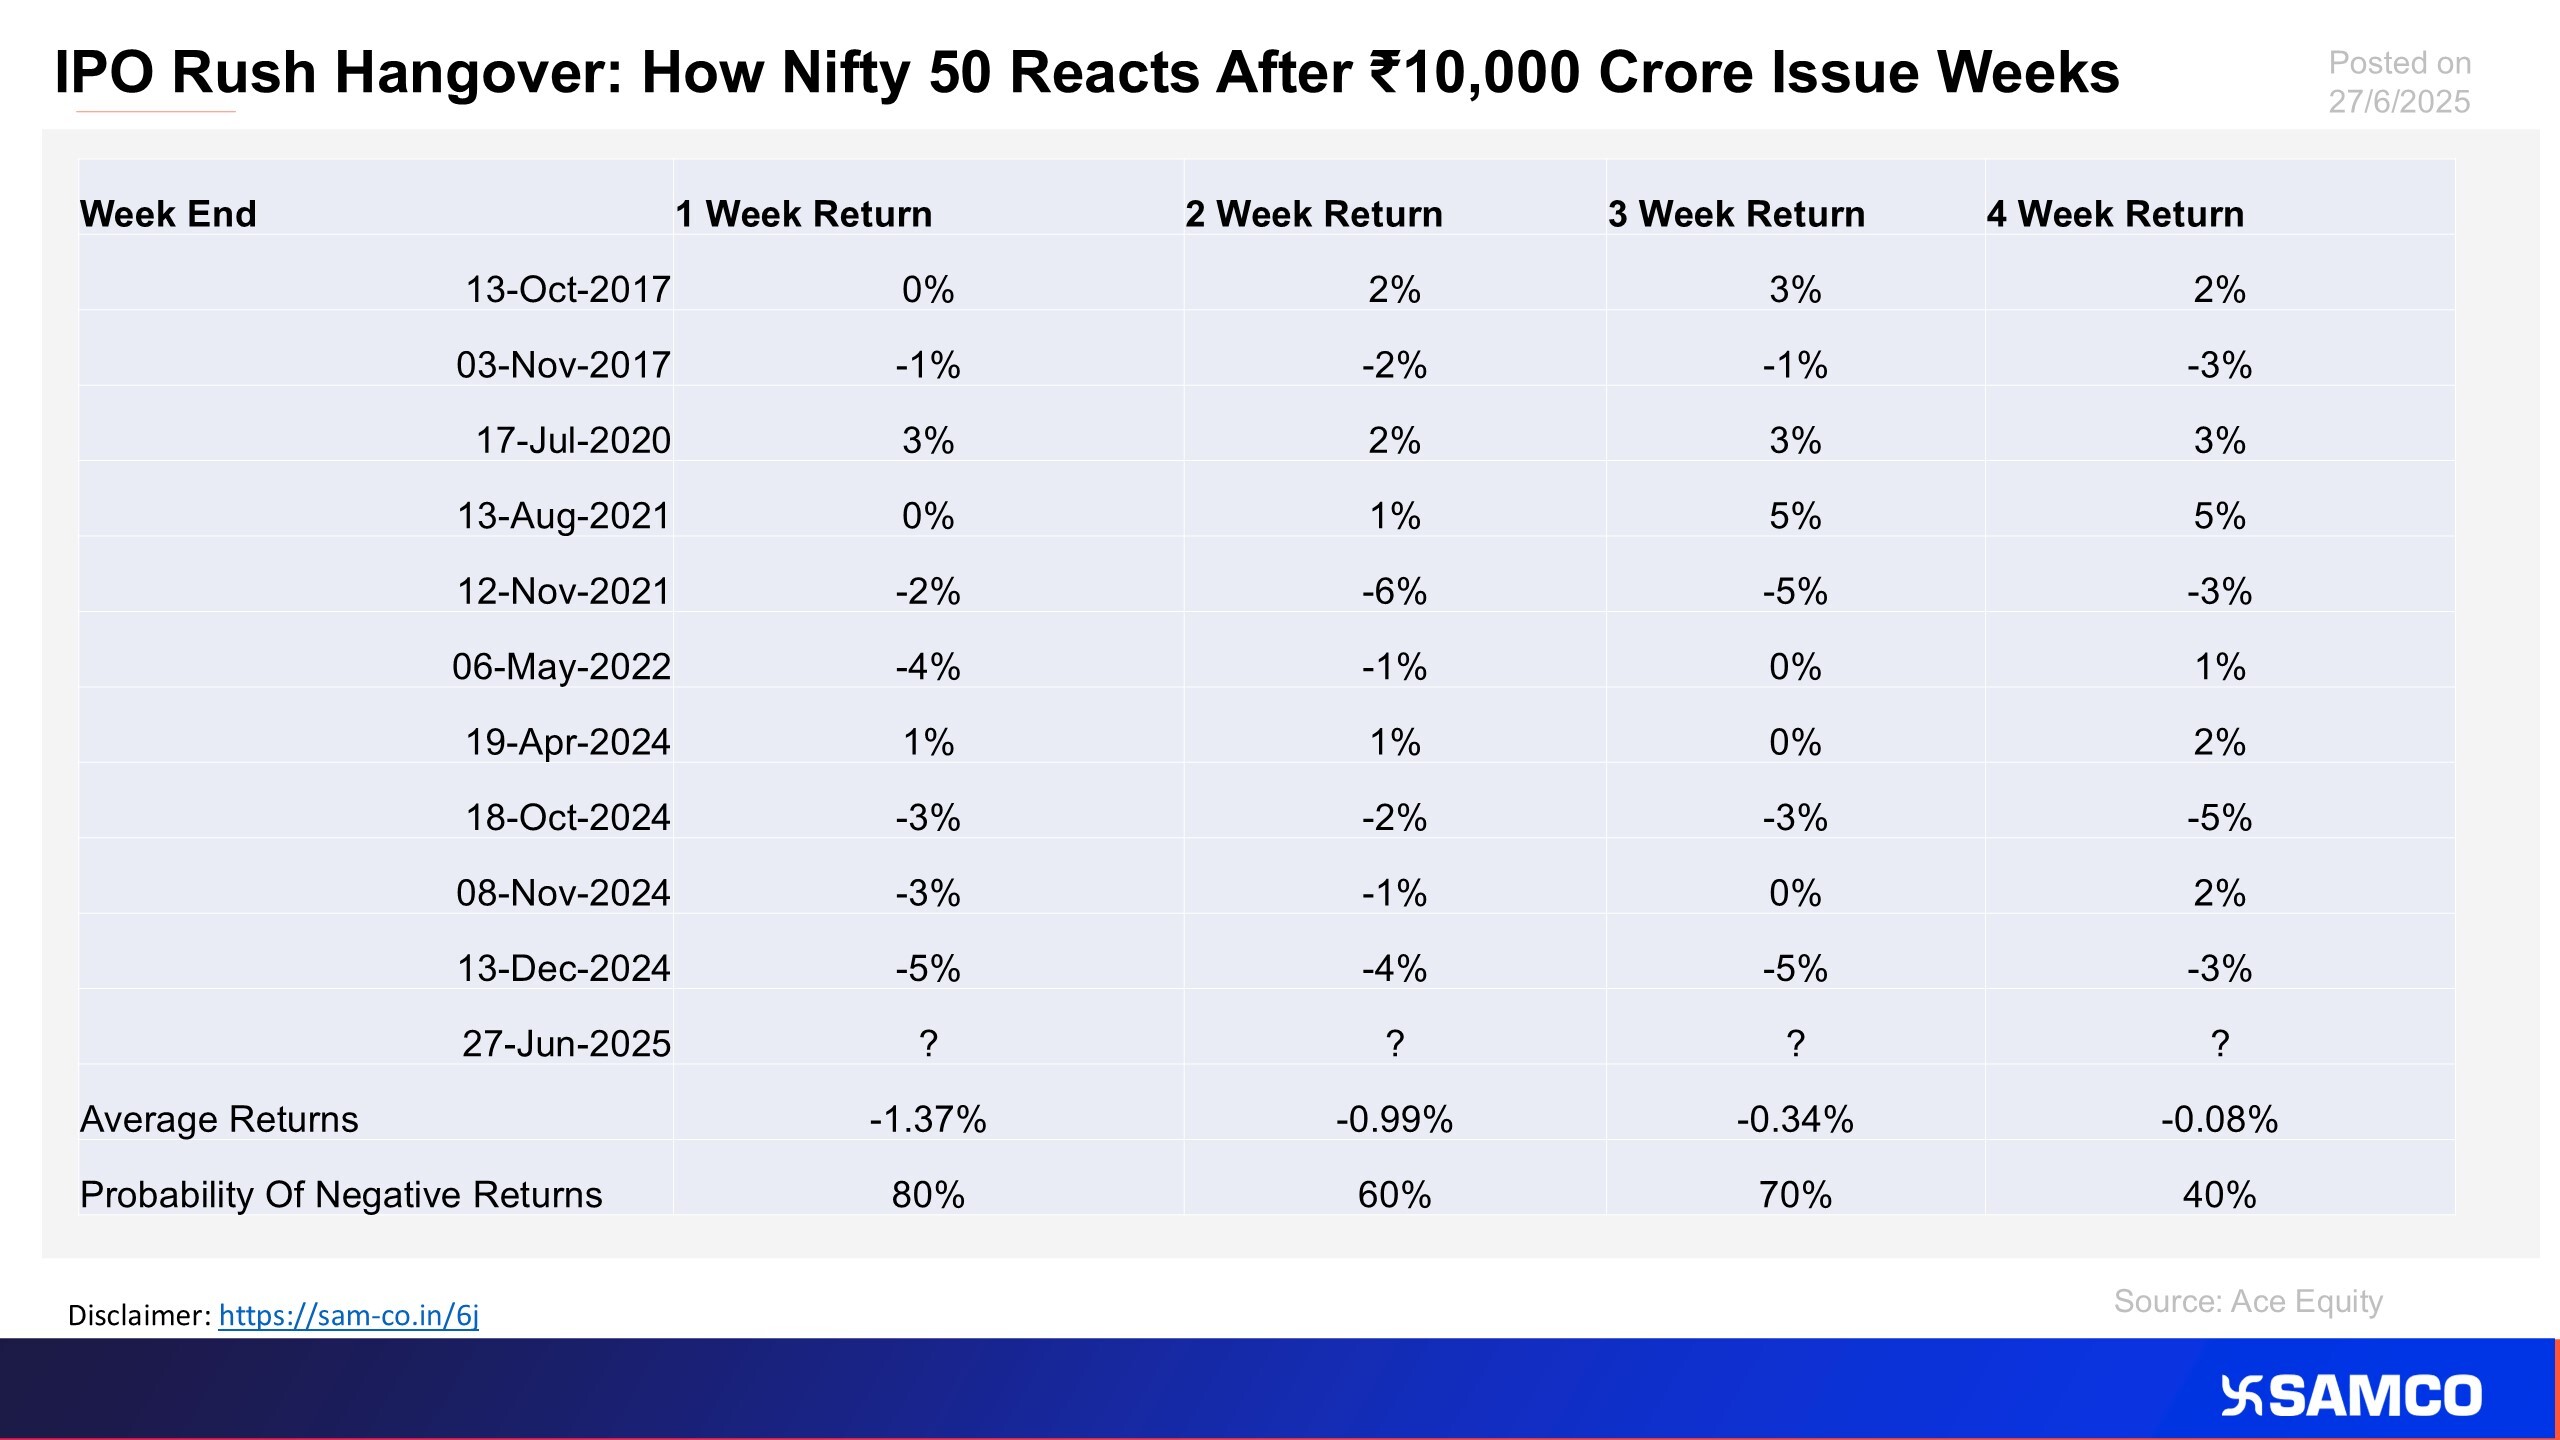
Mega-IPOs like HDB may grab headlines, but history shows size often signals saturation, not sustained upside.


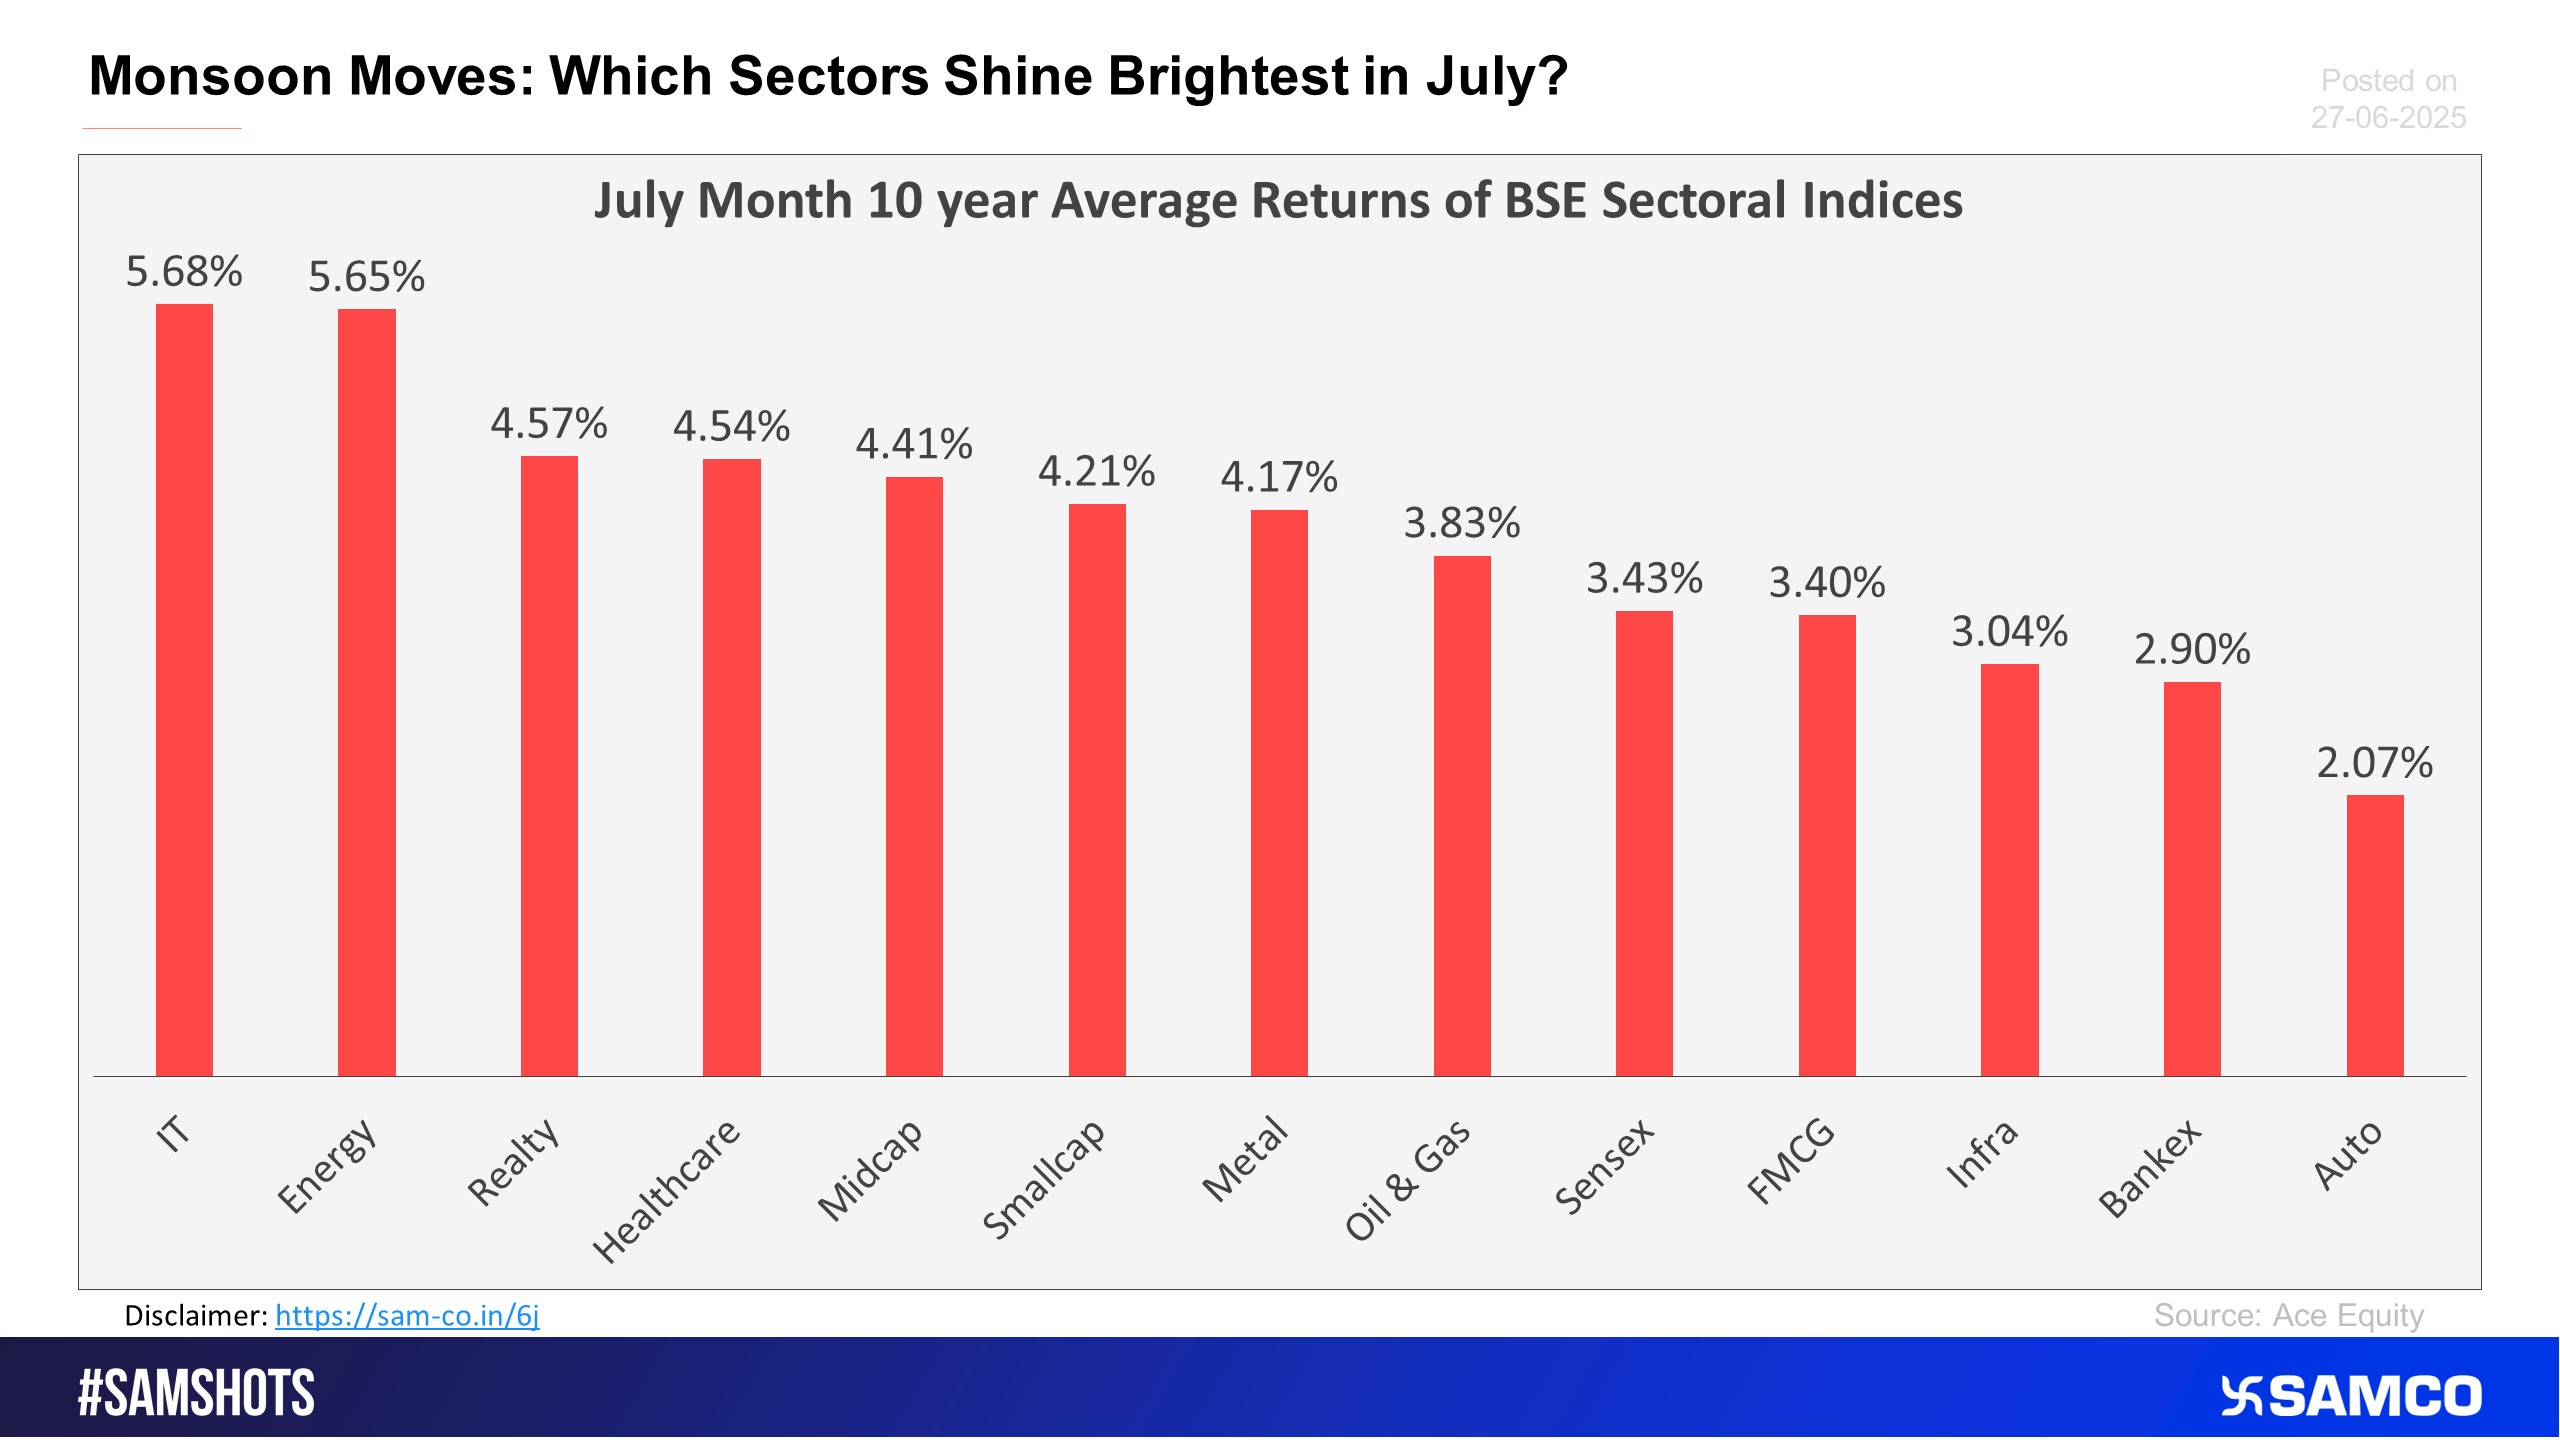
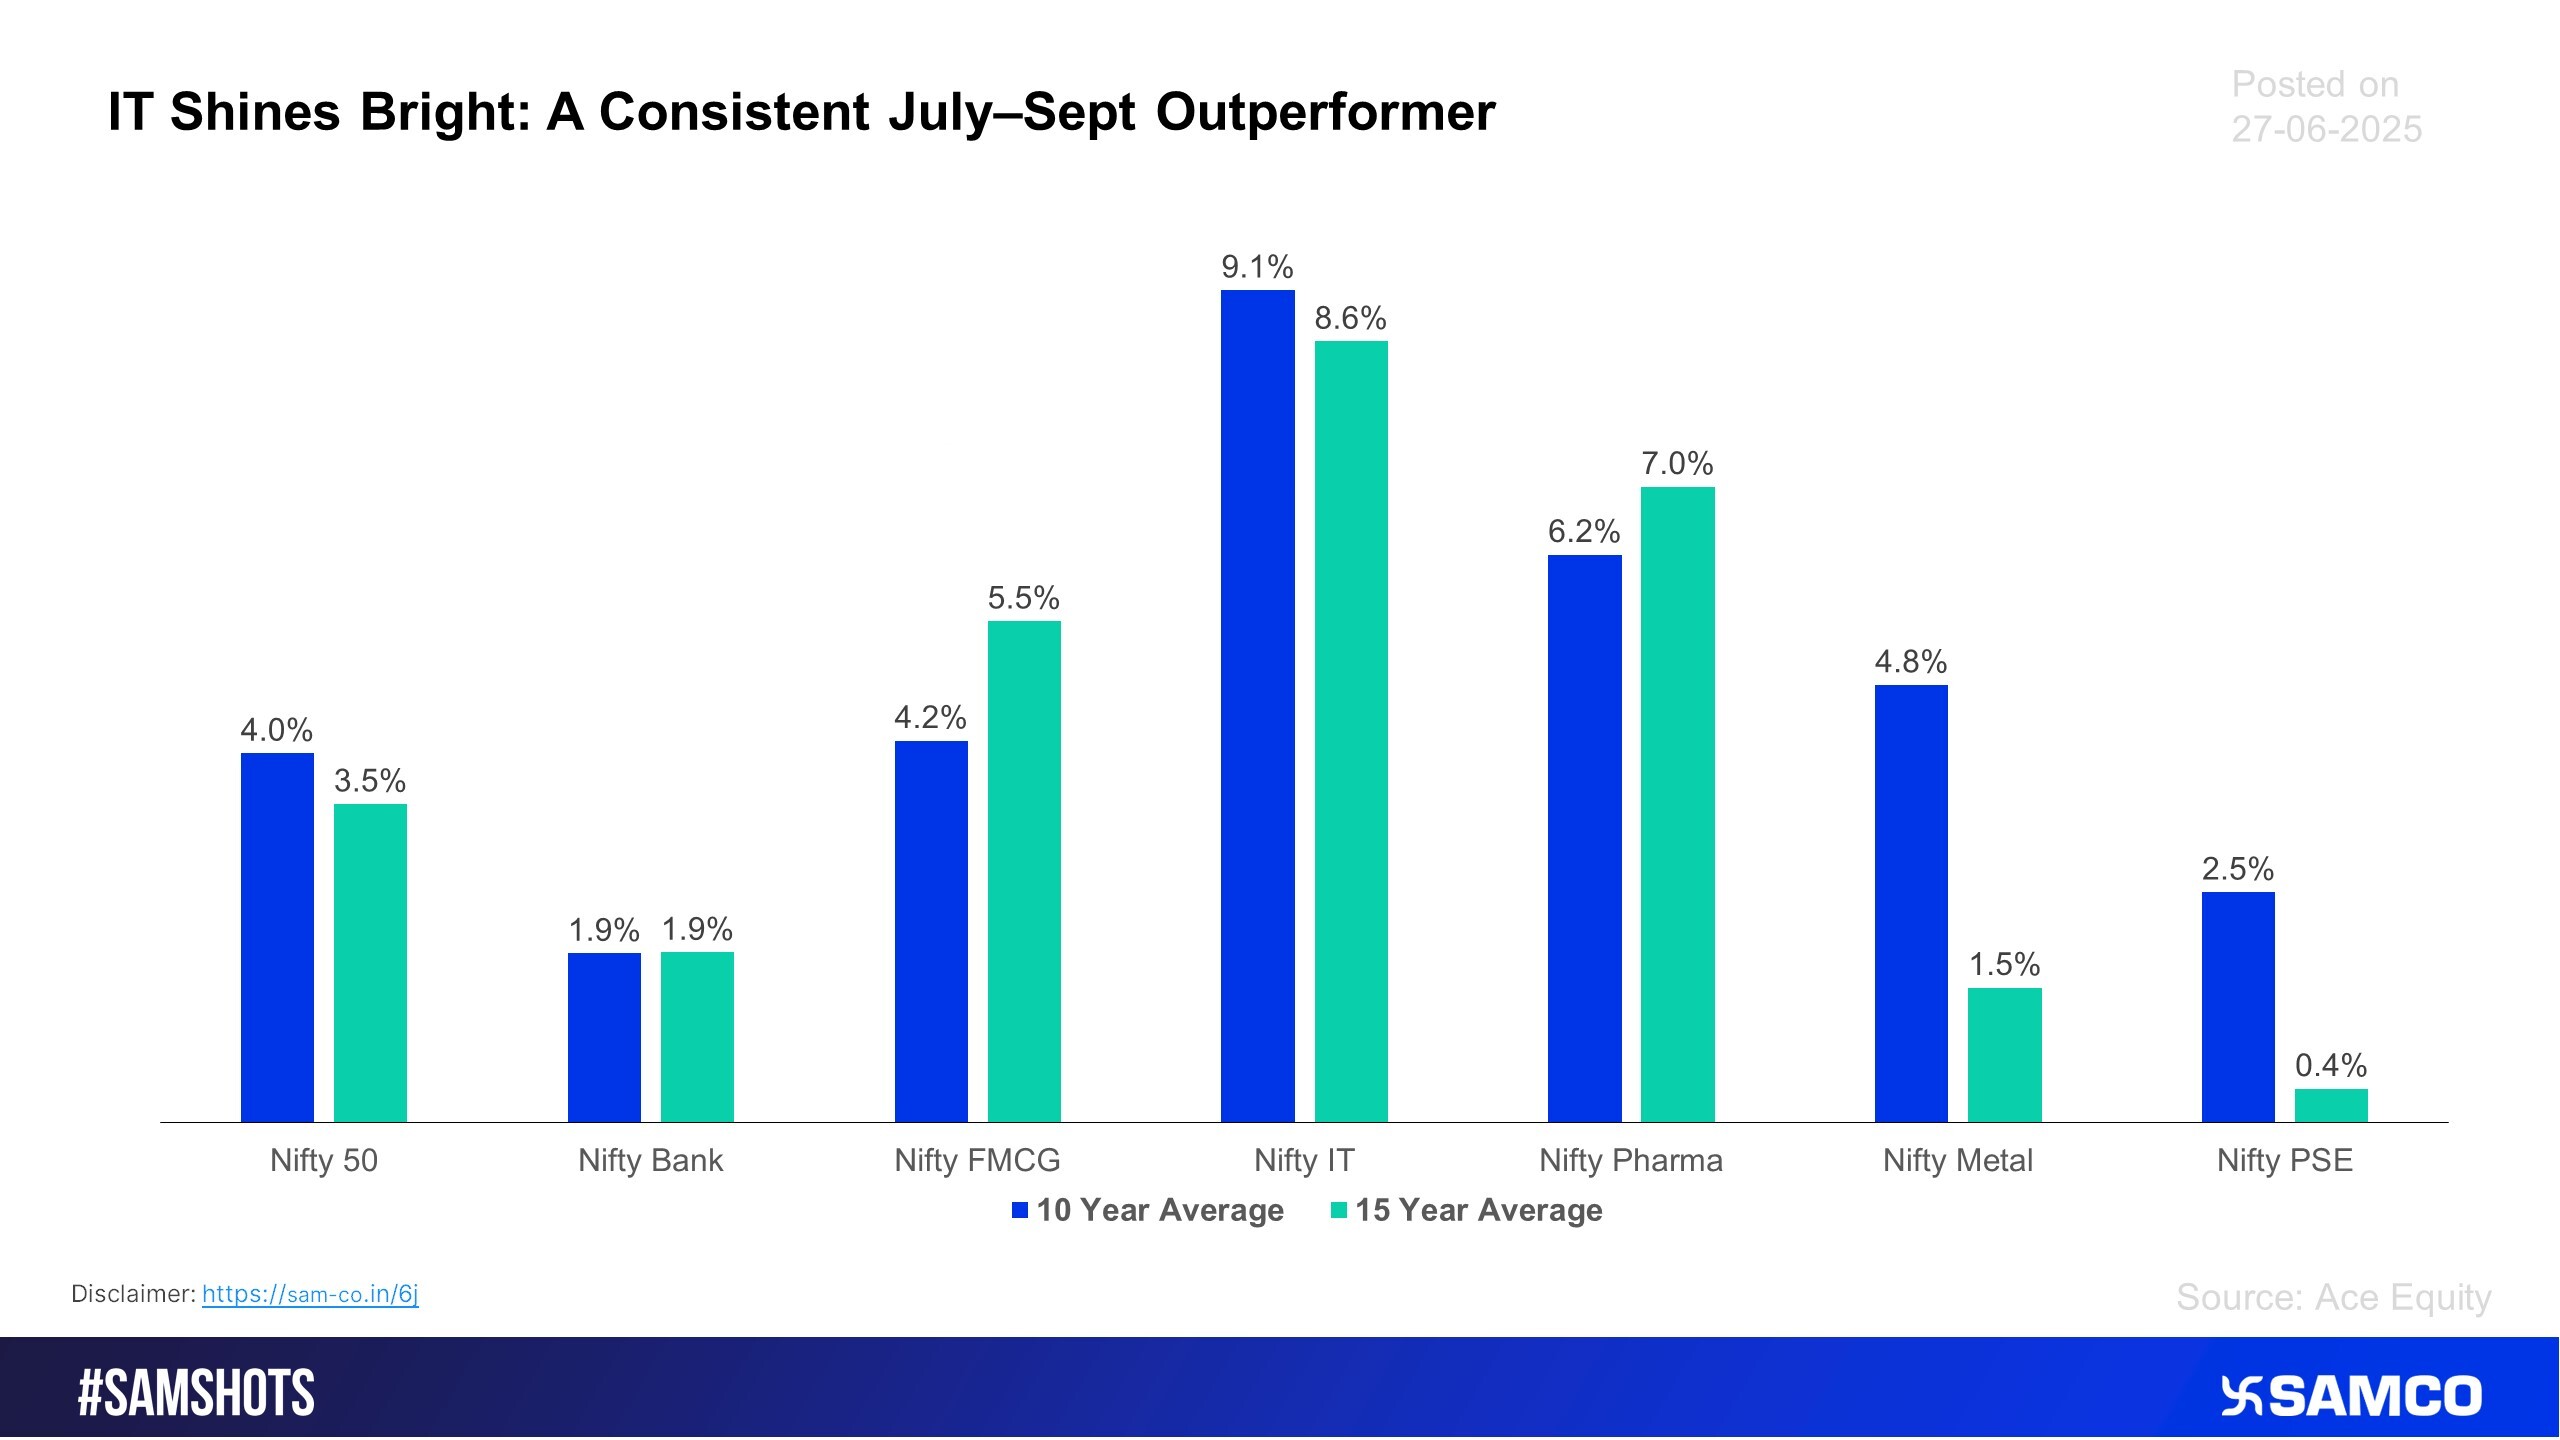
The accompanying chart shows the sectoral performance of Indian indices in the month of July.
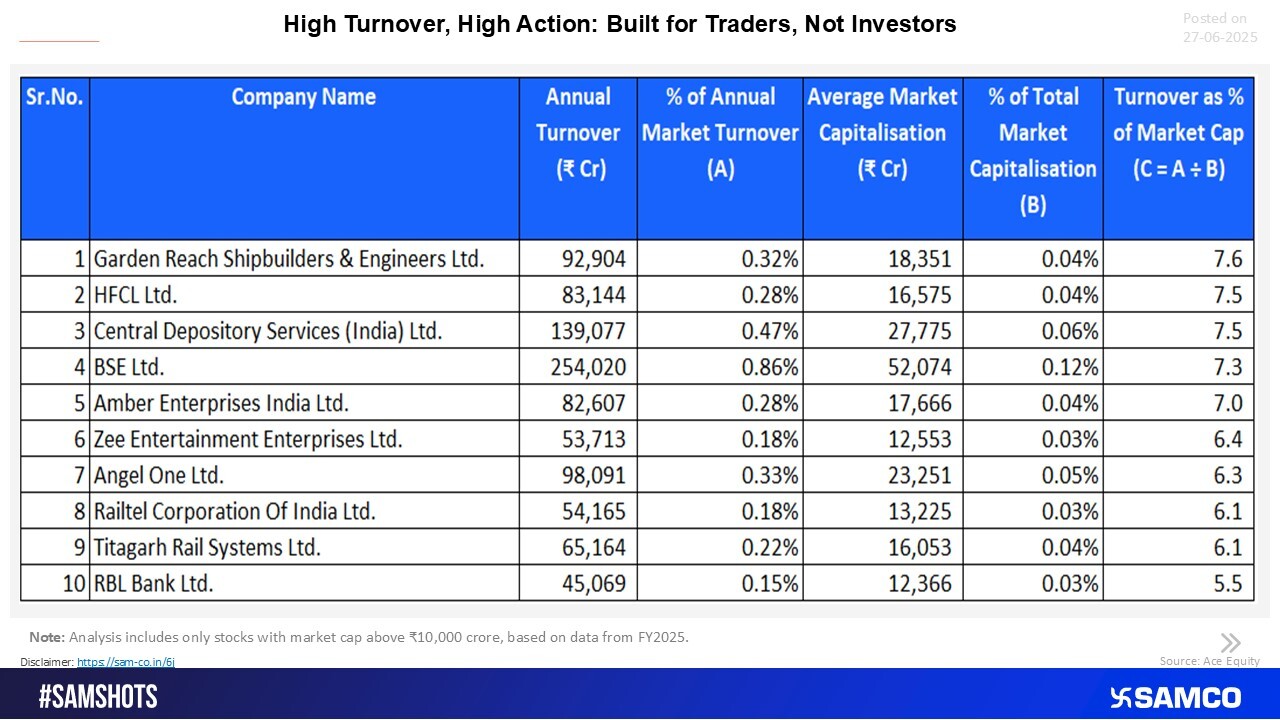
Stocks with high annual turnover and low holding conviction
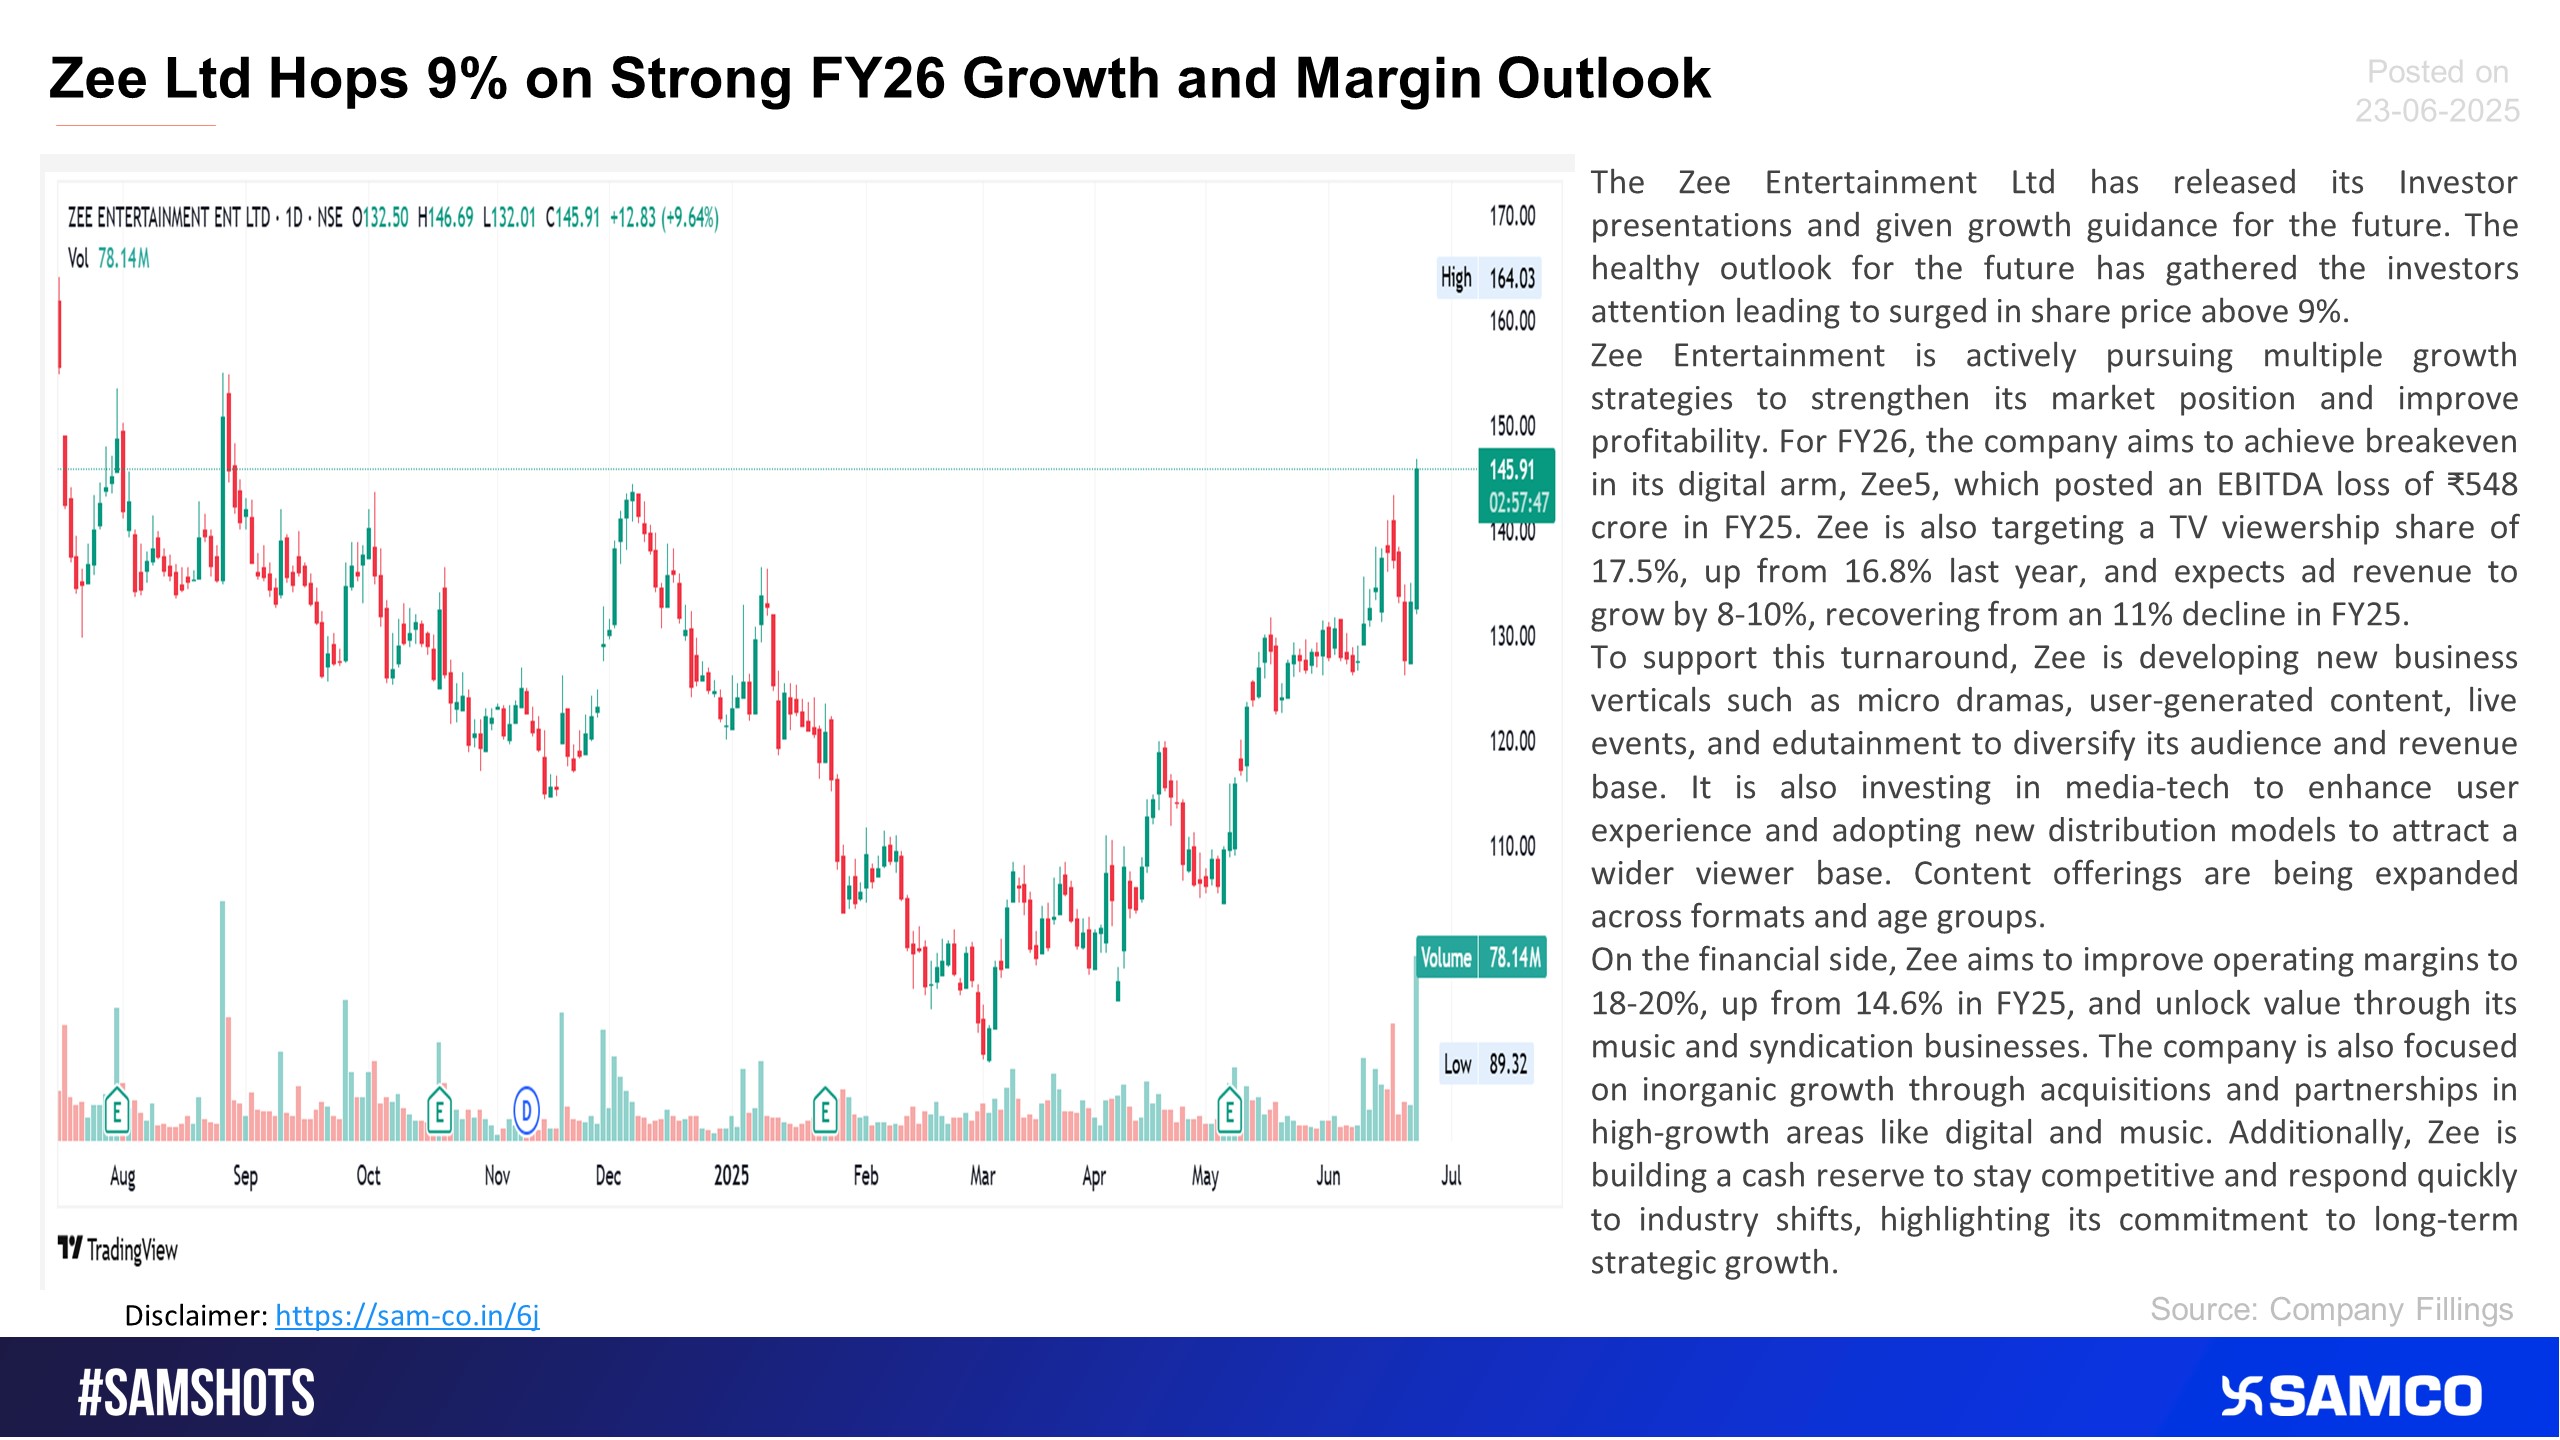
Here’s why ZEE Entertainment rallying since past few days.
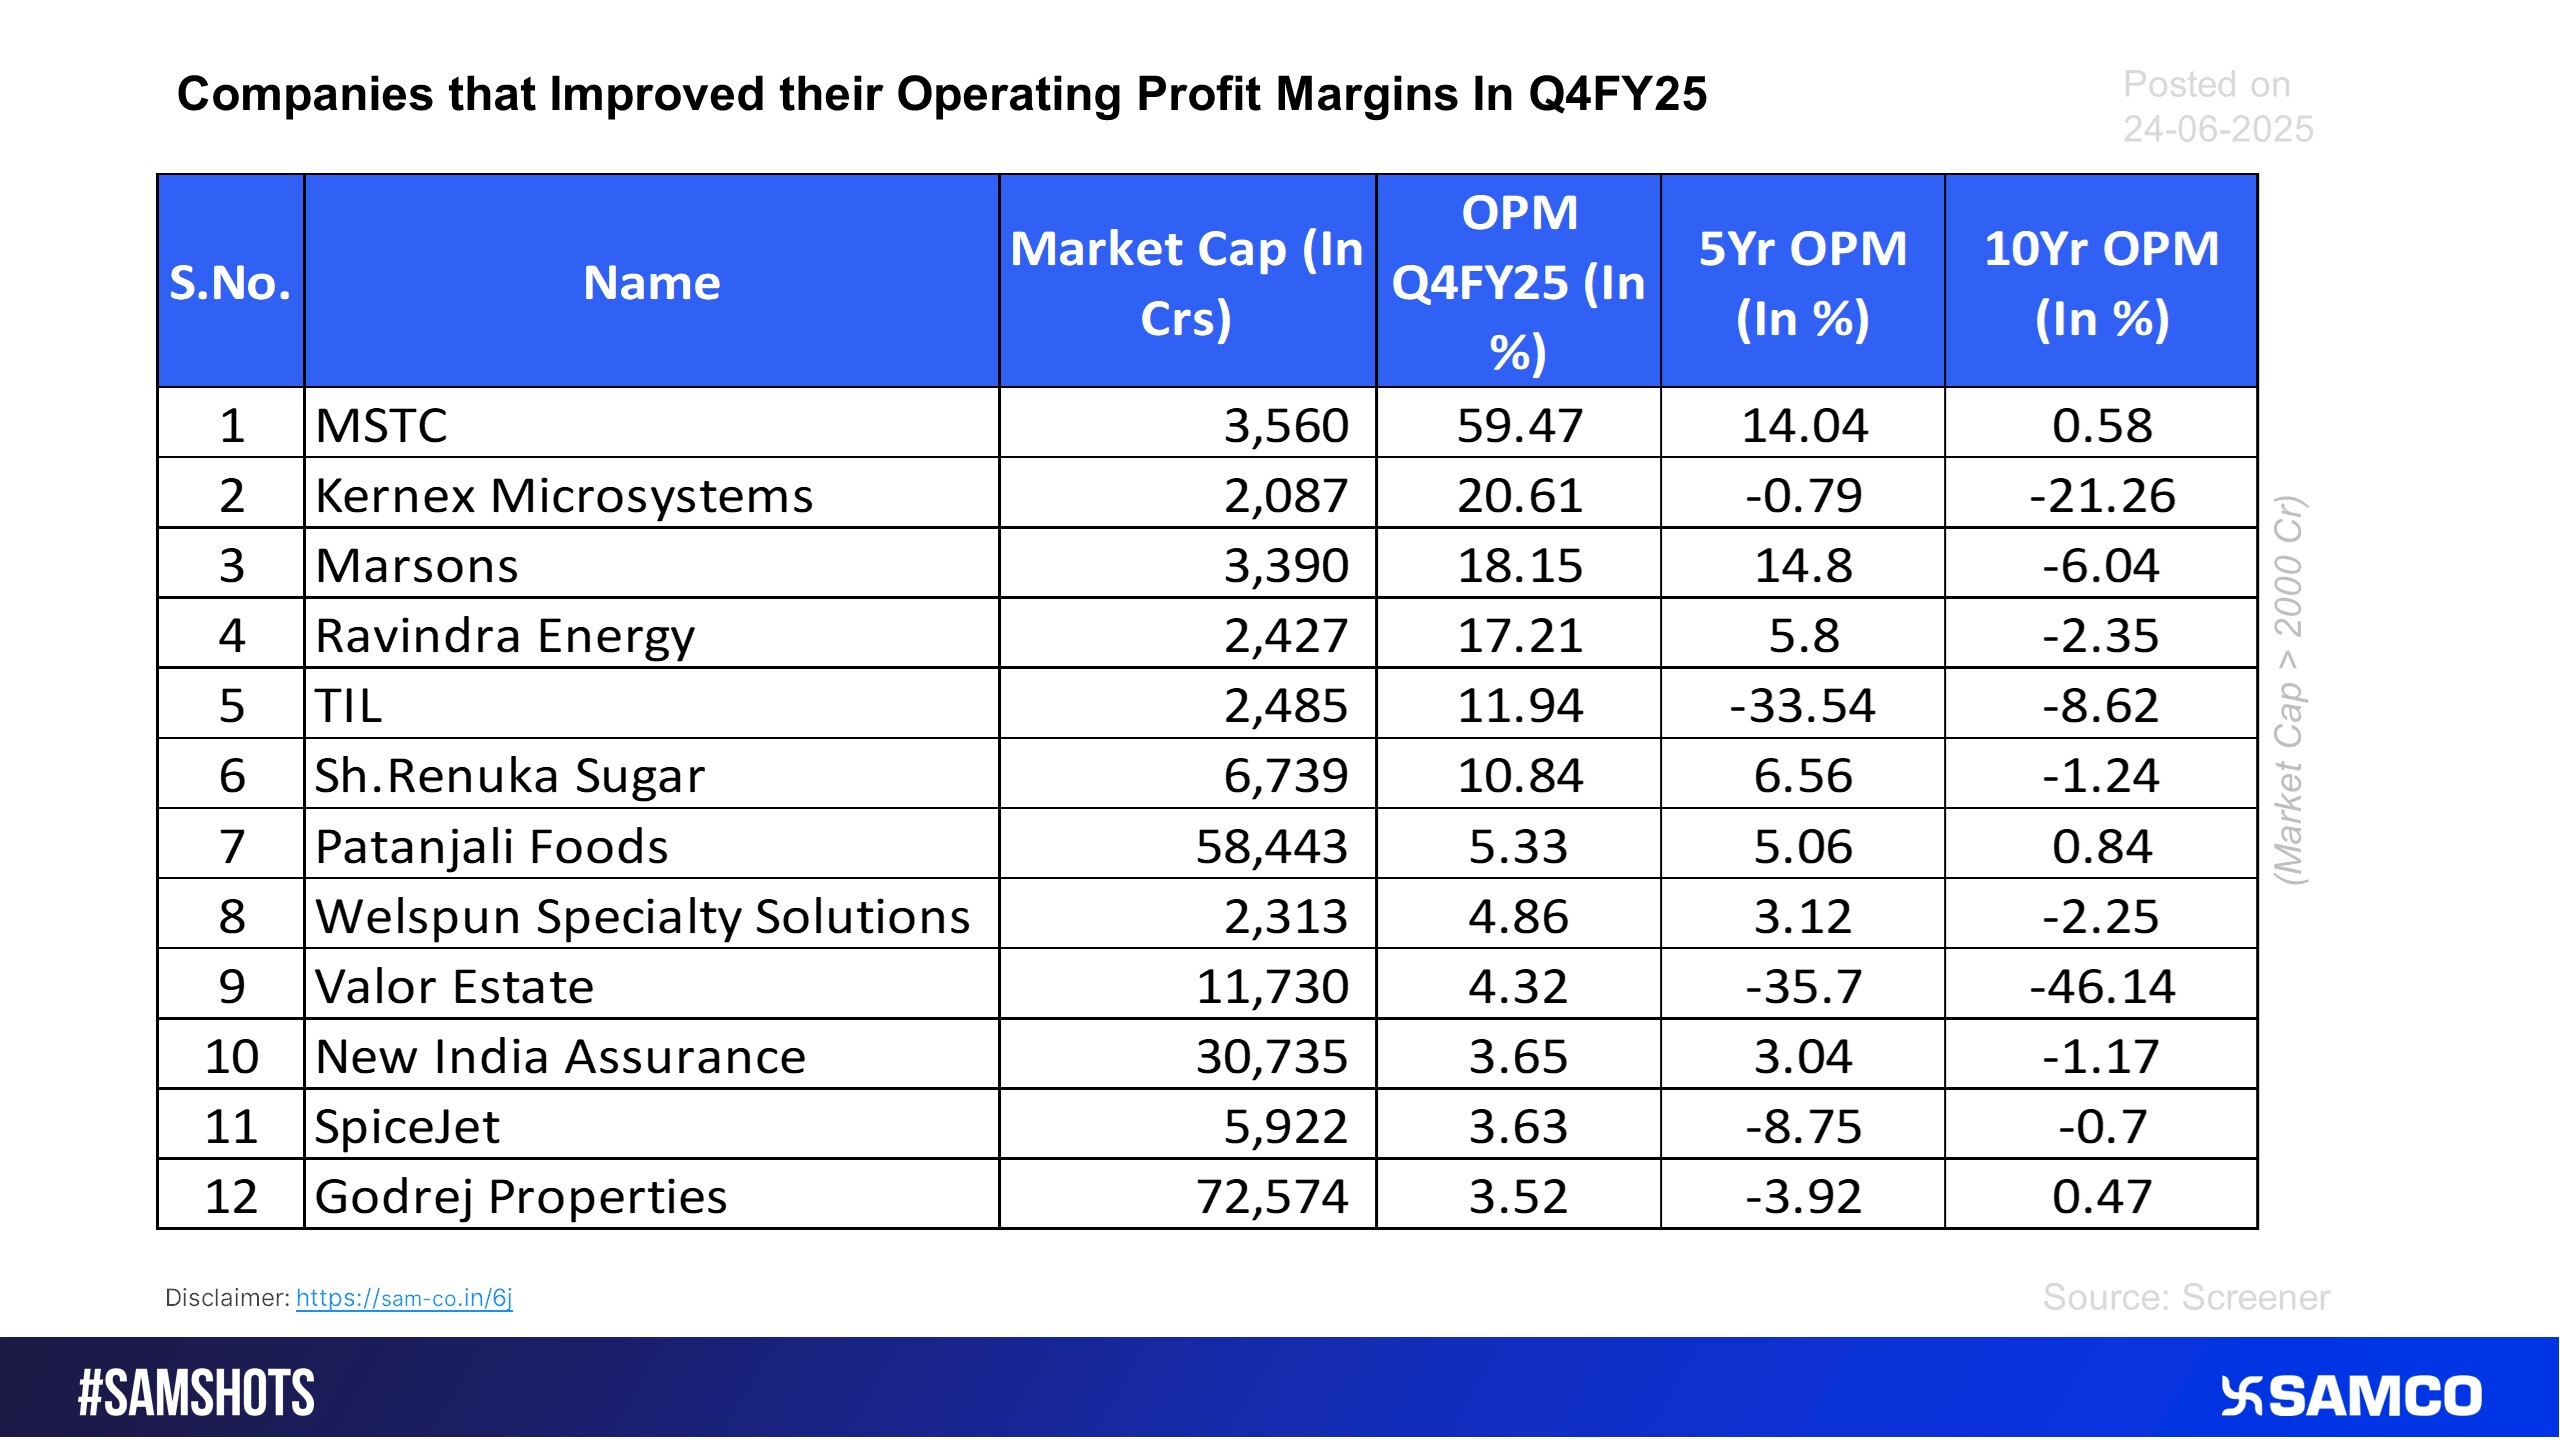
Here’s the overview of companies that reported improved Operating Profit Margins then its previous 5 & 10 year averages
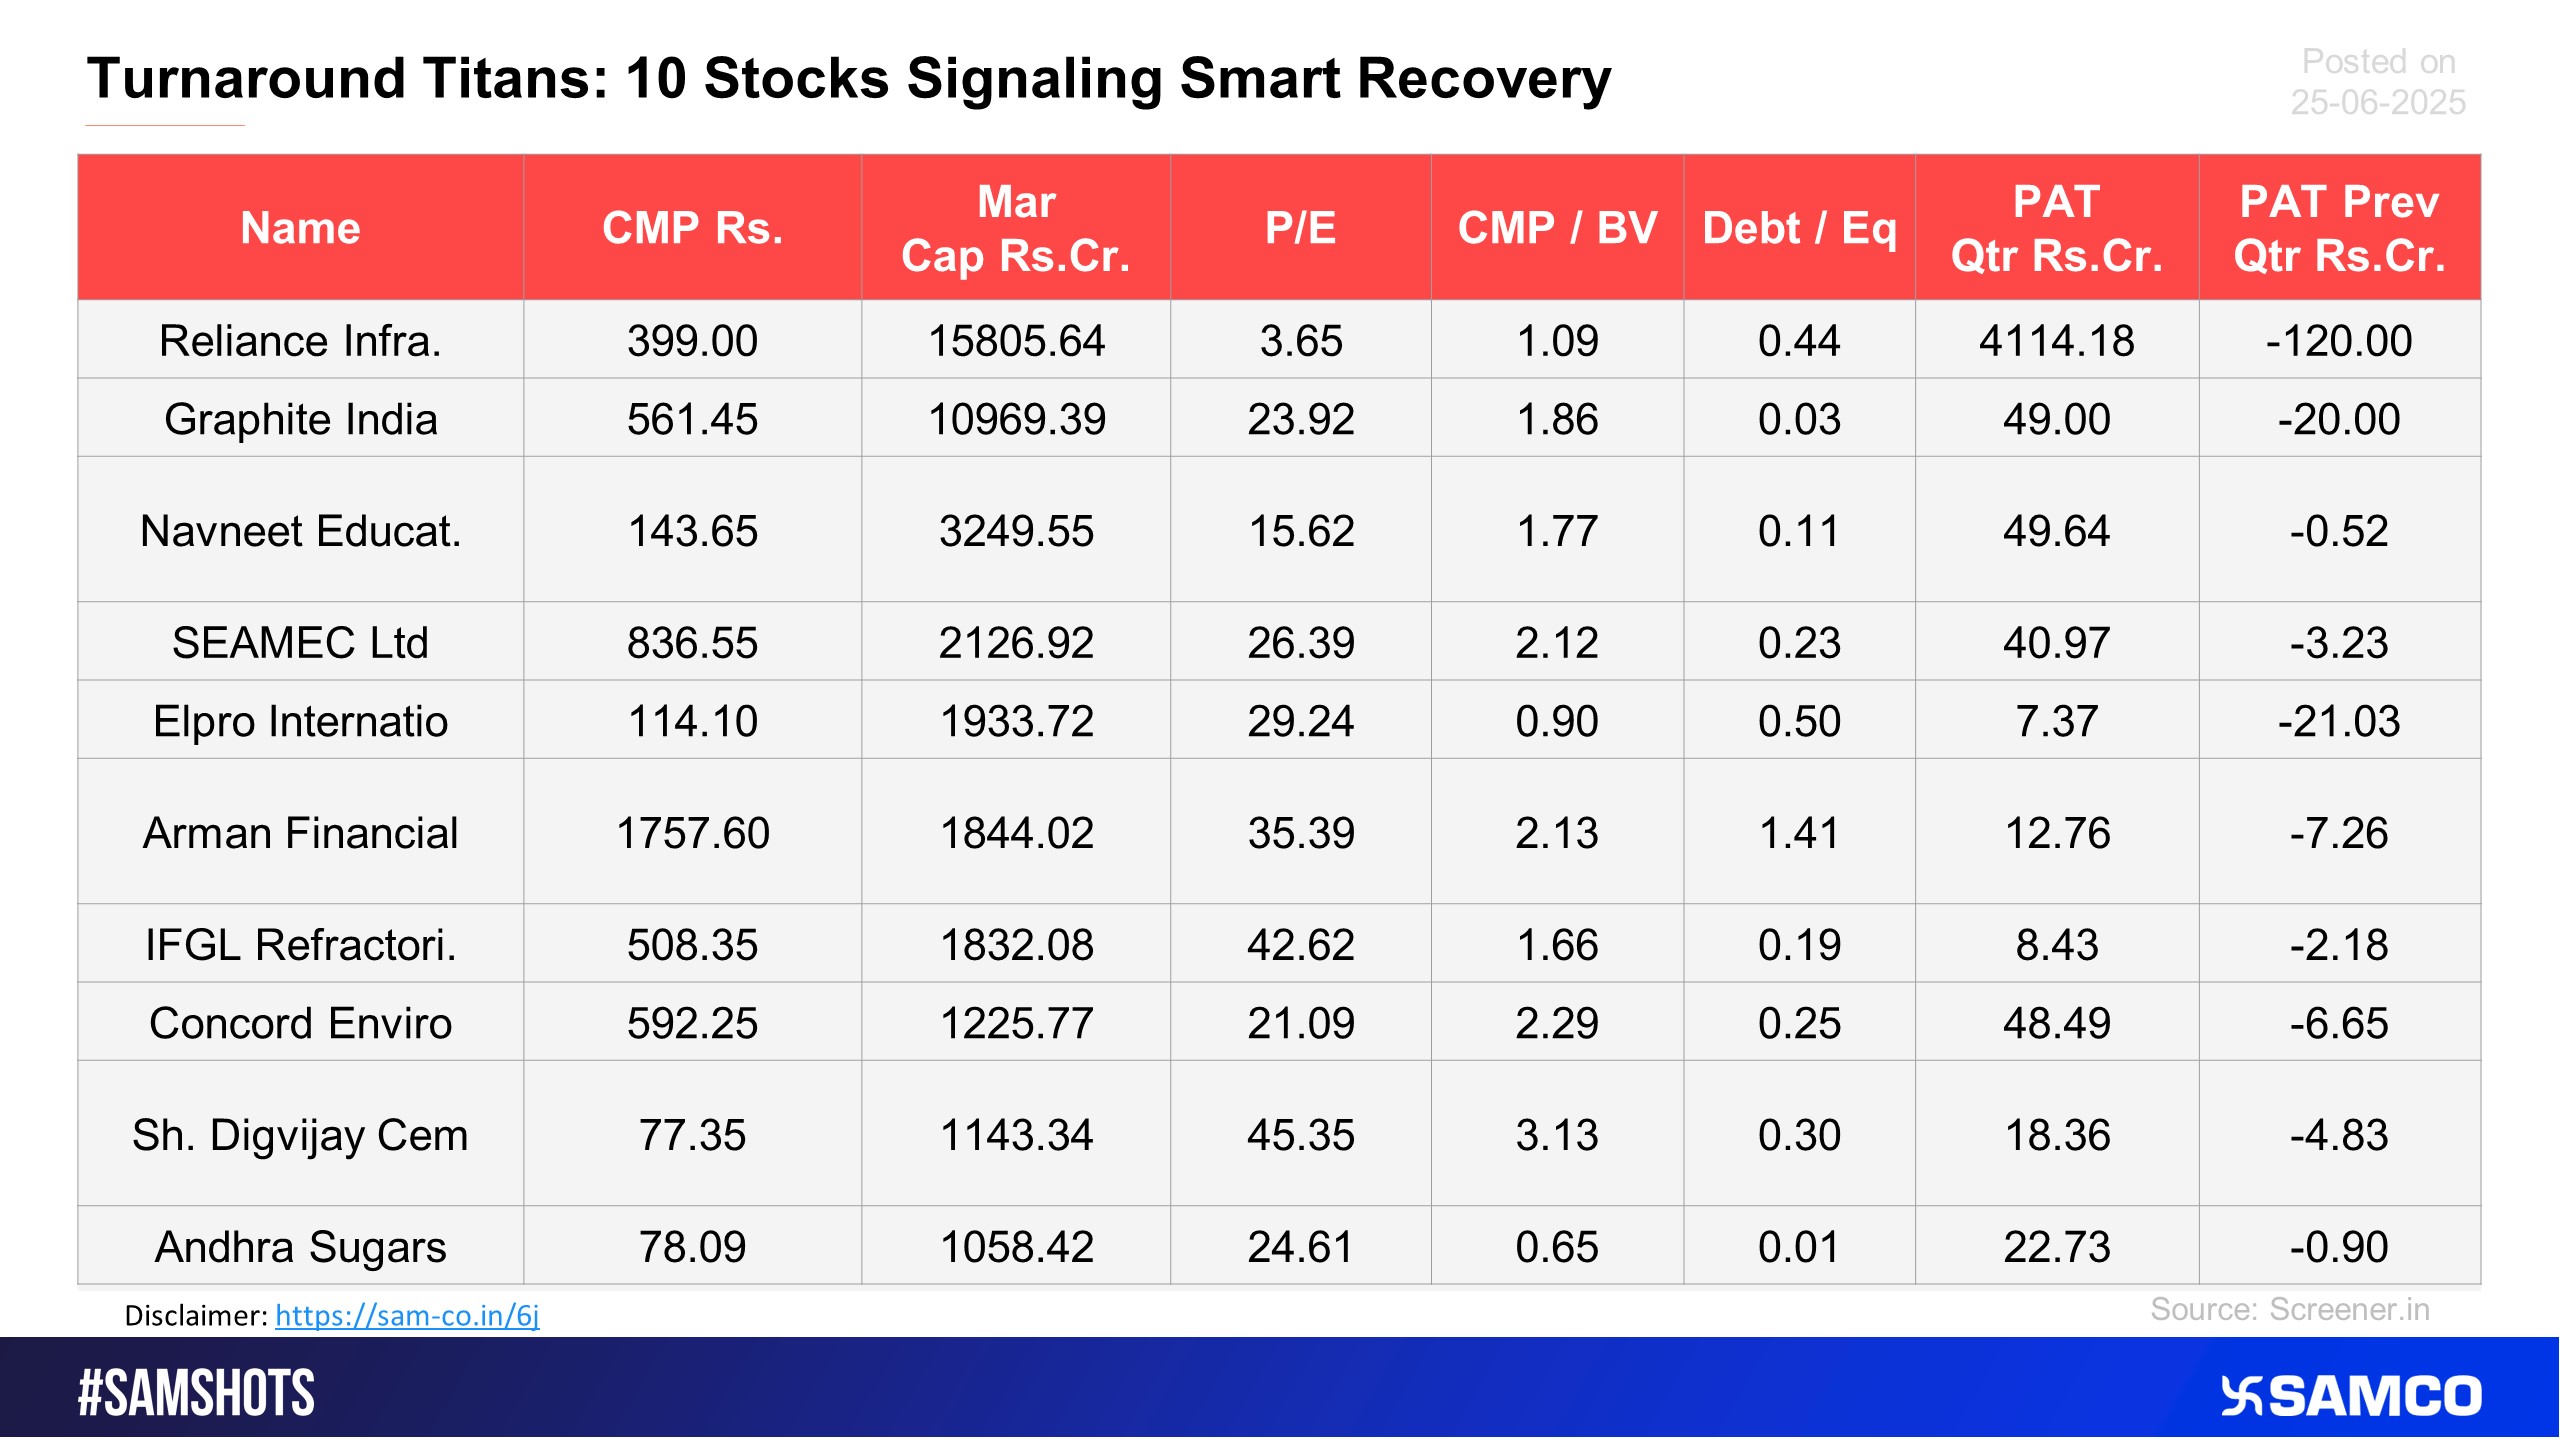
Here’s the list of companies which incurred loss in the previous quarters and turned profitable in latest Q4FY25.
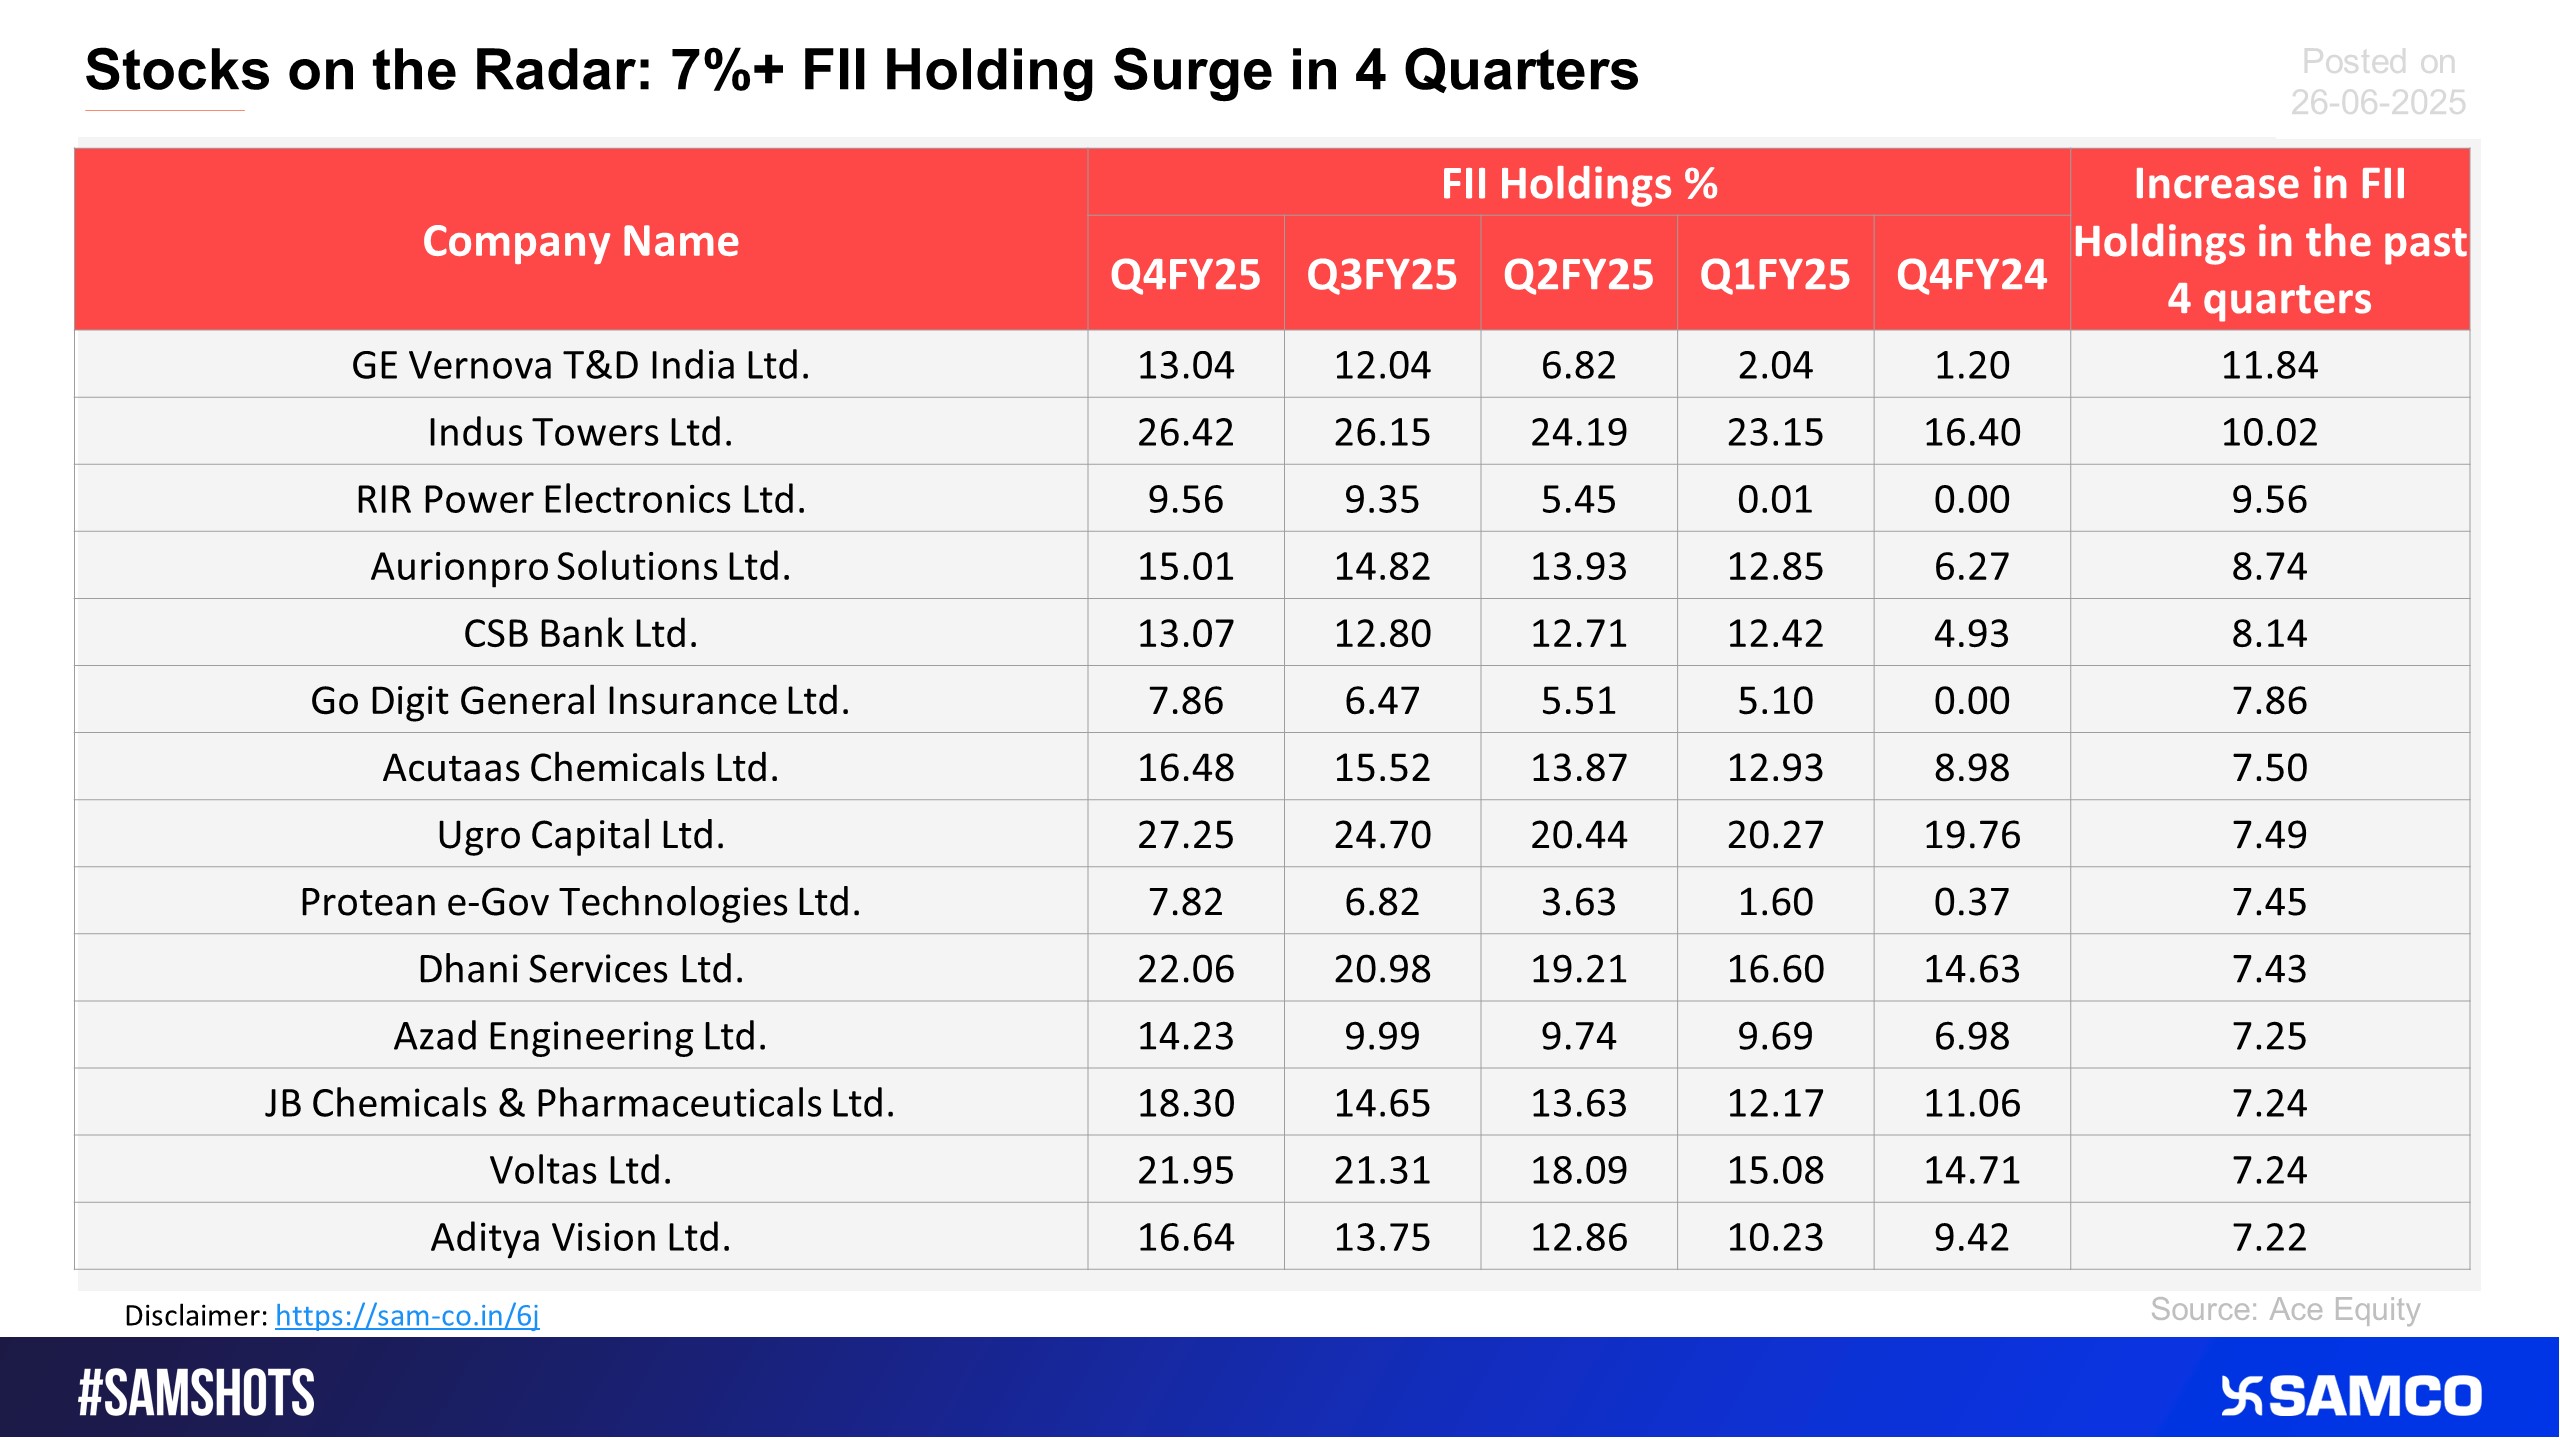
The below table shows the list of stocks which witnessed increased FII stakes consistently over the past 4 quarter.
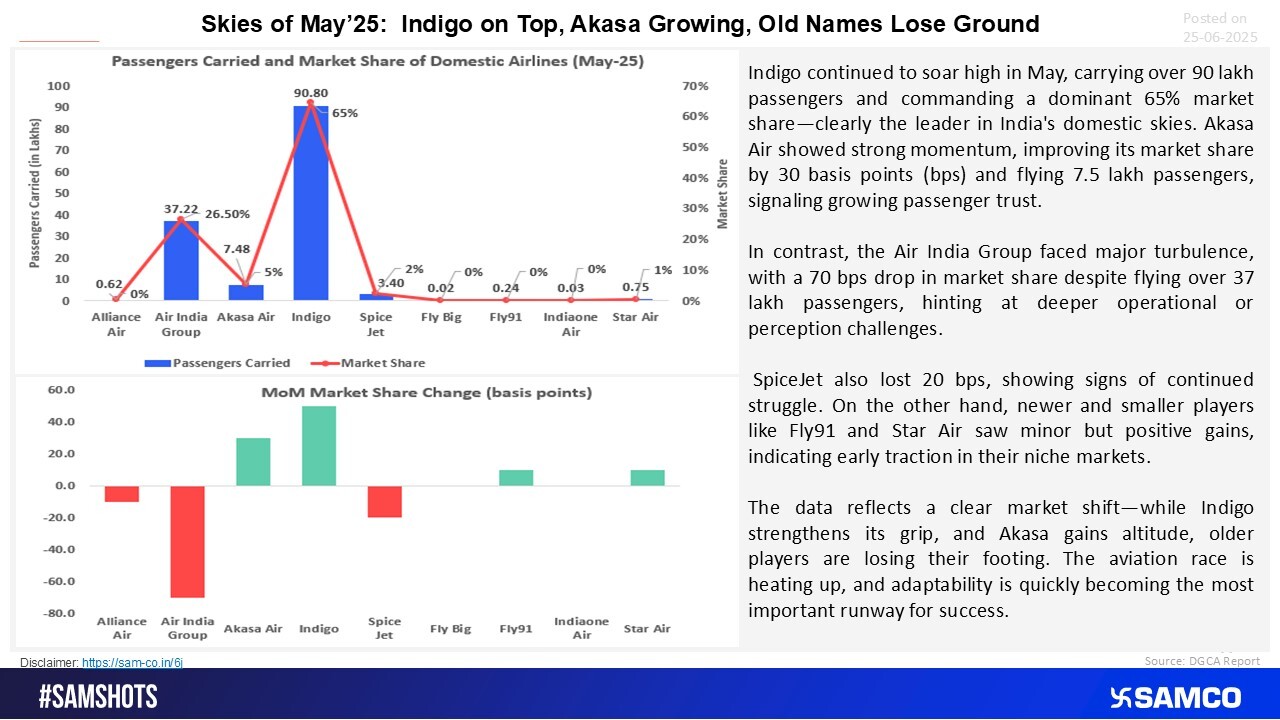
May Snapshot: Indigo Dominates, Akasa Grows, Air India Slips
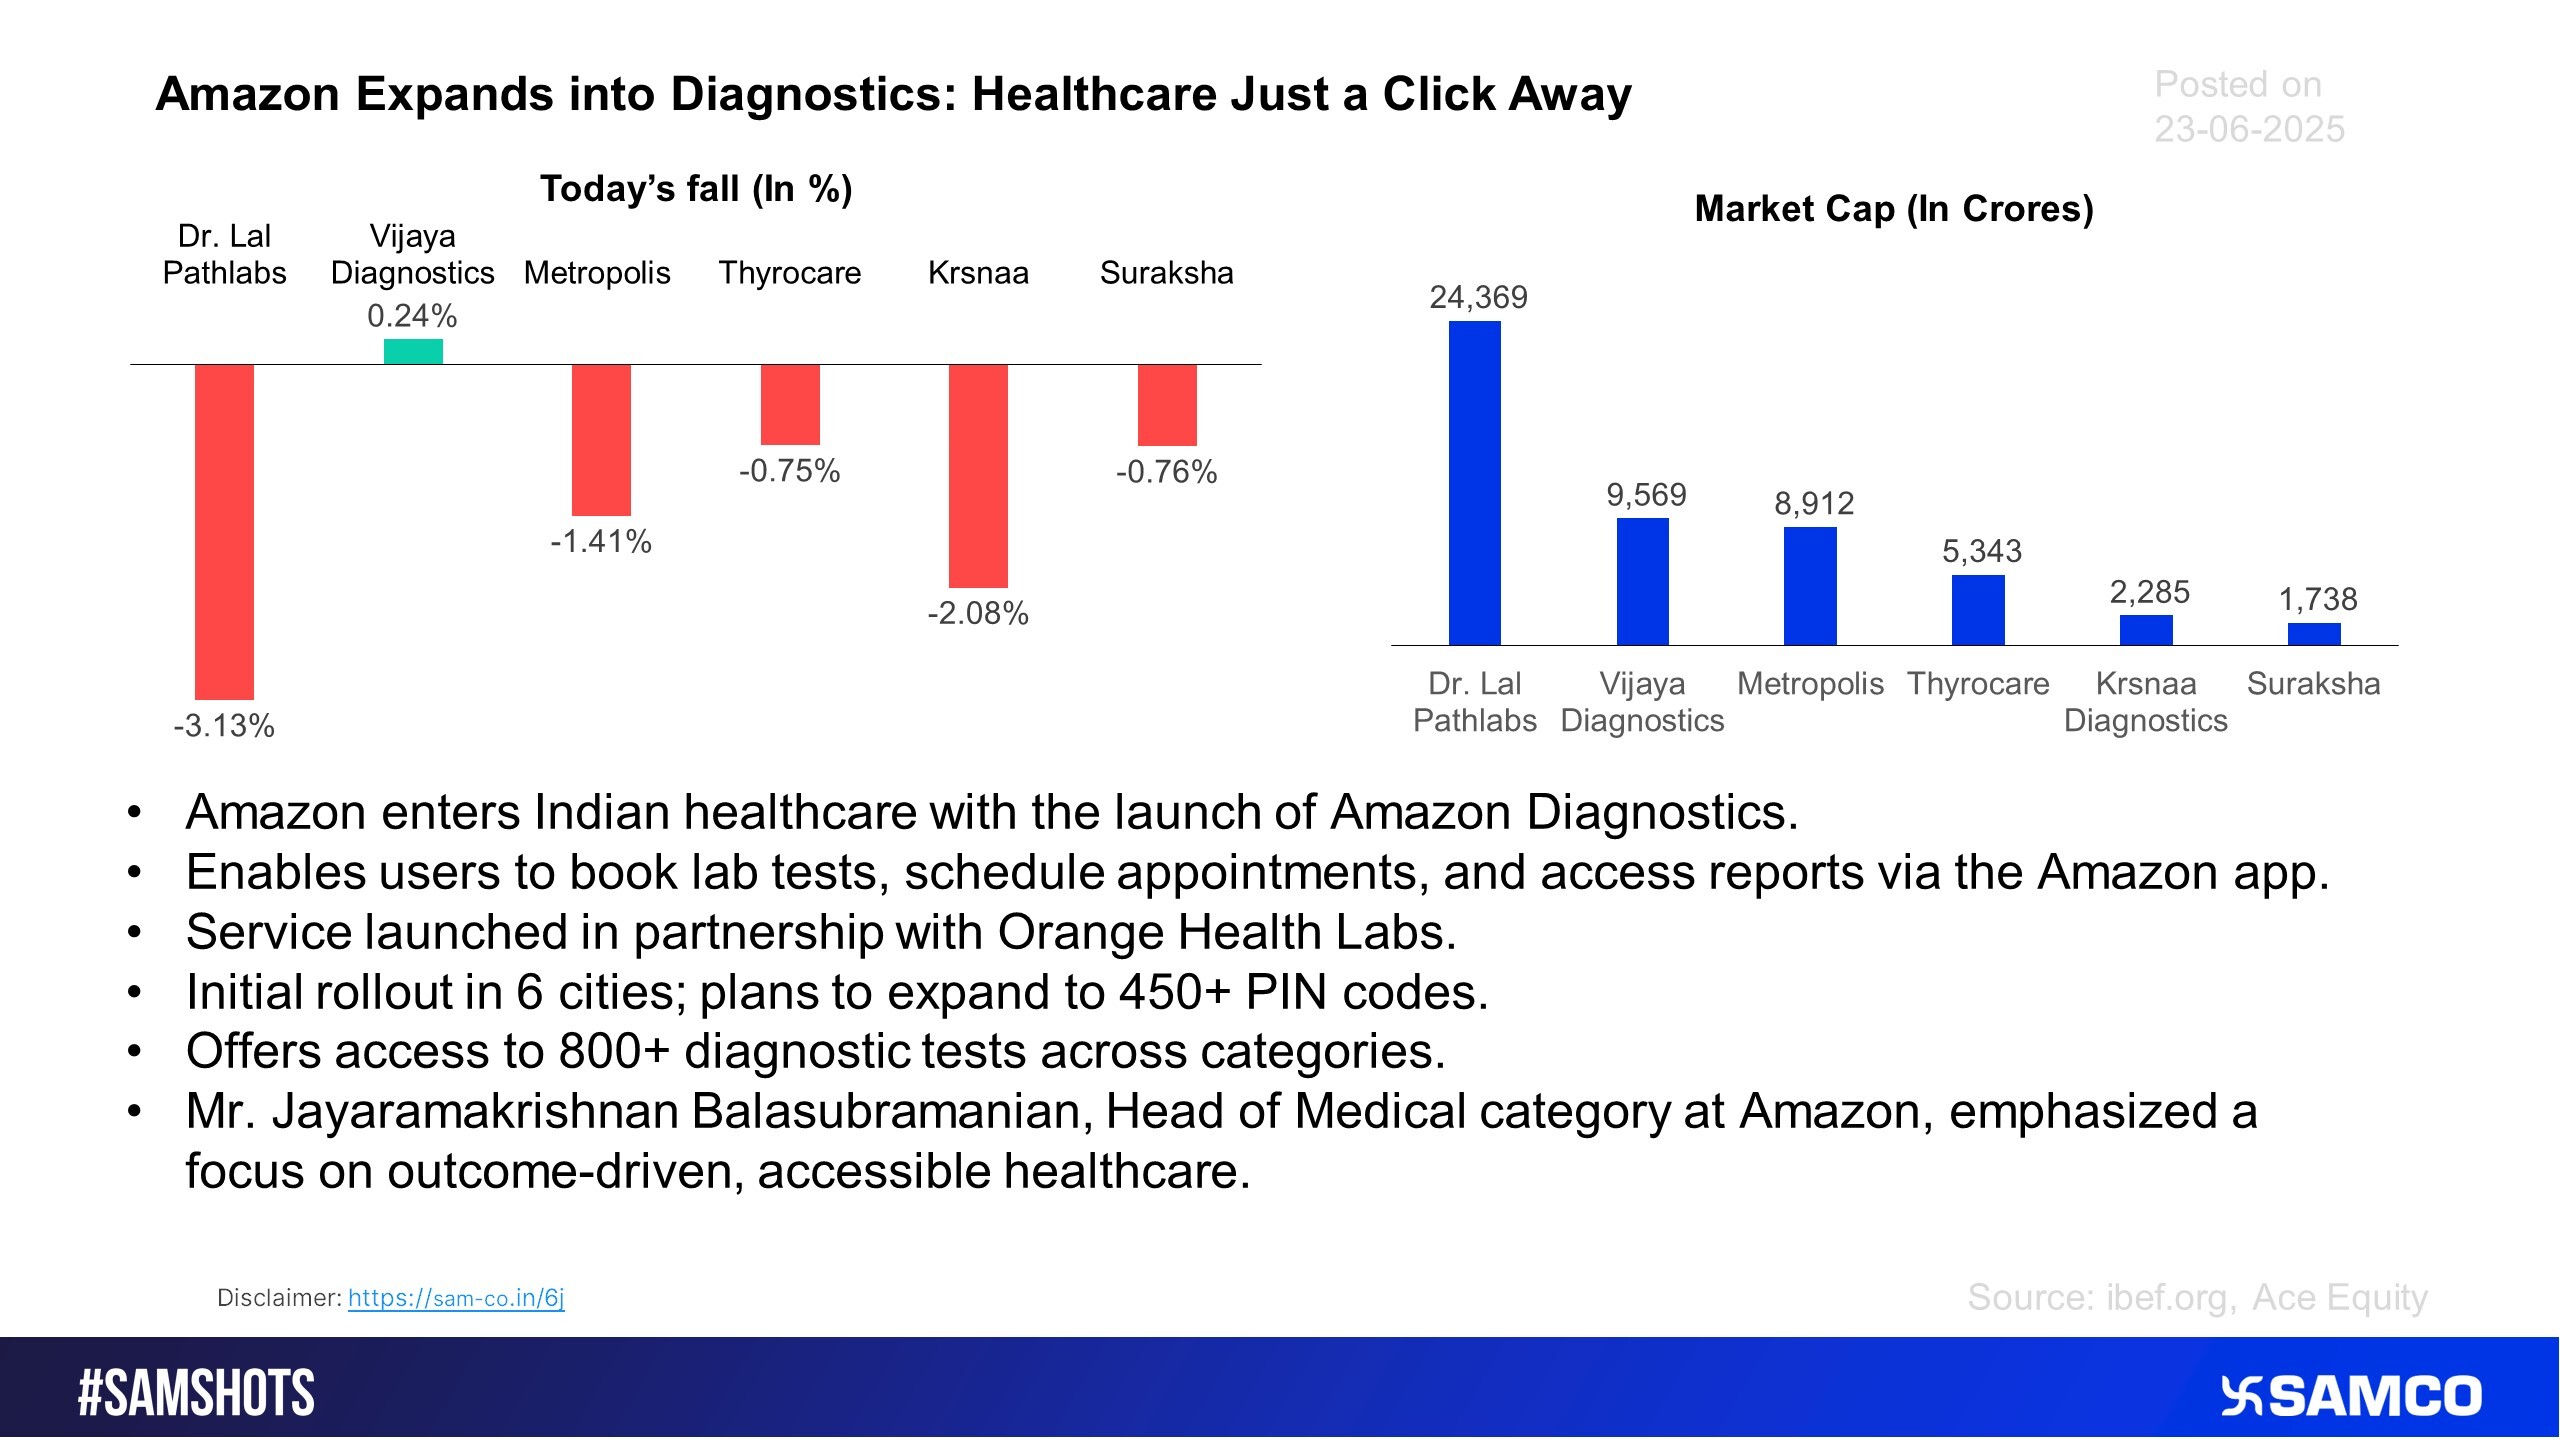
The new beginning of Amazon India by enterring into Diagnostics services
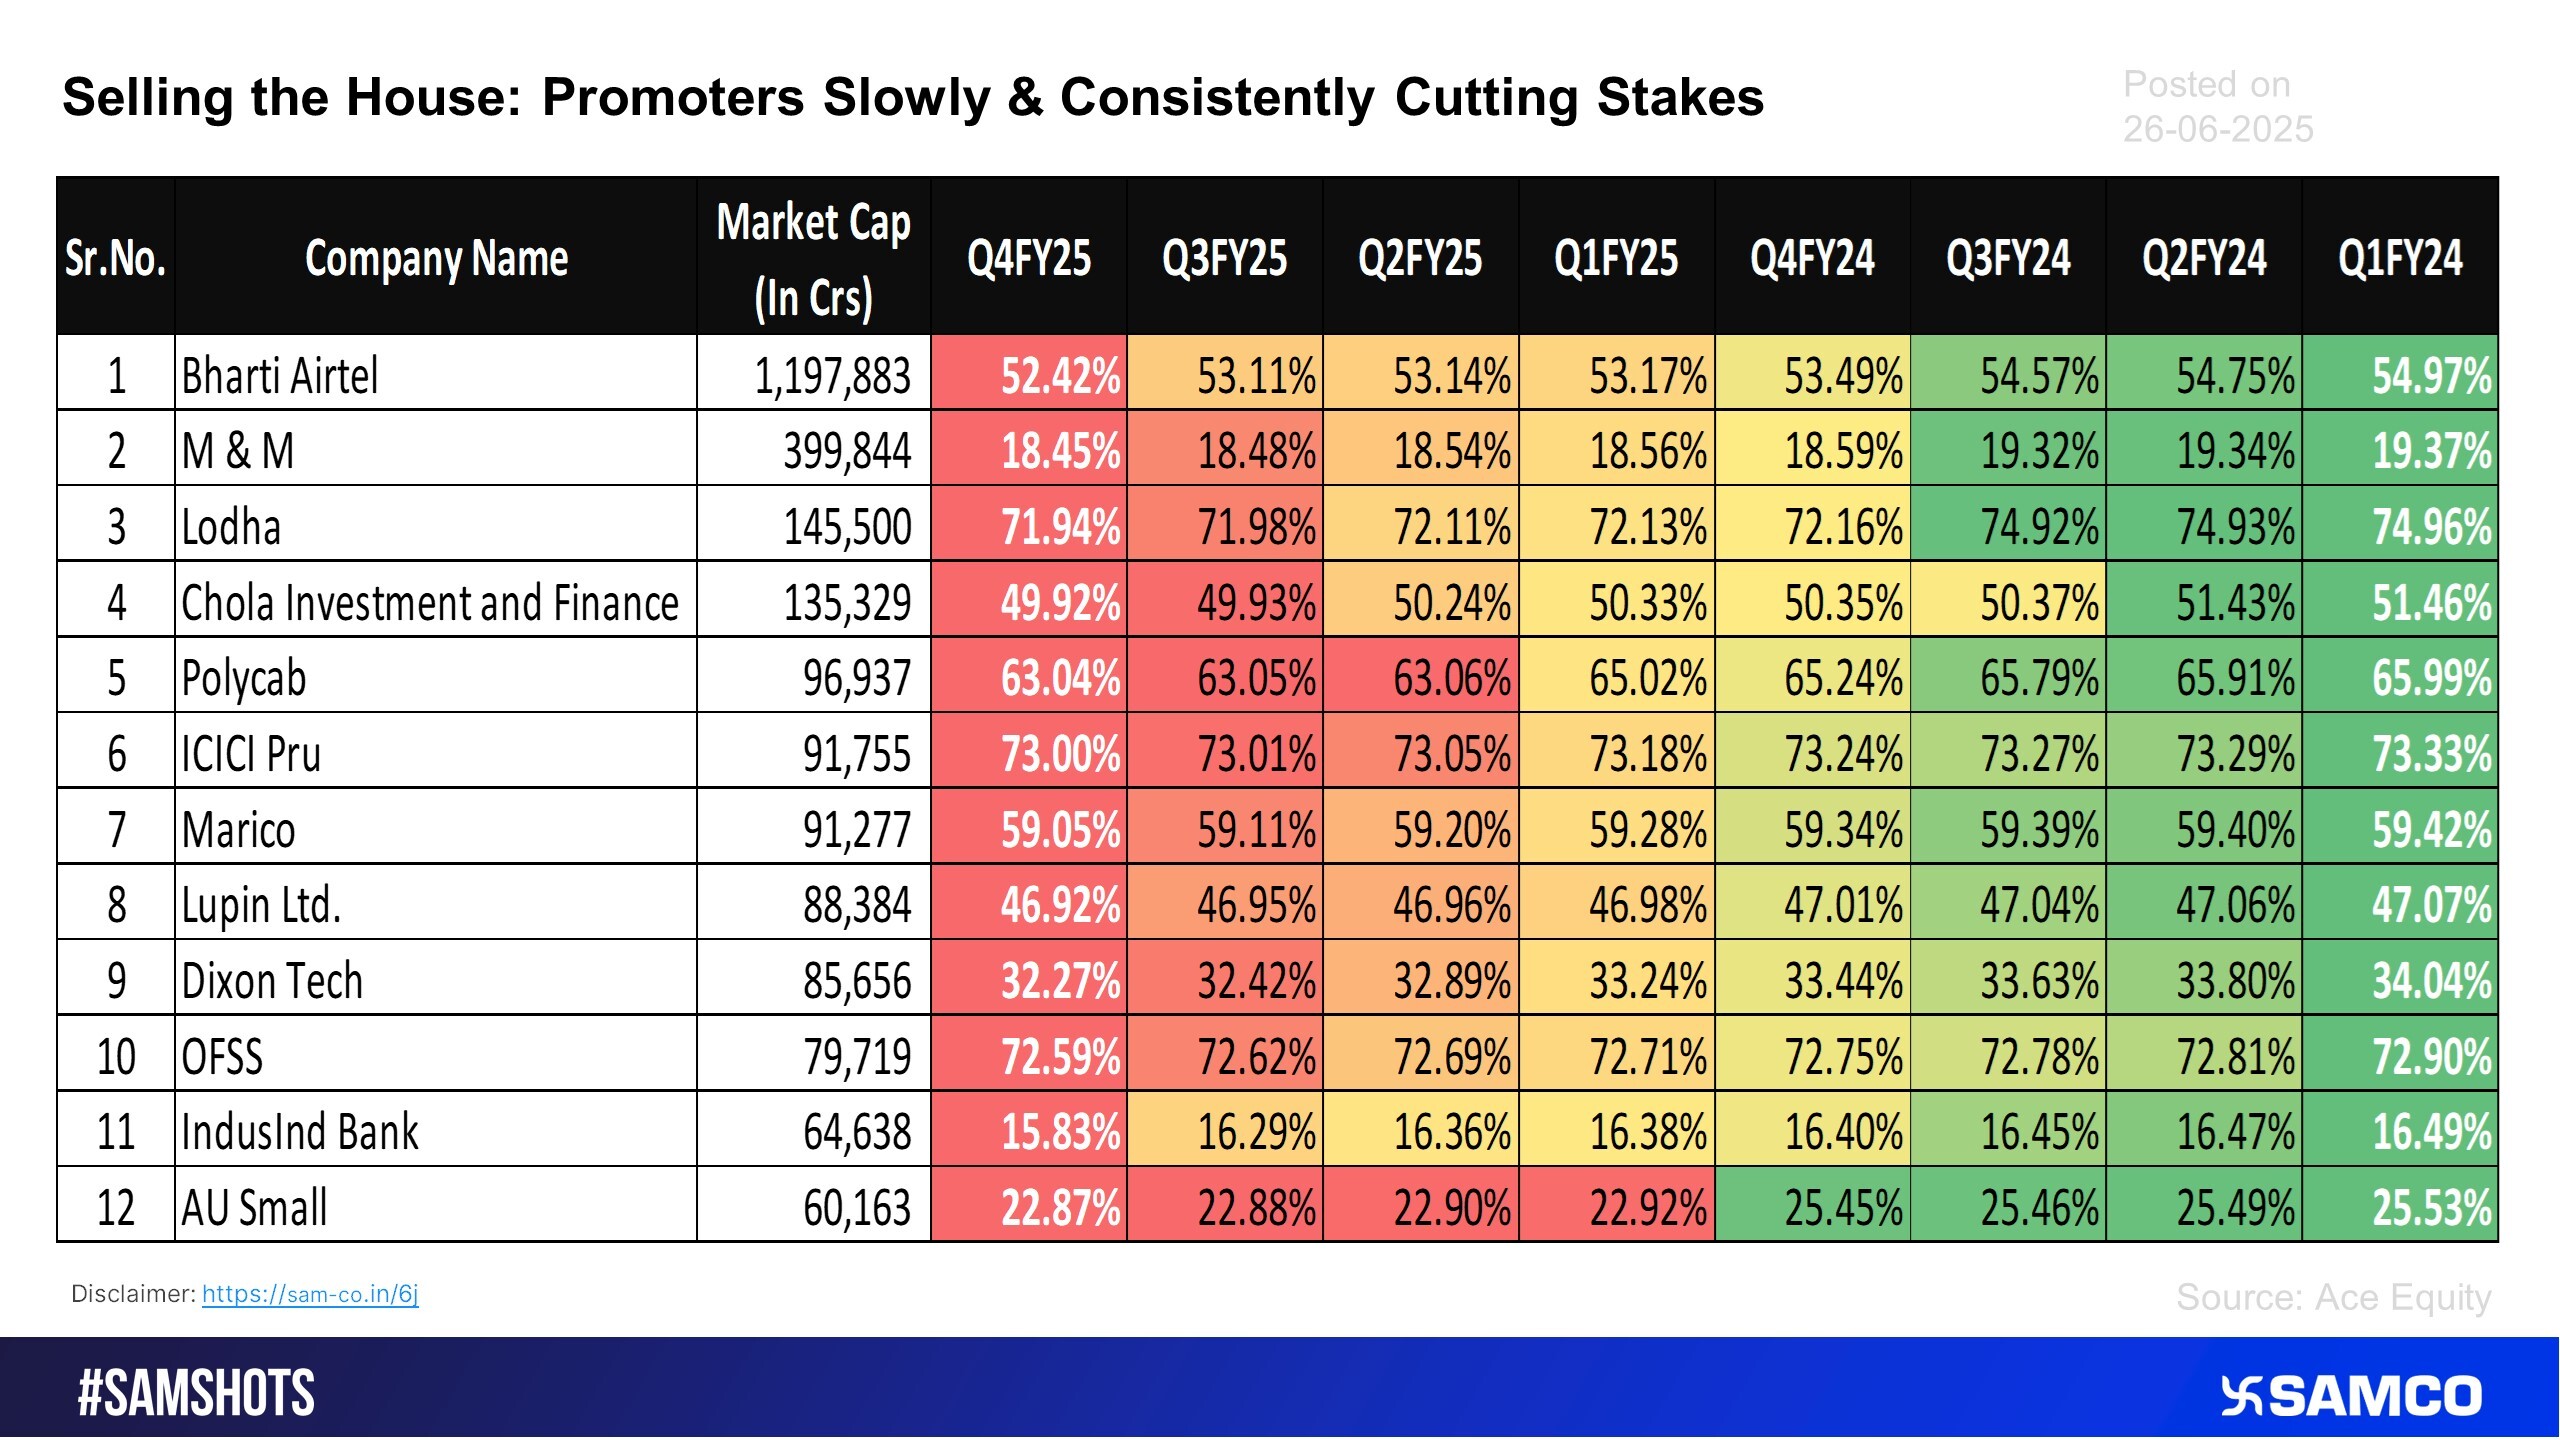
Here’s the list of companies in which the promoters are selling their slowly & consistently
The accompanying chart presents the quarter performance of different sectors in 2nd Qtr
The chart displays the forward returns of Nifty 50 post 10000 crores IPO in the market
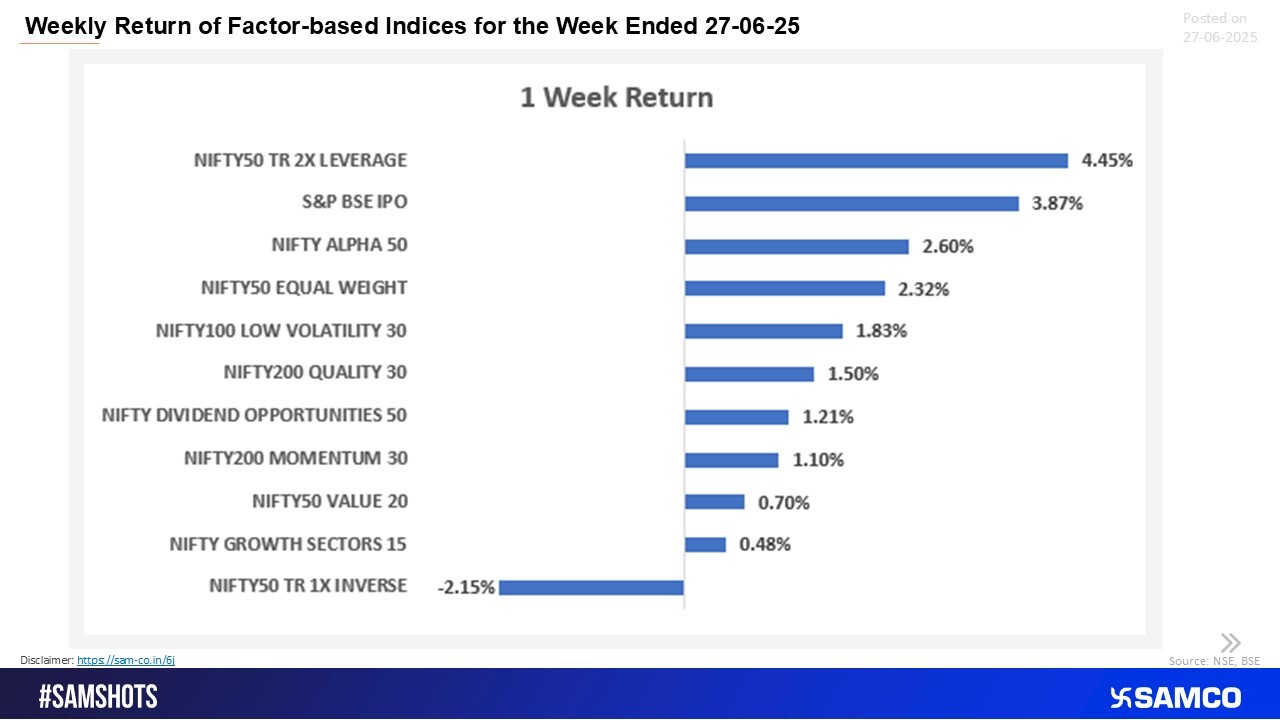
Here’s a snapshot of the weekly performance of Factor Based indices
Here’s a snapshot of the weekly performance of sectoral indices
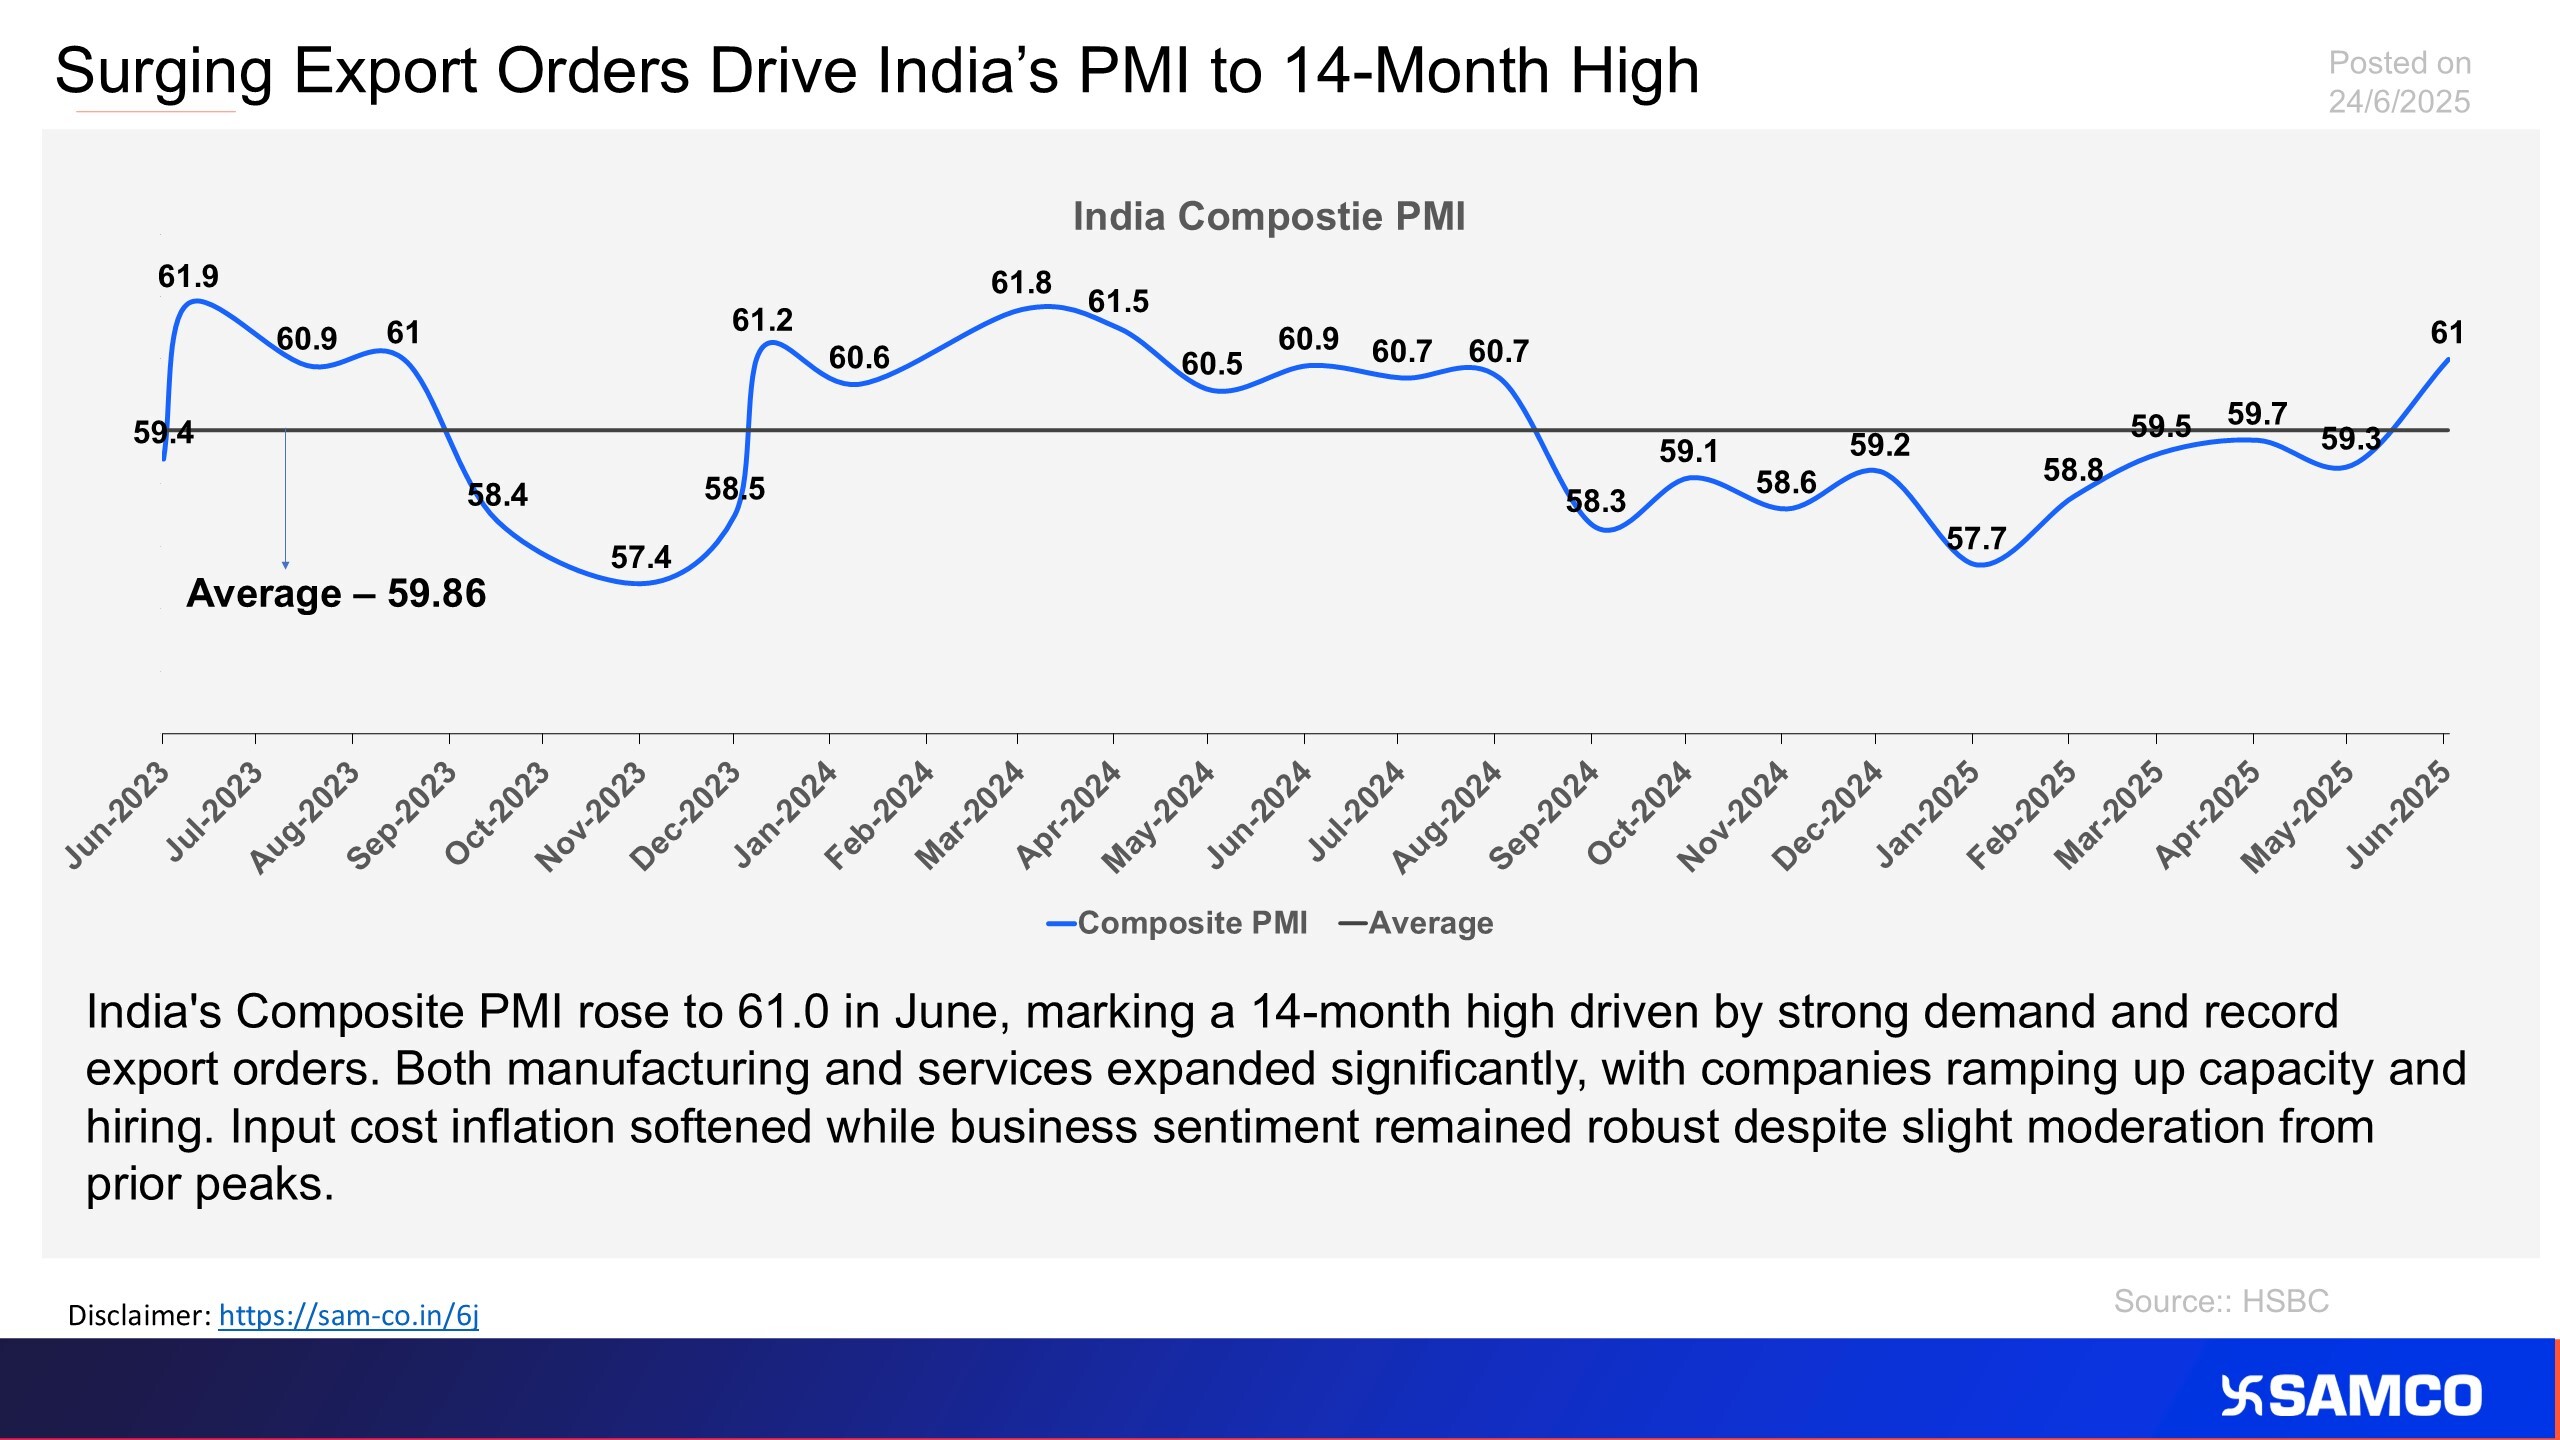
India Composite PMI reaches 14-month high on account of export
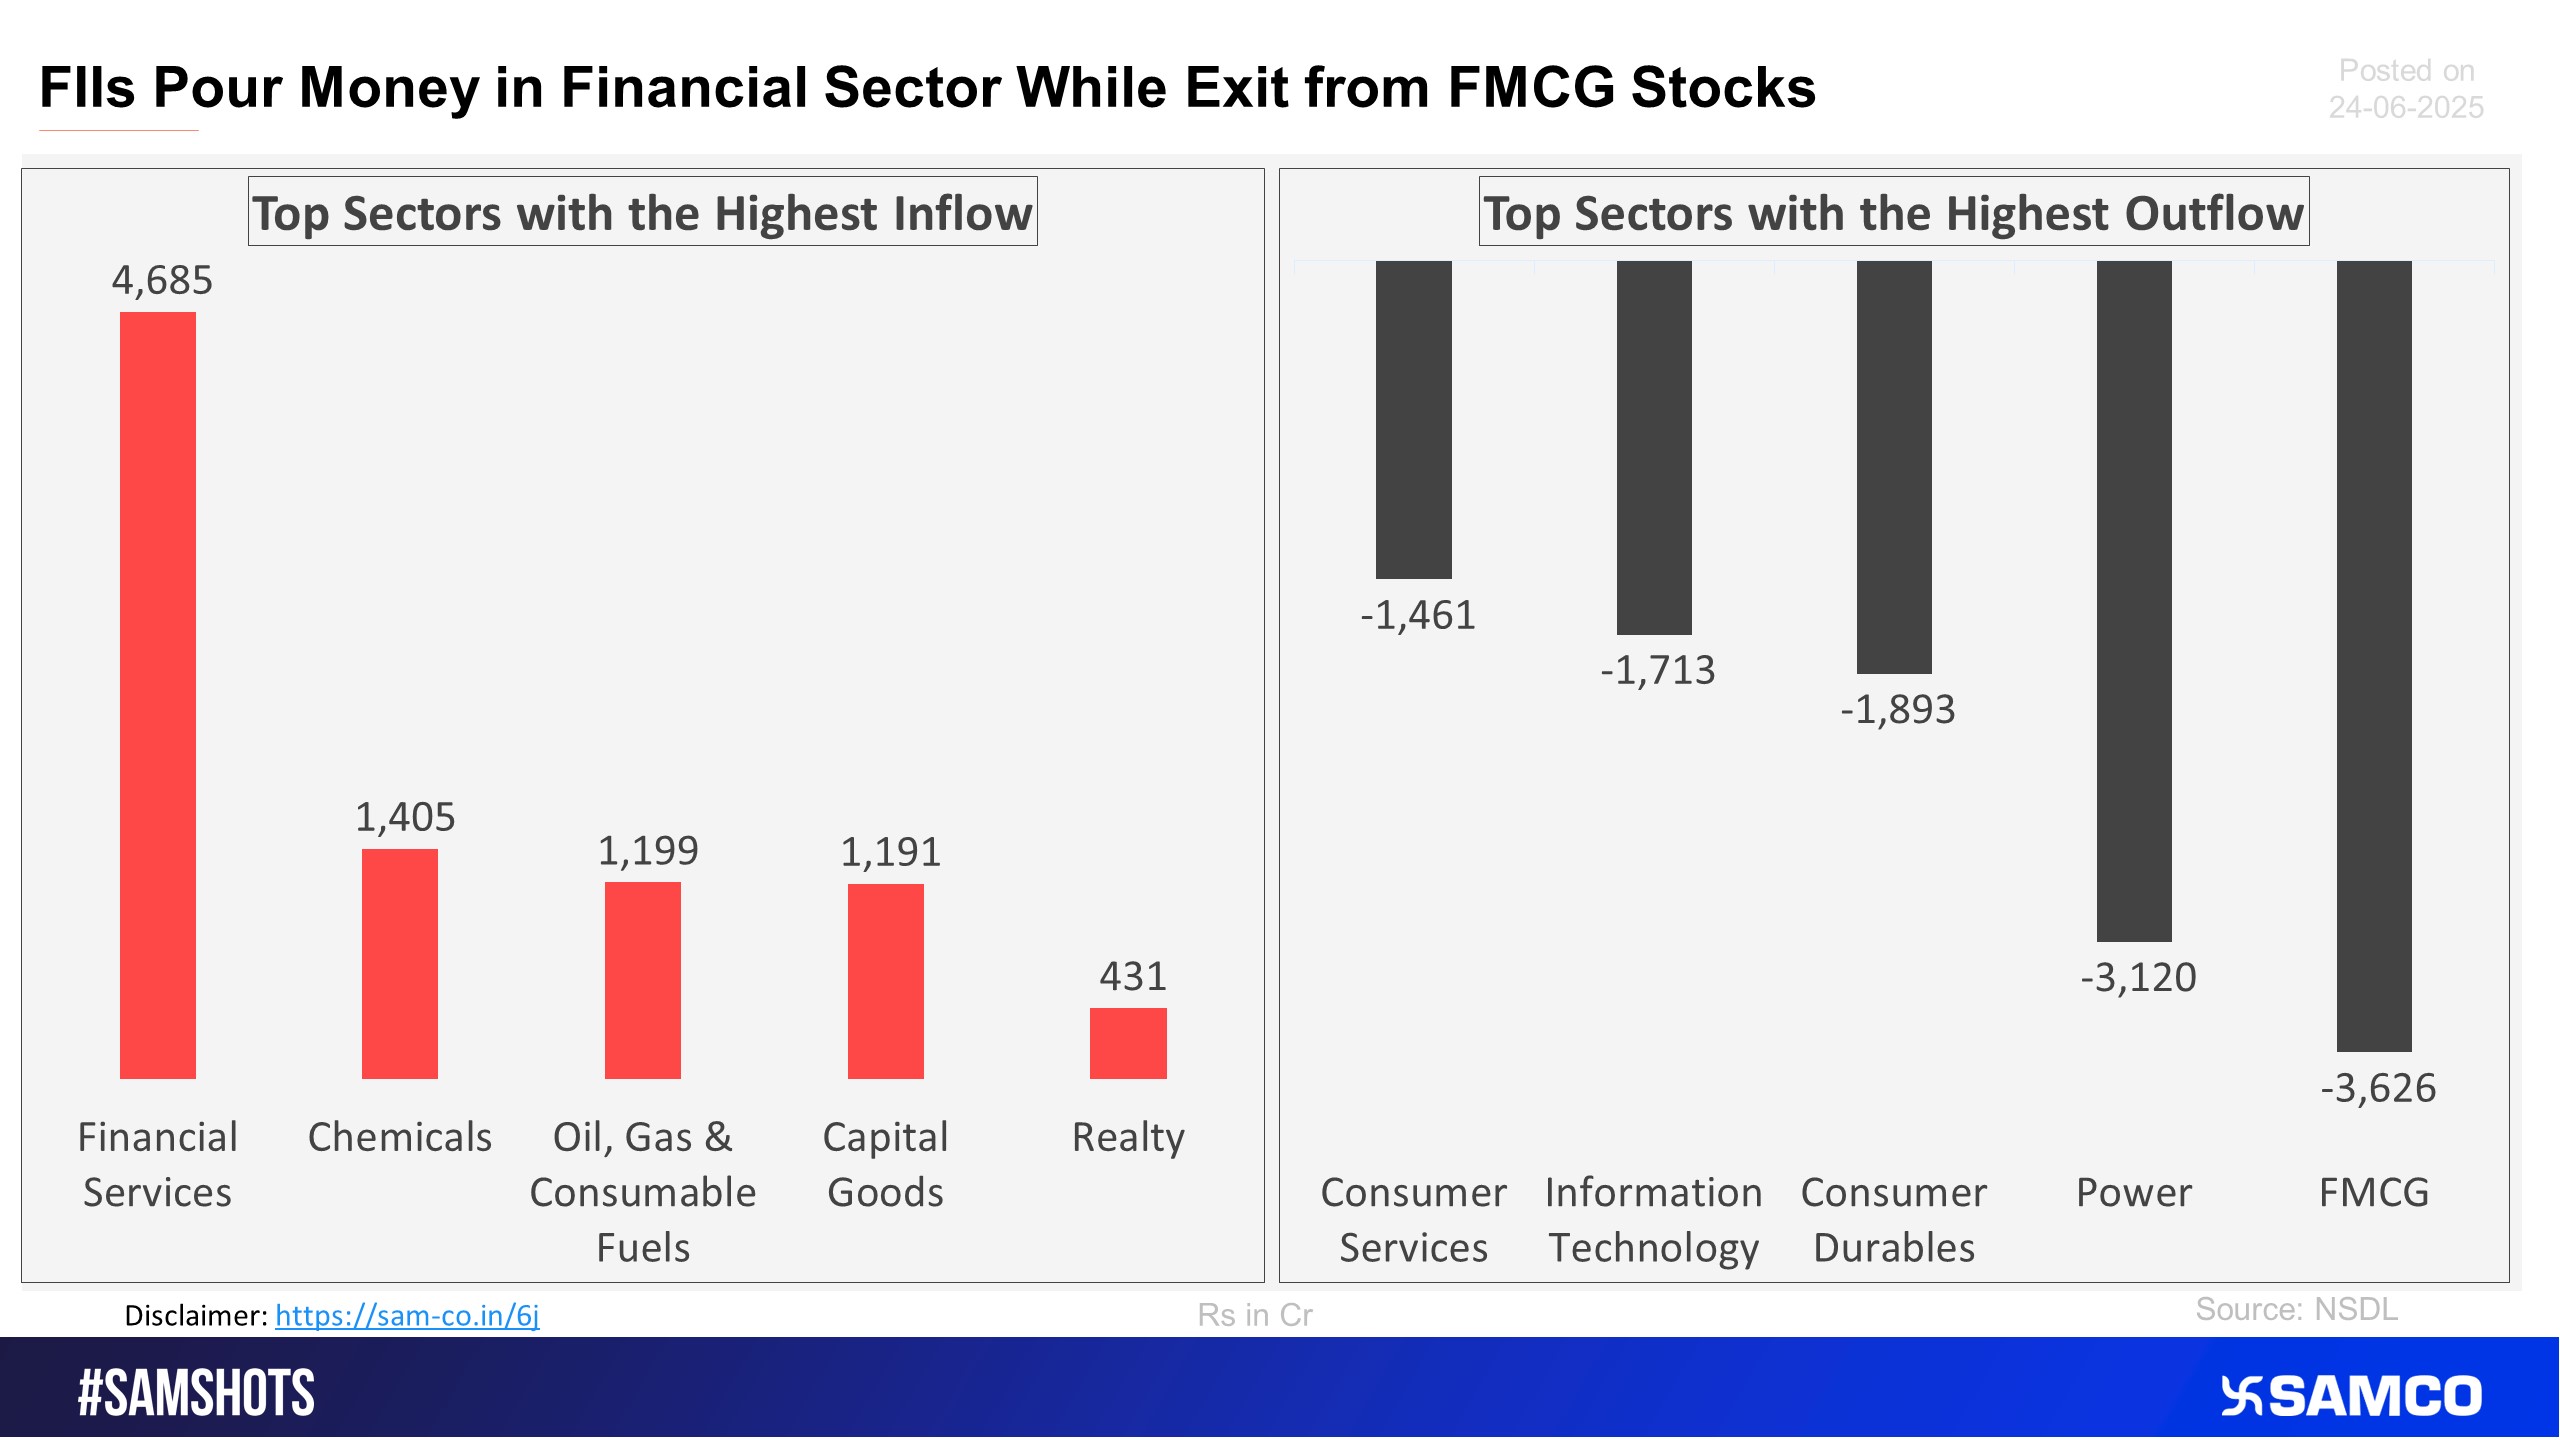
The accompanying chart shows the top 5 sectors that witnessed FPI’s highest inflow and outflow in the latest quarter.
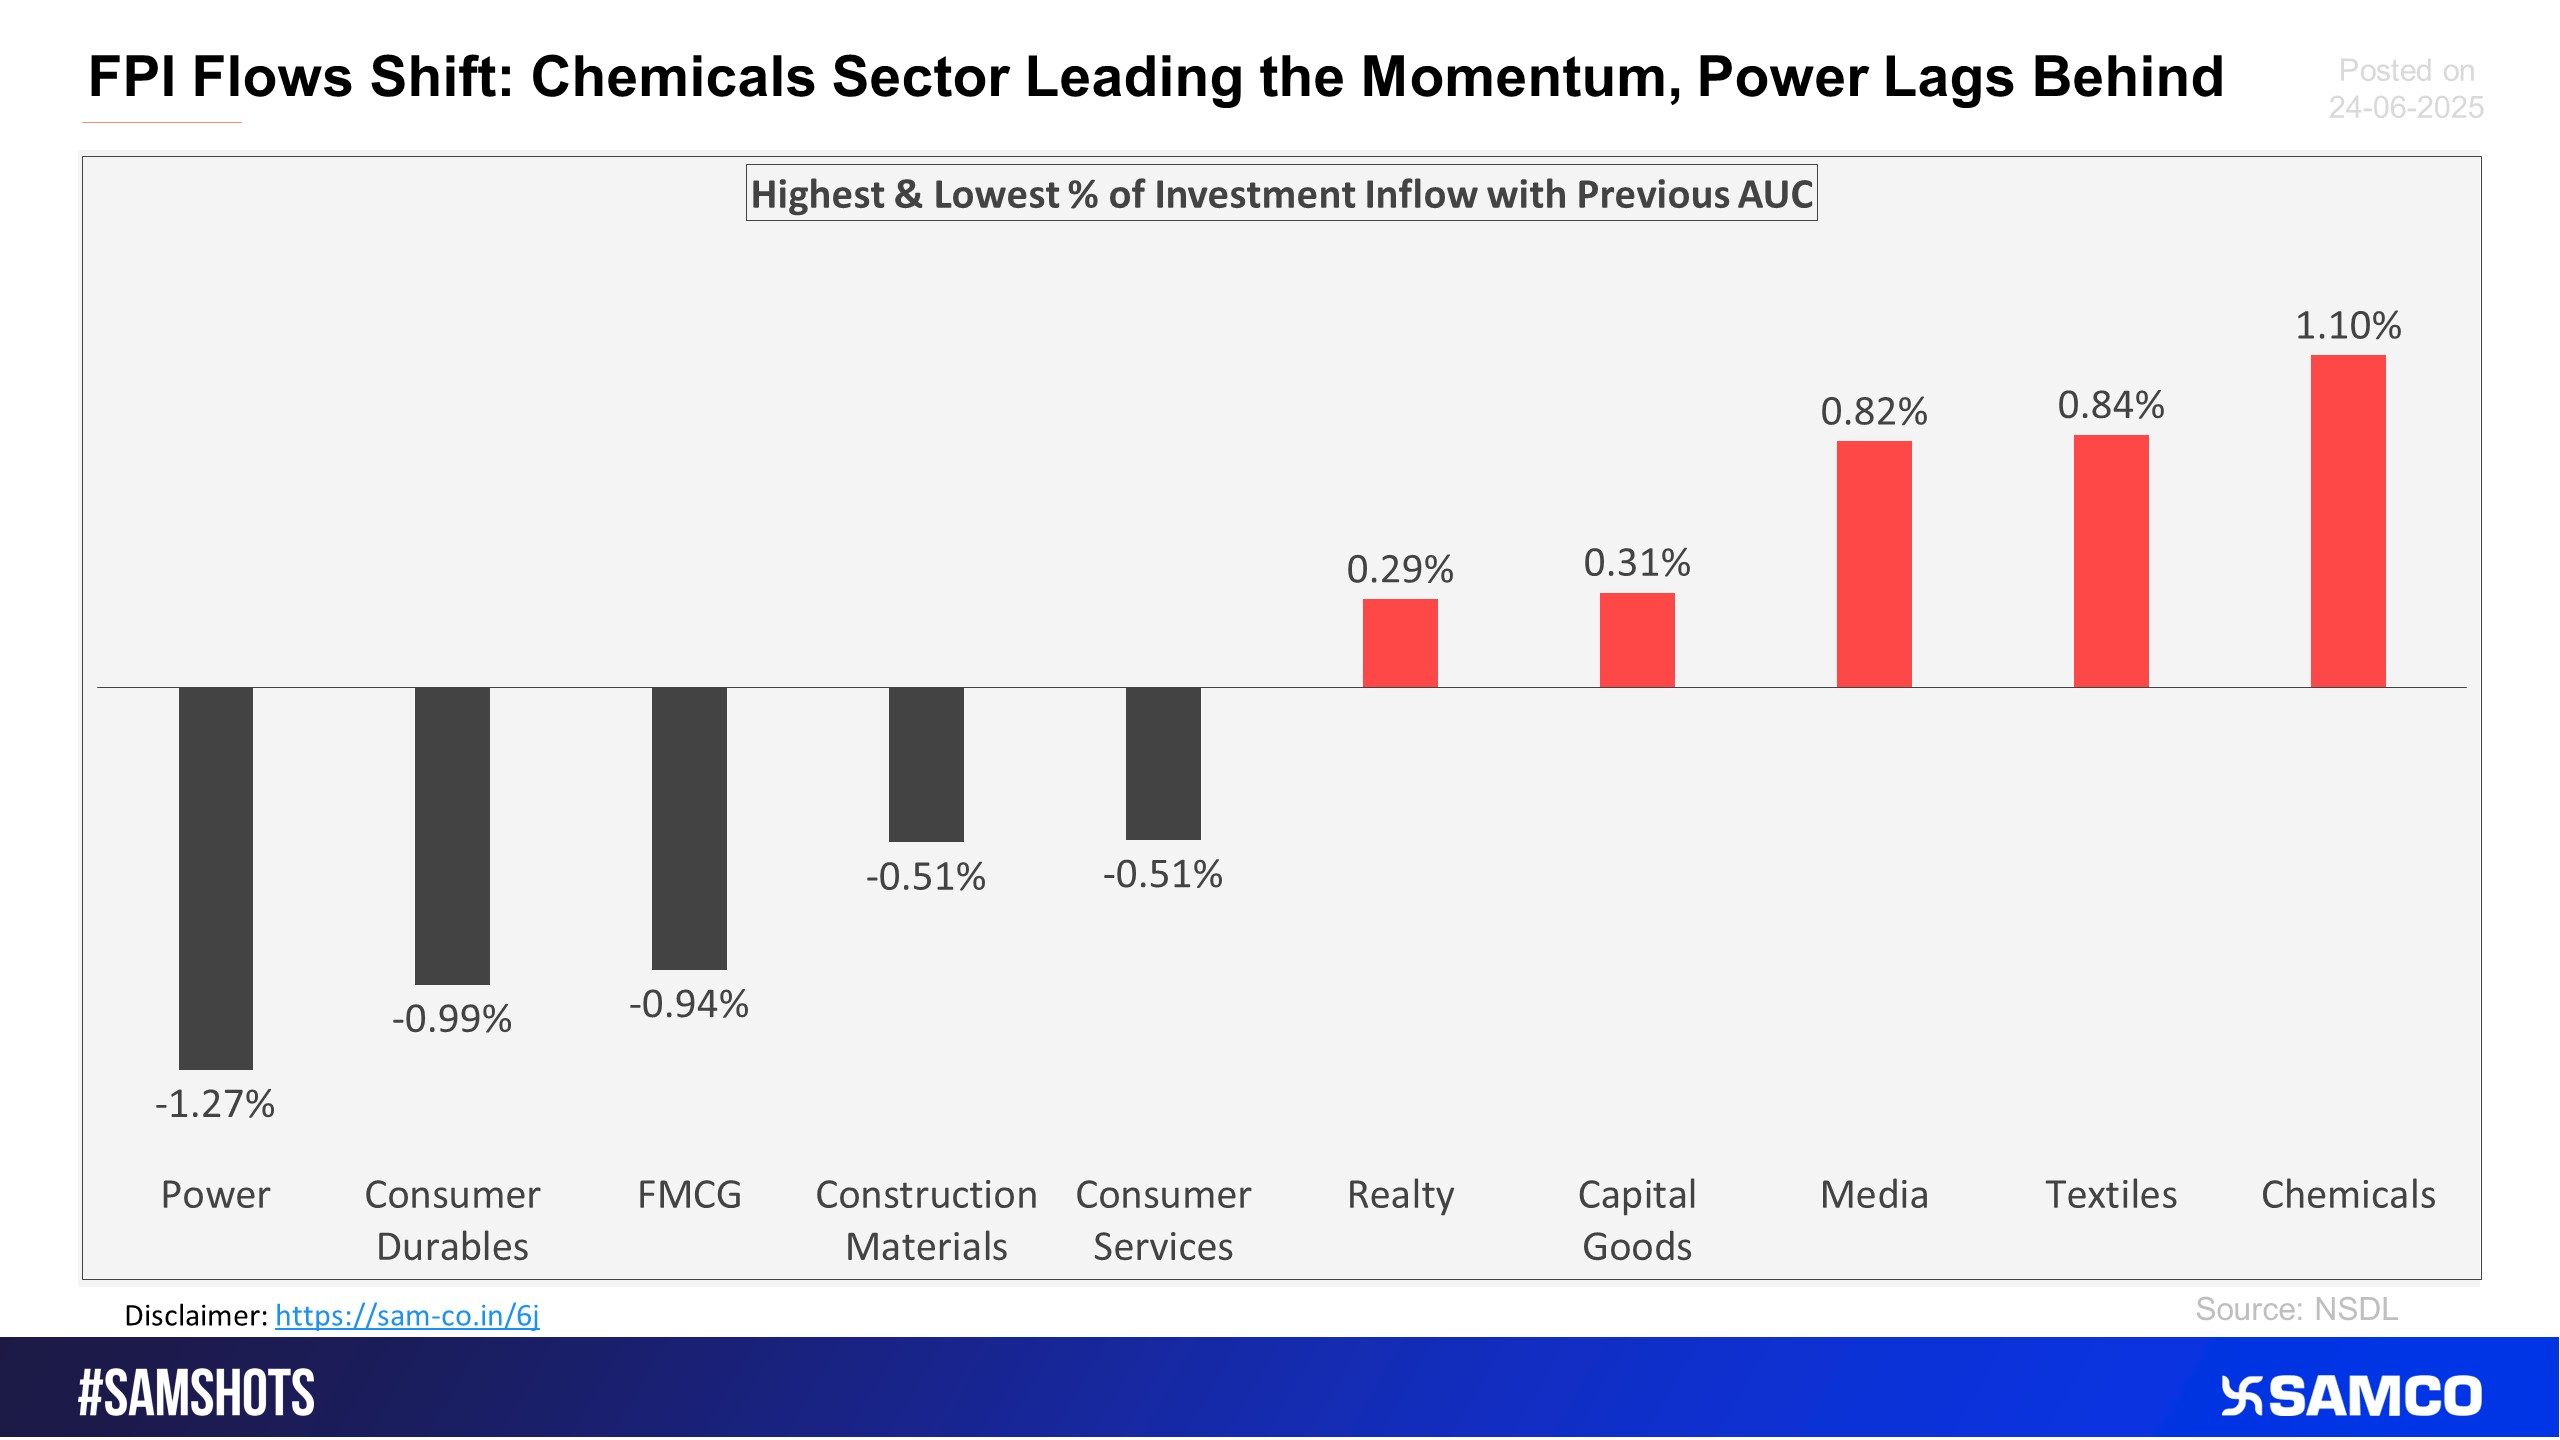
The below chart presents the highest & lowest percentage inflow of investment in the latest fortnight compared to the previous period AUC (Asset Under Custody) of FPI.
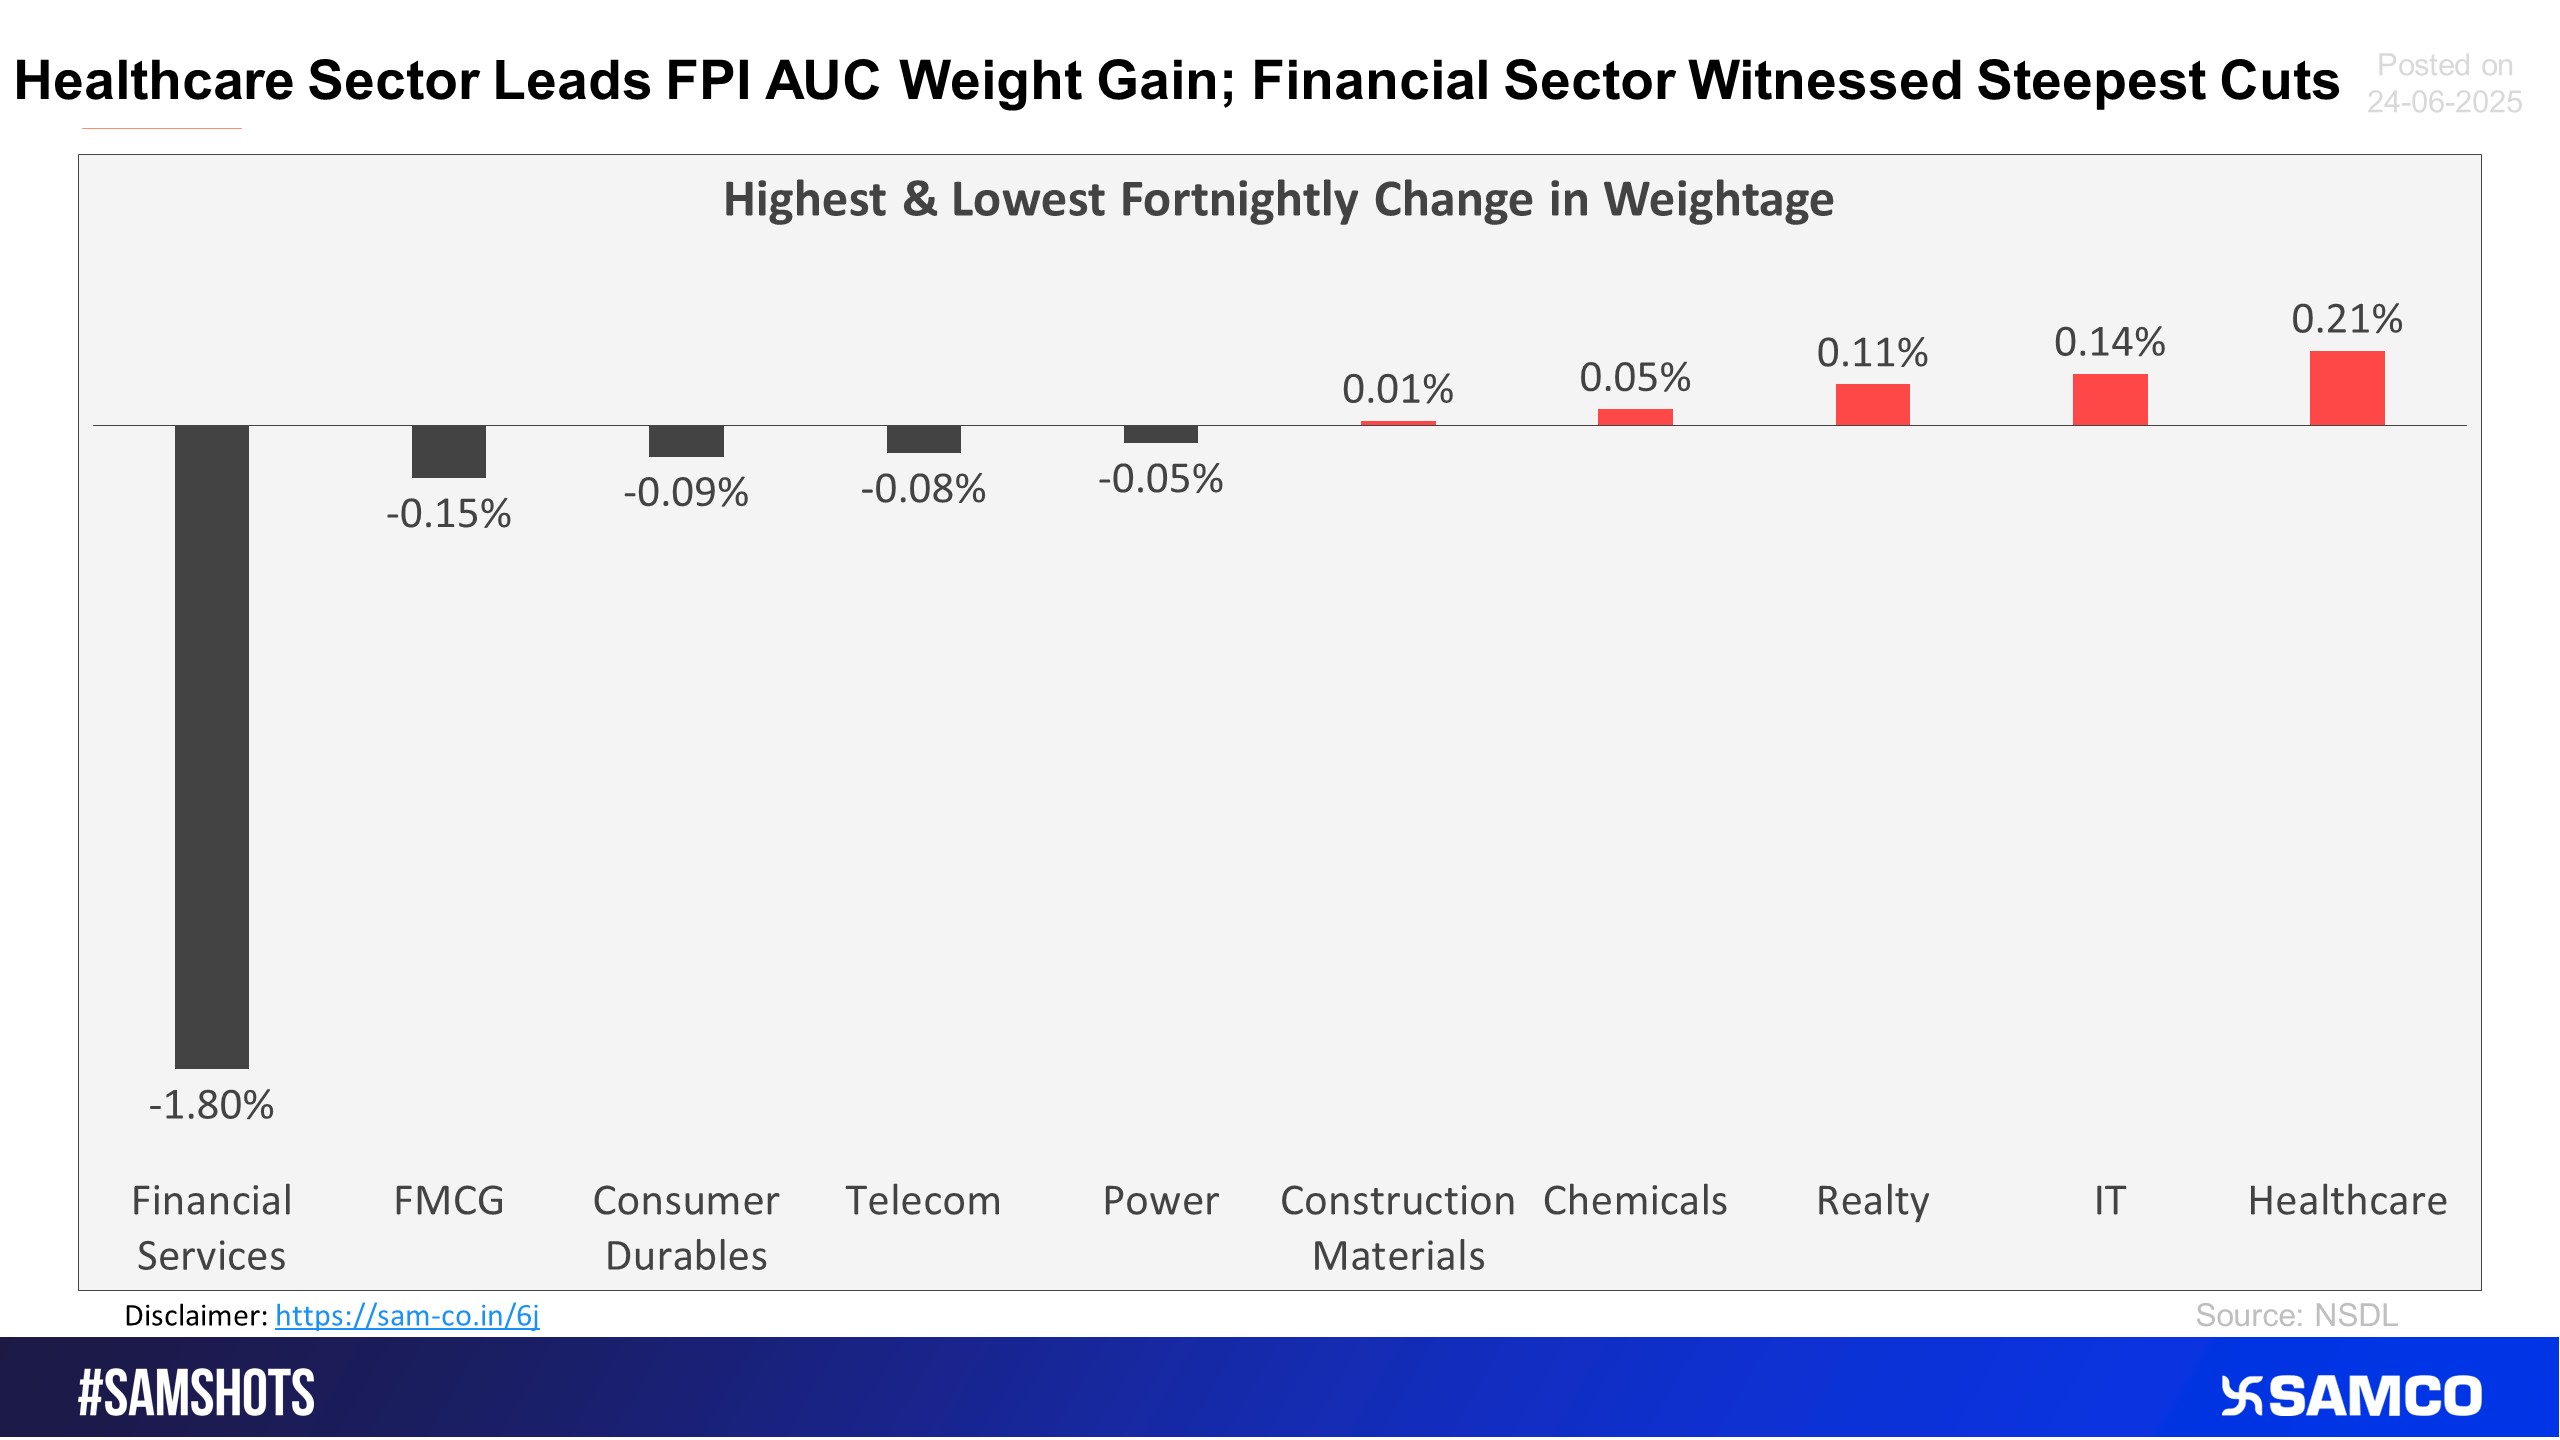
The chart below displays sectors that witnessed the highest and lowest change in the weightage of sectoral FPI holdings to the total FPI holdings compared to the previous fortnight.
Bullish Continuation in Play as Graphite India Snaps Declining Trendline
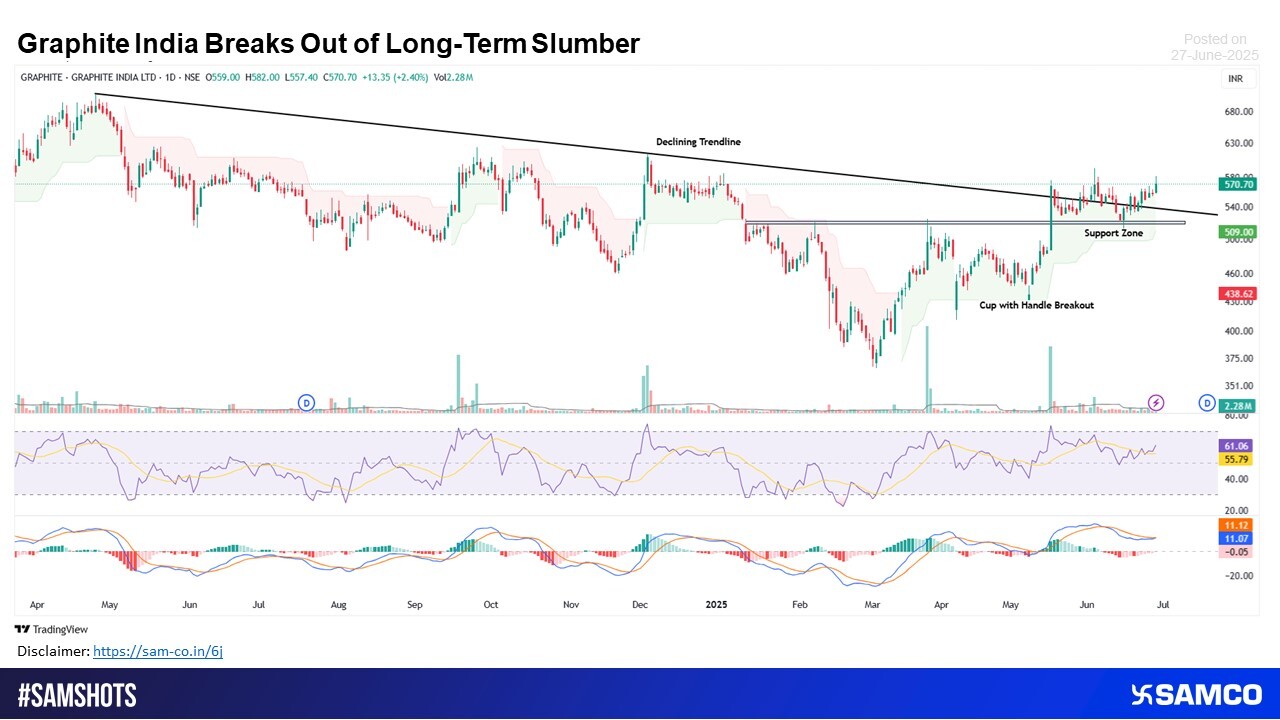
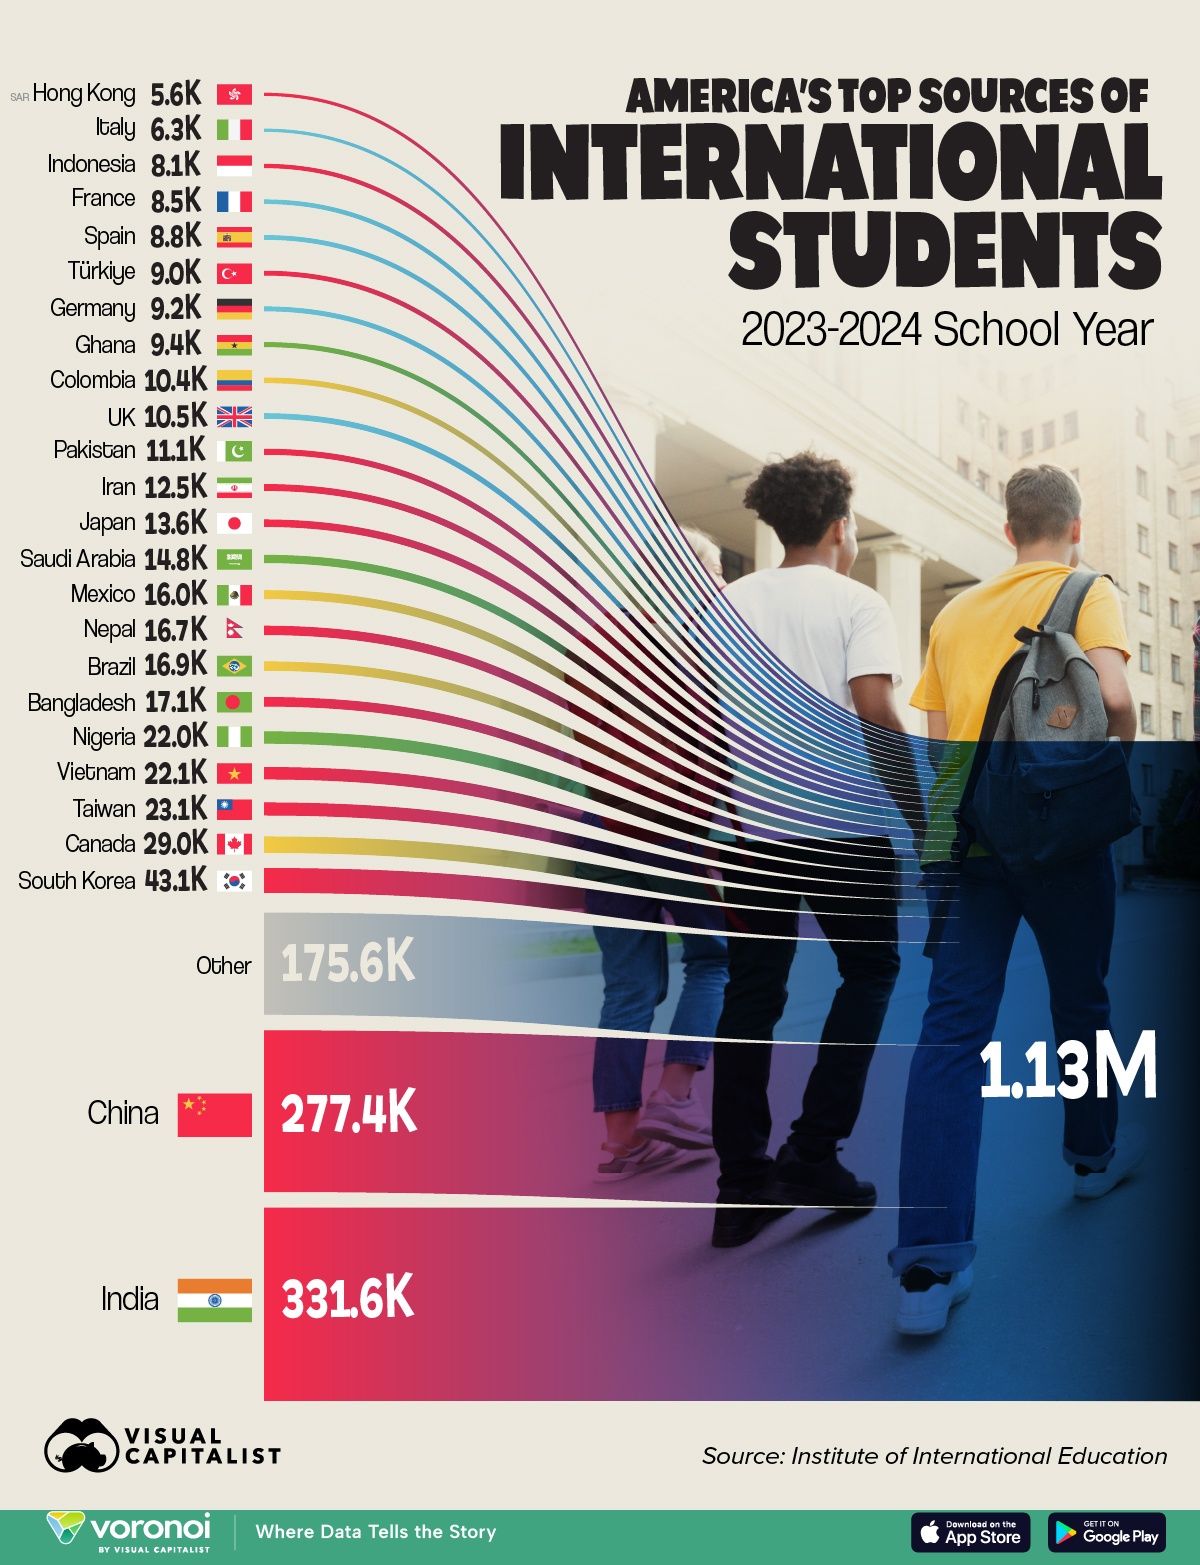
Image Source: @ VisualCap (Twitter)


 Easy & quick
1. Register on SCORES portal
2. Mandatory details for filling complaints on SCORES
Name | PAN | Address | Mobile | Number | E-mail ID
3. Benefits
Effective Communication
Speedy redressal of the grievances
