This week, Indian equities came under pressure, with the Nifty 50 index declining by 1.39% as escalating India-Pakistan tensions weighed on market sentiment. Despite the broader weakness, Foreign Institutional Investors (FIIs) remained consistent net buyers throughout the week, offering some support to the downside.
The U.S. Federal Reserve concluded its policy meeting, leaving interest rates unchanged, aligning with market expectations. In sectoral trends, the Nifty Auto index emerged as the top performer, gaining 1.53%. Meanwhile, precious metals saw renewed investor interest, with gold prices surging above 3% as safe-haven demand rose amid geopolitical concerns.
Overall, the market closed on a bearish note, driven by macro-level risks, even as select companies posted encouraging Q4 results. Investors are now closely tracking further earnings reports and geopolitical developments for near-term direction.
Scroll down to understand more of such market news and perspectives for the week gone by in easily understandable charts.
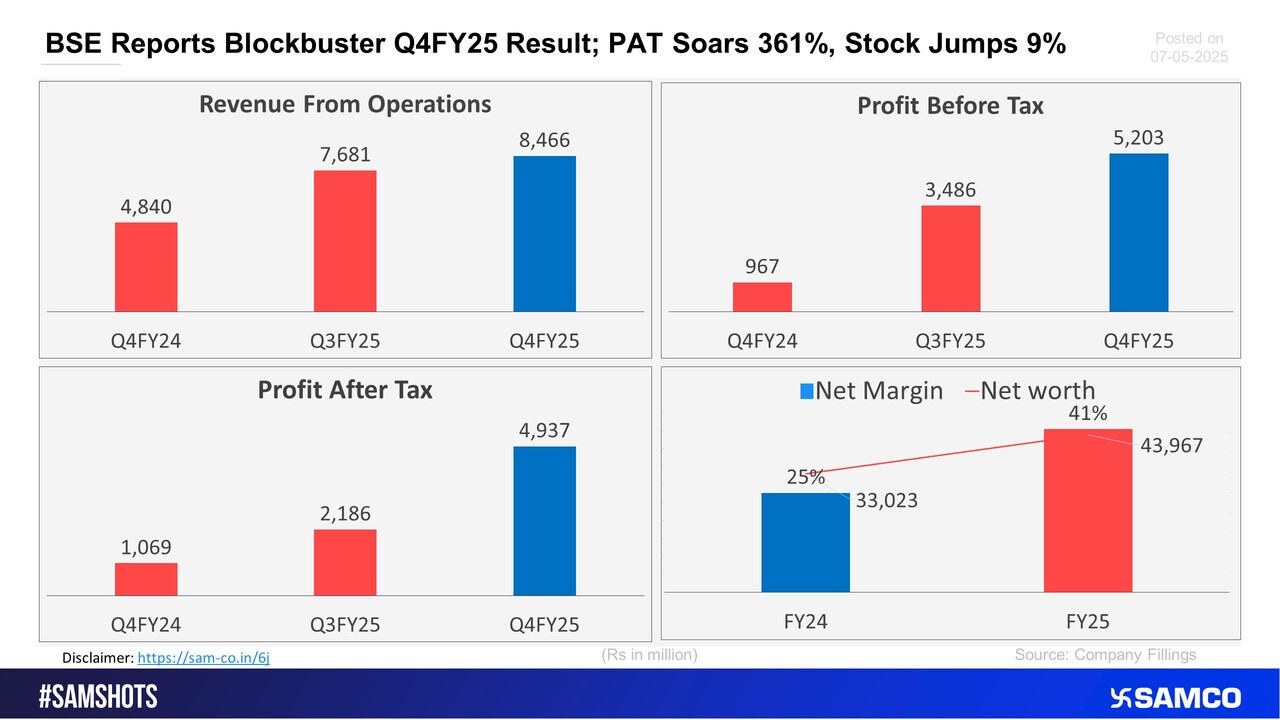
The shares of BSE surged 9% after showing spectacular performance in Q4FY25.


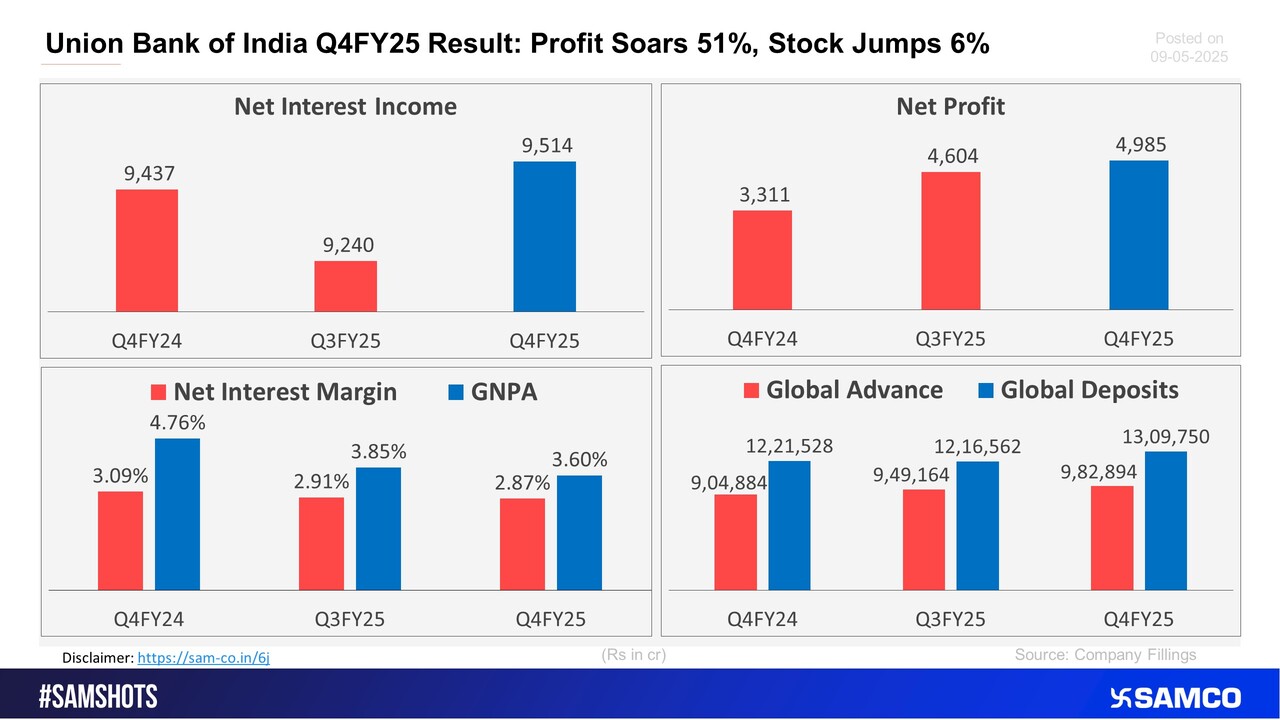
The below chart shows the performance of Union Bank of India in Q4FY25.
This is how CAMS performed in the quarter ending Mar-25.

The below chart presents the quarterly performance of Poly Medicure in Q4FY25

The below accompanied Sankey chart explains how Titan made money in Q4FY25

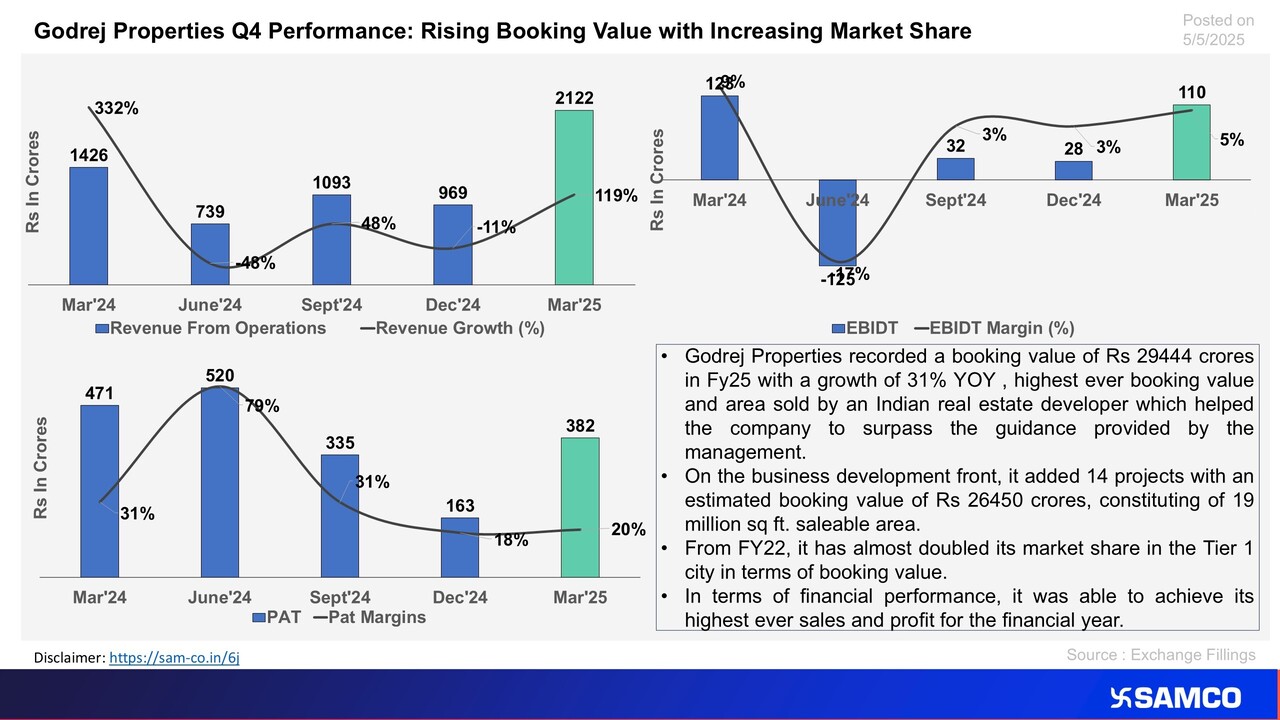
The chart evaluates the financial performance of Godrej Properties for Q4FY25.
Export Sales led to rising margins for KEI in Q4FY25

Gravita India posts another quarter with highest ever sales and Profits.

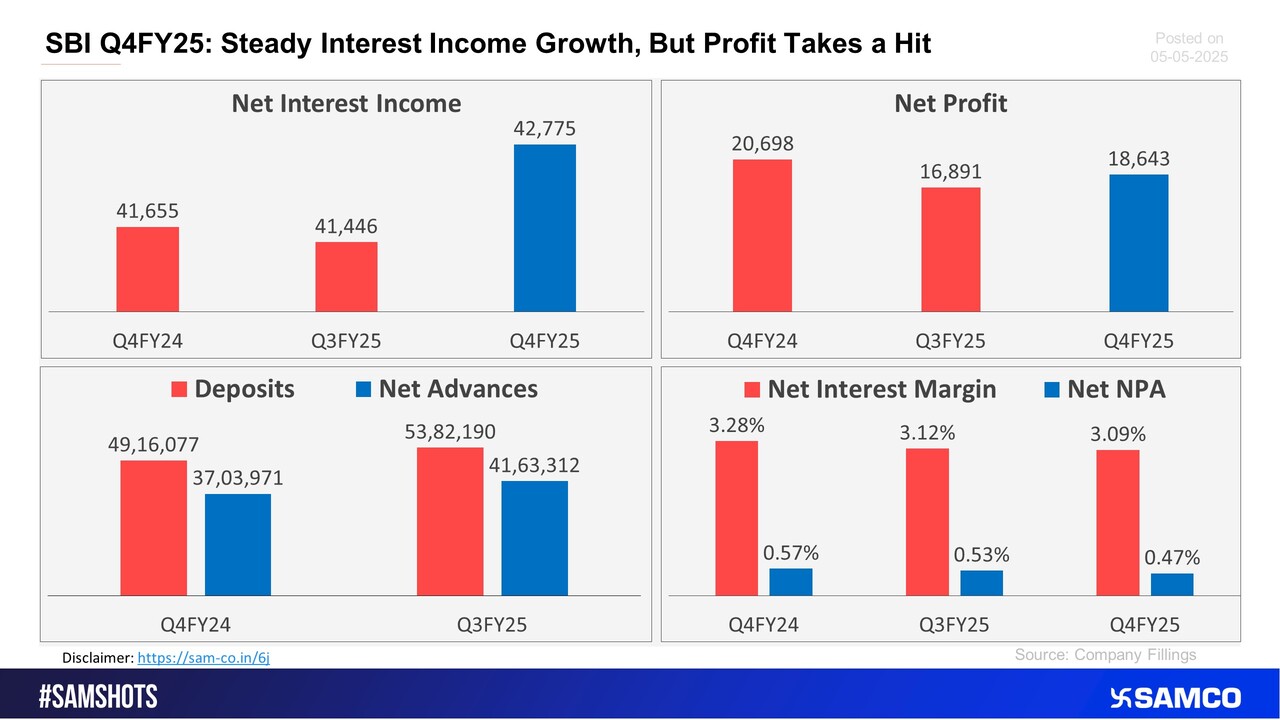
The below chart shows performance of State Bank of India in Q4FY25.
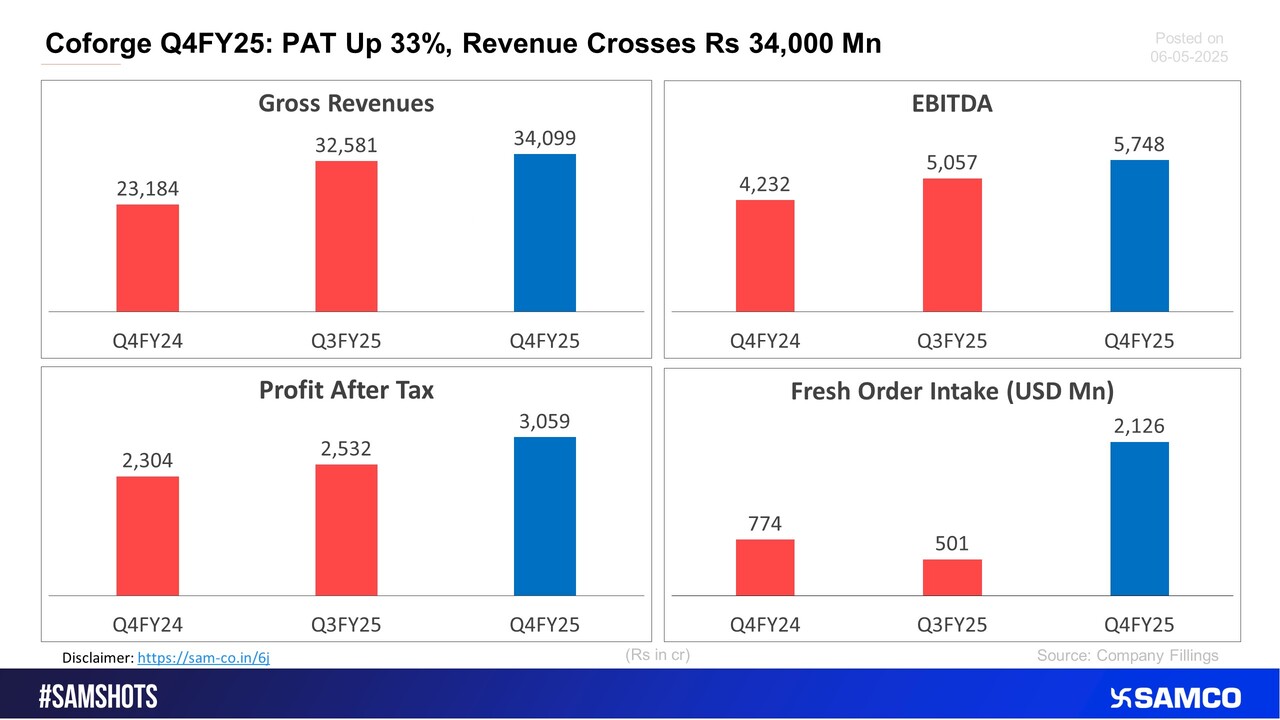
Here’s how Coforge Ltd fared in Q4FY25.
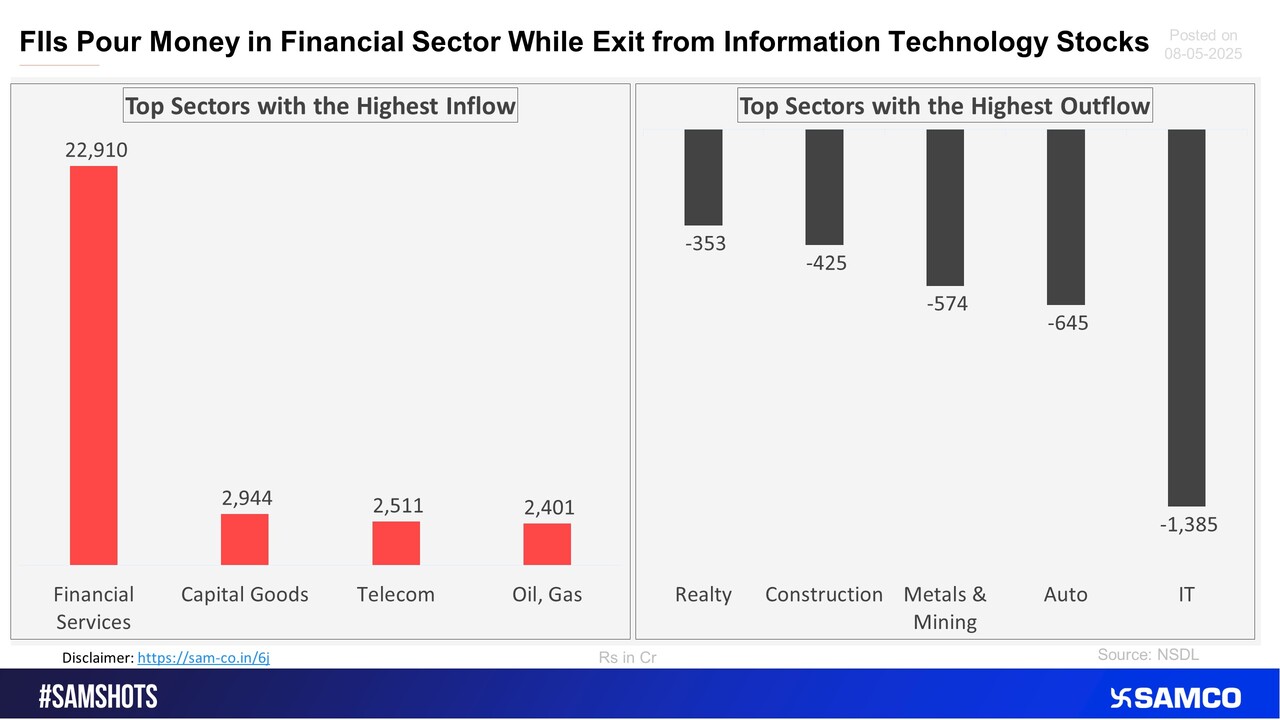
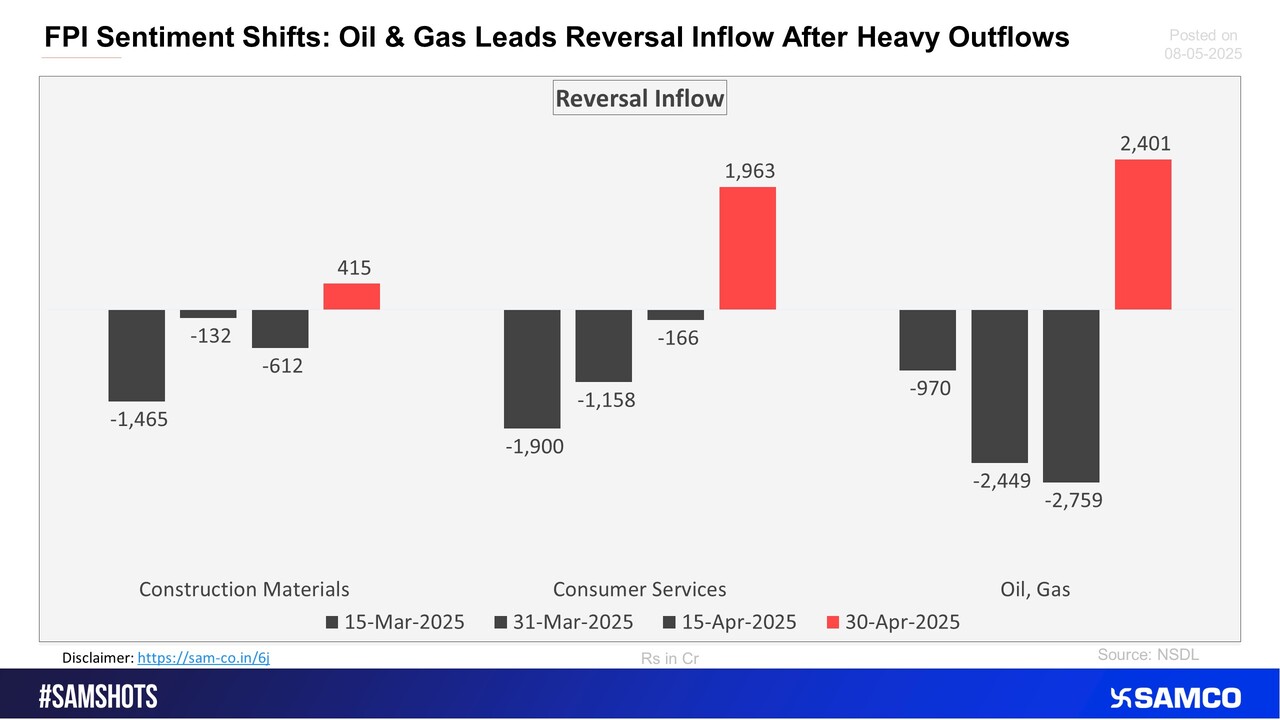
The accompanying chart shows the top sectors that witnessed FPI’s highest inflow and outflow in the latest quarter.
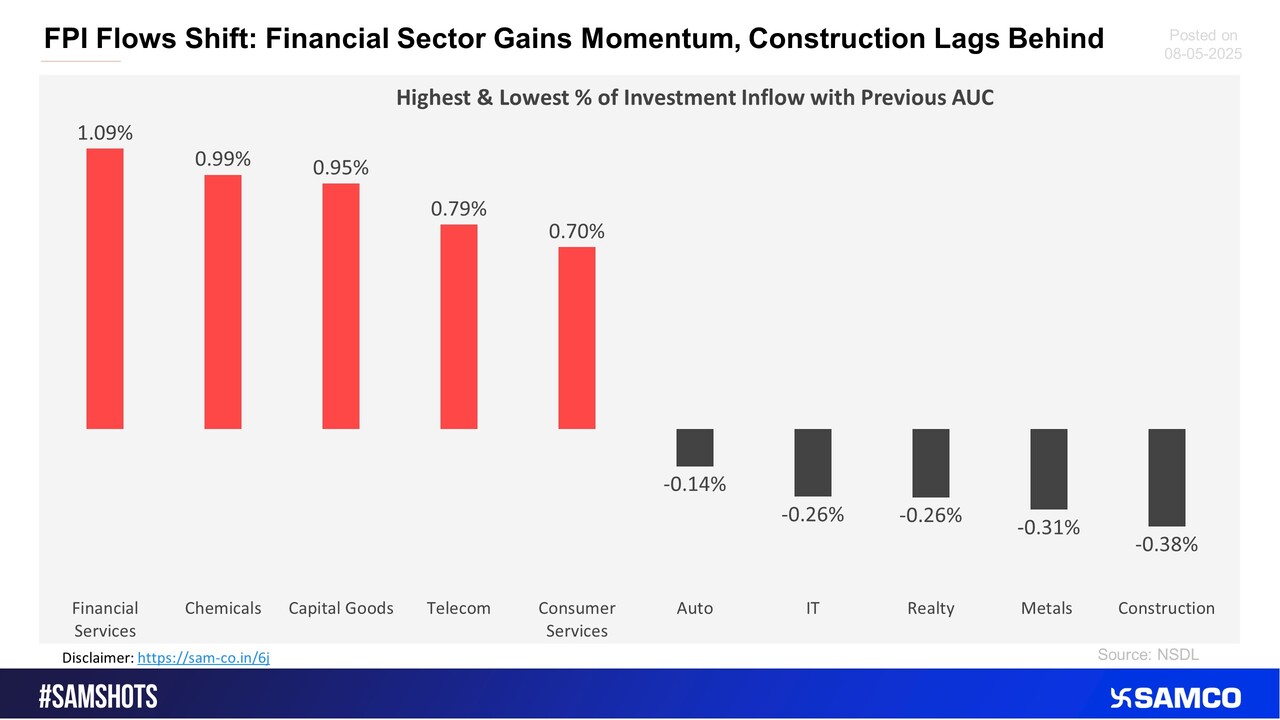
The below chart presents the highest & lowest percentage inflow of investment in the latest fortnight compared to the previous period AUC (Asset Under Custody) of FPI.
The chart below displays sectors that witnessed the highest and lowest change in the weightage of sectoral FPI holdings to the total FPI holdings compared to the previous fortnight.
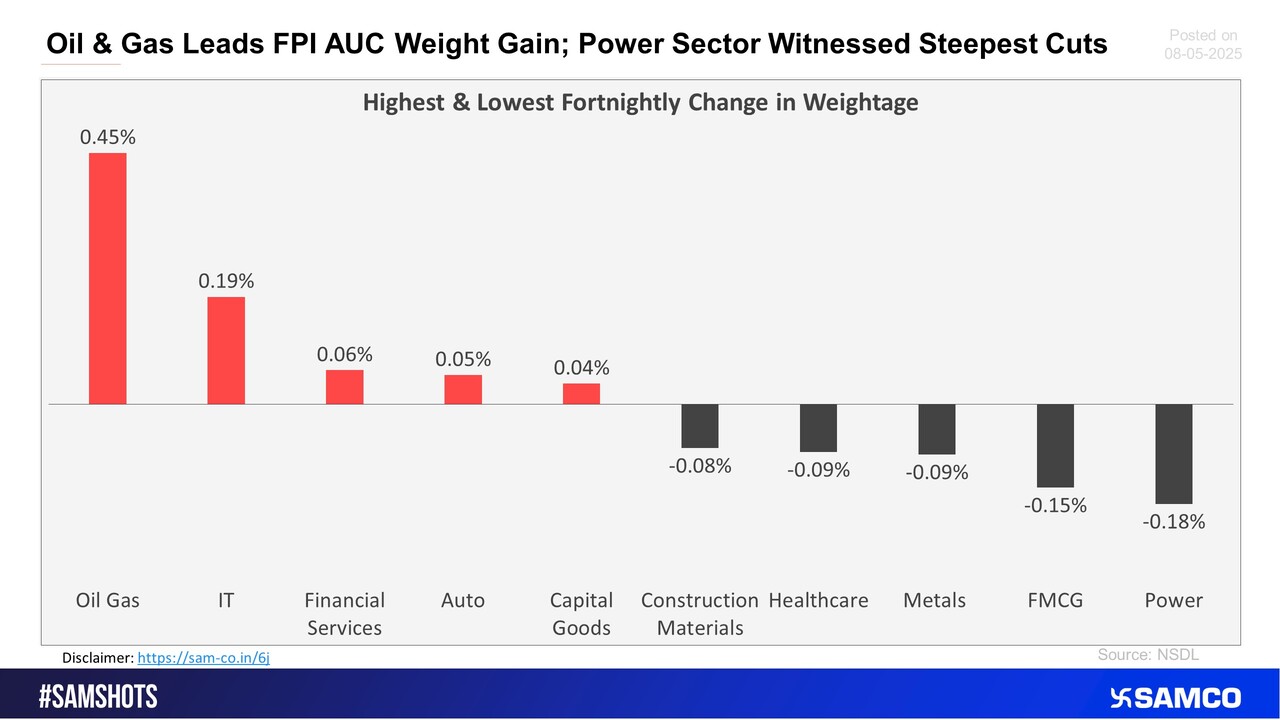
The Oil & Gas sector witnessed reversal inflow of investment after the previous 3 consecutive fortnightly outflow out of FPI money.
Cup & Handle breakout in PREMEXPLN hints at trend reversal and rally
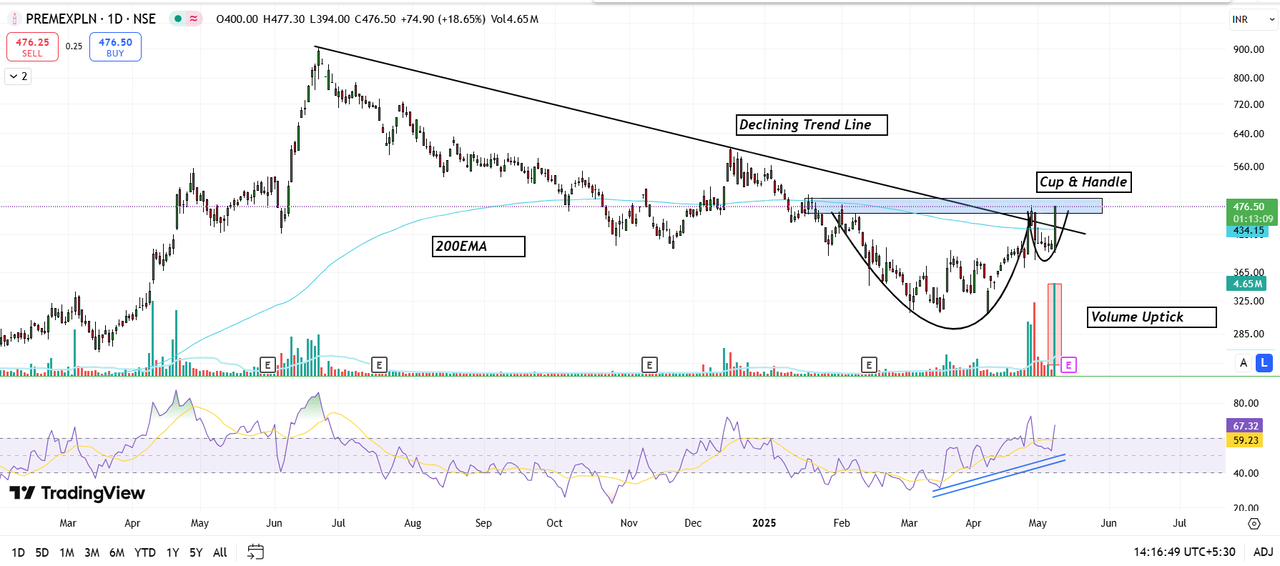
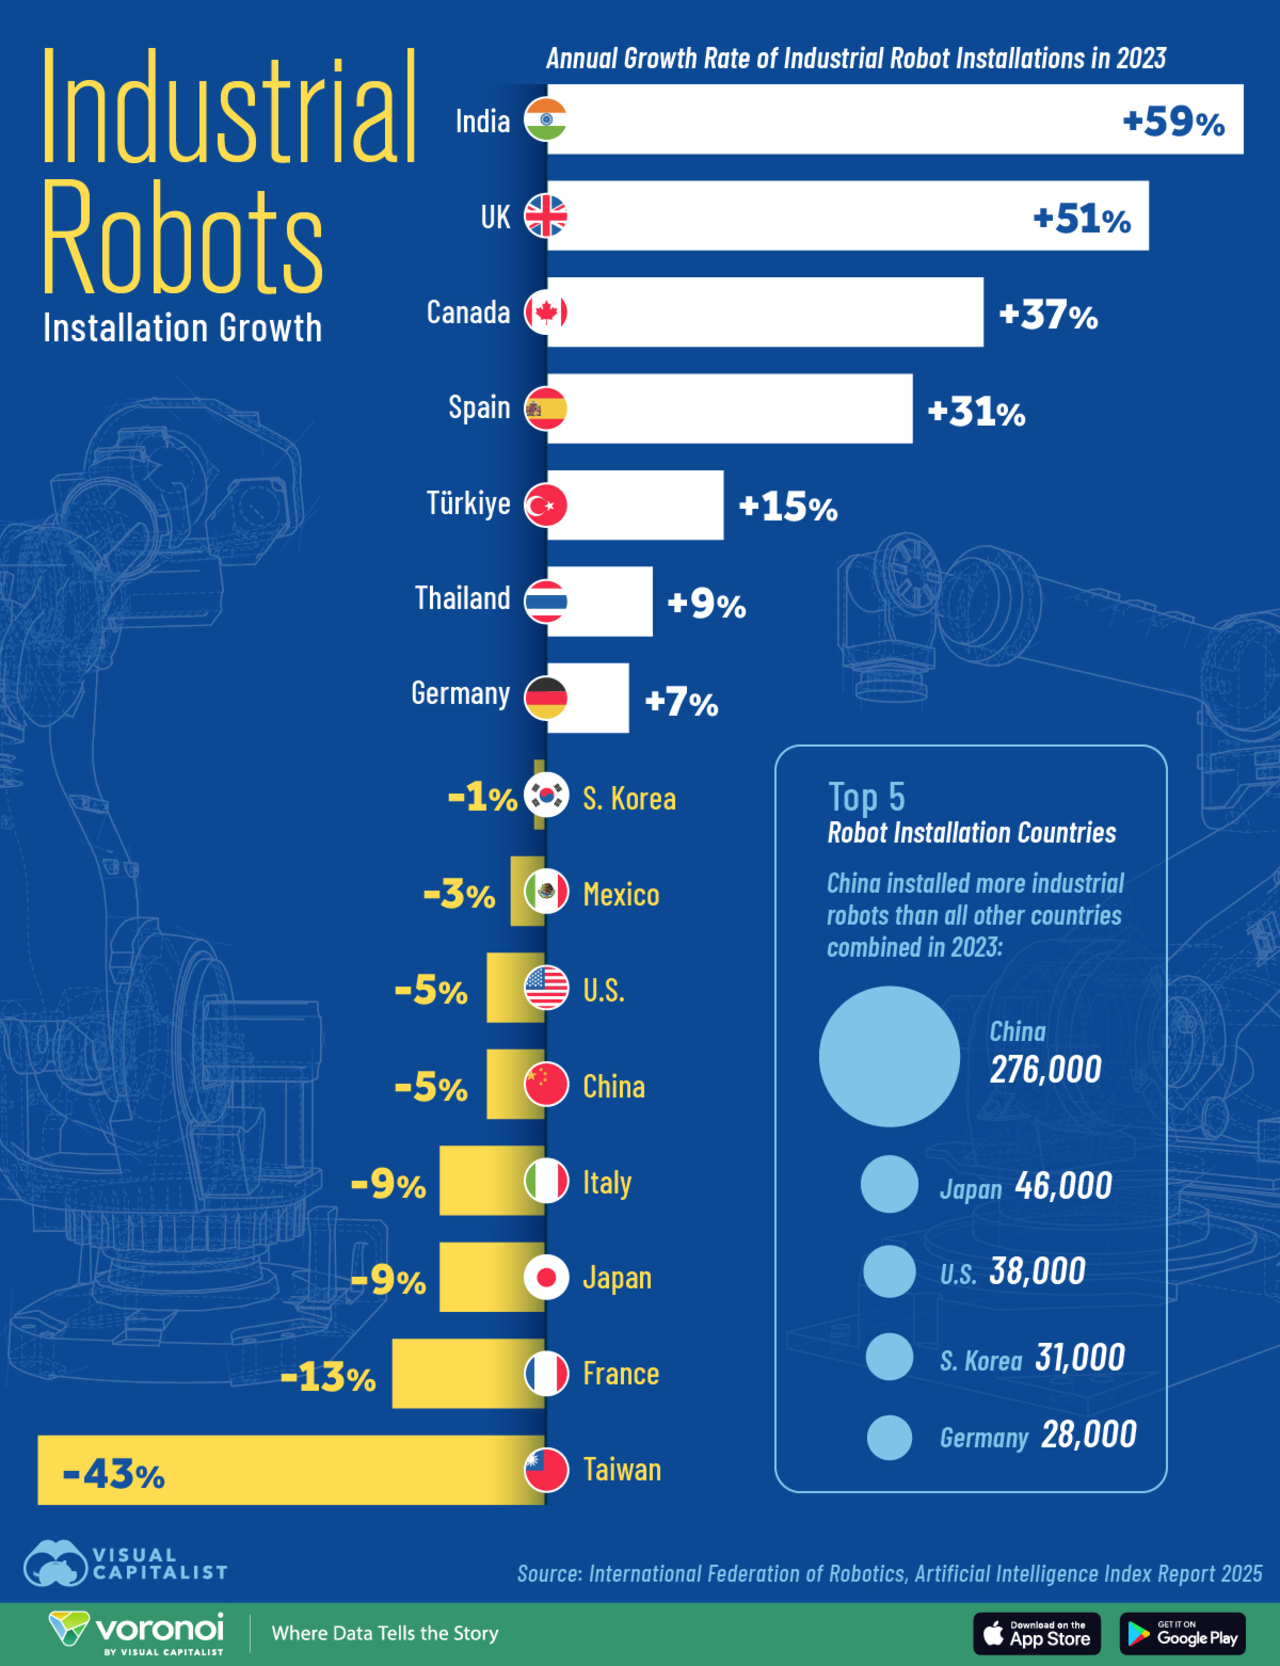
Image Source: @VisualCap (Twitter)
 Easy & quick
1. Register on SCORES portal
2. Mandatory details for filling complaints on SCORES
Name | PAN | Address | Mobile | Number | E-mail ID
3. Benefits
Effective Communication
Speedy redressal of the grievances
