The Indian equity market witnessed mixed sentiment this week. The benchmark Nifty 50 index came under bearish pressure, with bulls attempting a recovery during the final trading session on Friday. Despite their efforts, the index closed the week on a negative note, declining by 0.67%.
Earnings season remained a key focus, and most of the companies that reported their results this week posted strong financial performances, offering some support to investor sentiment.
In the commodities space, precious metals staged a notable rally. Gold prices surged over 3%, while silver also maintained an upward trend with gains exceeding 2% for the week. Among sectors, Nifty Realty emerged as the top performer, gaining 2.66% and outperforming other indices. Meanwhile, foreign institutional investors (FIIs), who had maintained a net buying position over the past few weeks, slowed their inflows during this week.
Overall, the market ended on a weaker note, with participants now closely monitoring the result season is about to end in the coming weeks to gauge further direction.
Scroll down to understand more of such market news and perspectives for the week gone by in easily understandable charts.
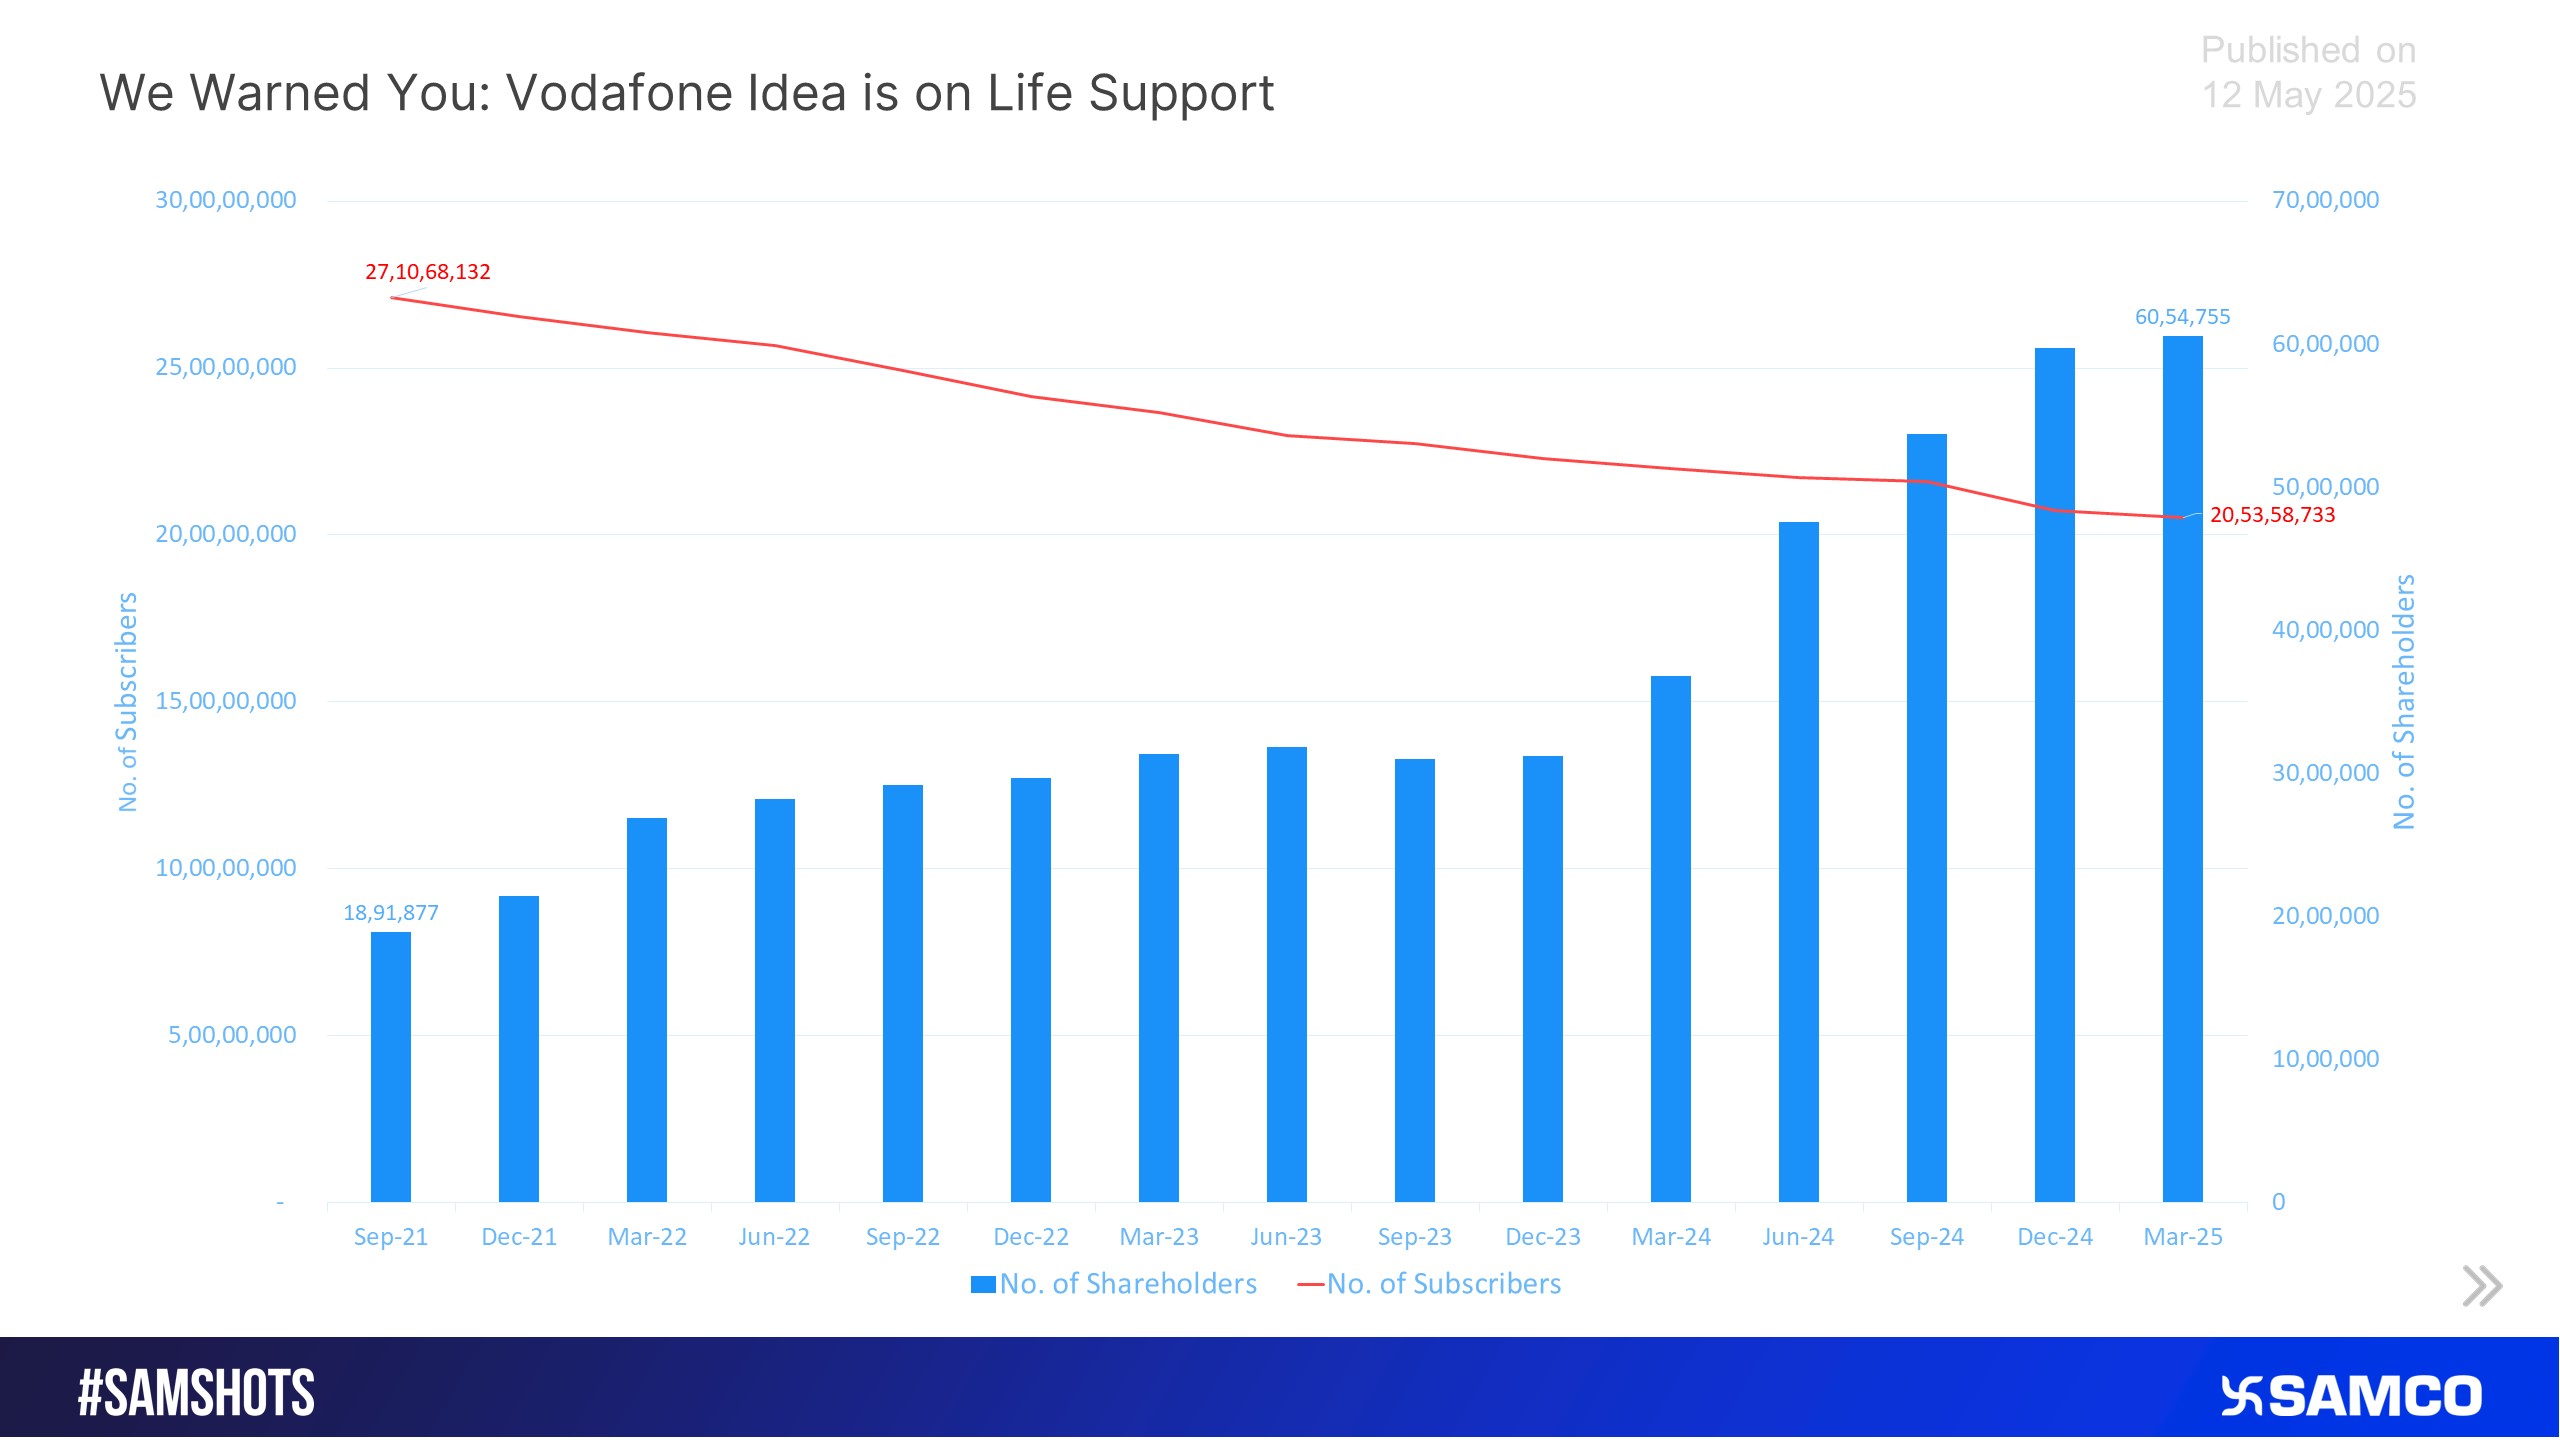
The attached chart shows the trend of Vodafone Idea number of subscribers & number of shareholders.


HLE Glascoat surged 20% after Q4FY25 results.

Pfizer posts best ever revenues & PAT in the Quarter ending Mar-25, here’s quick overview of the same

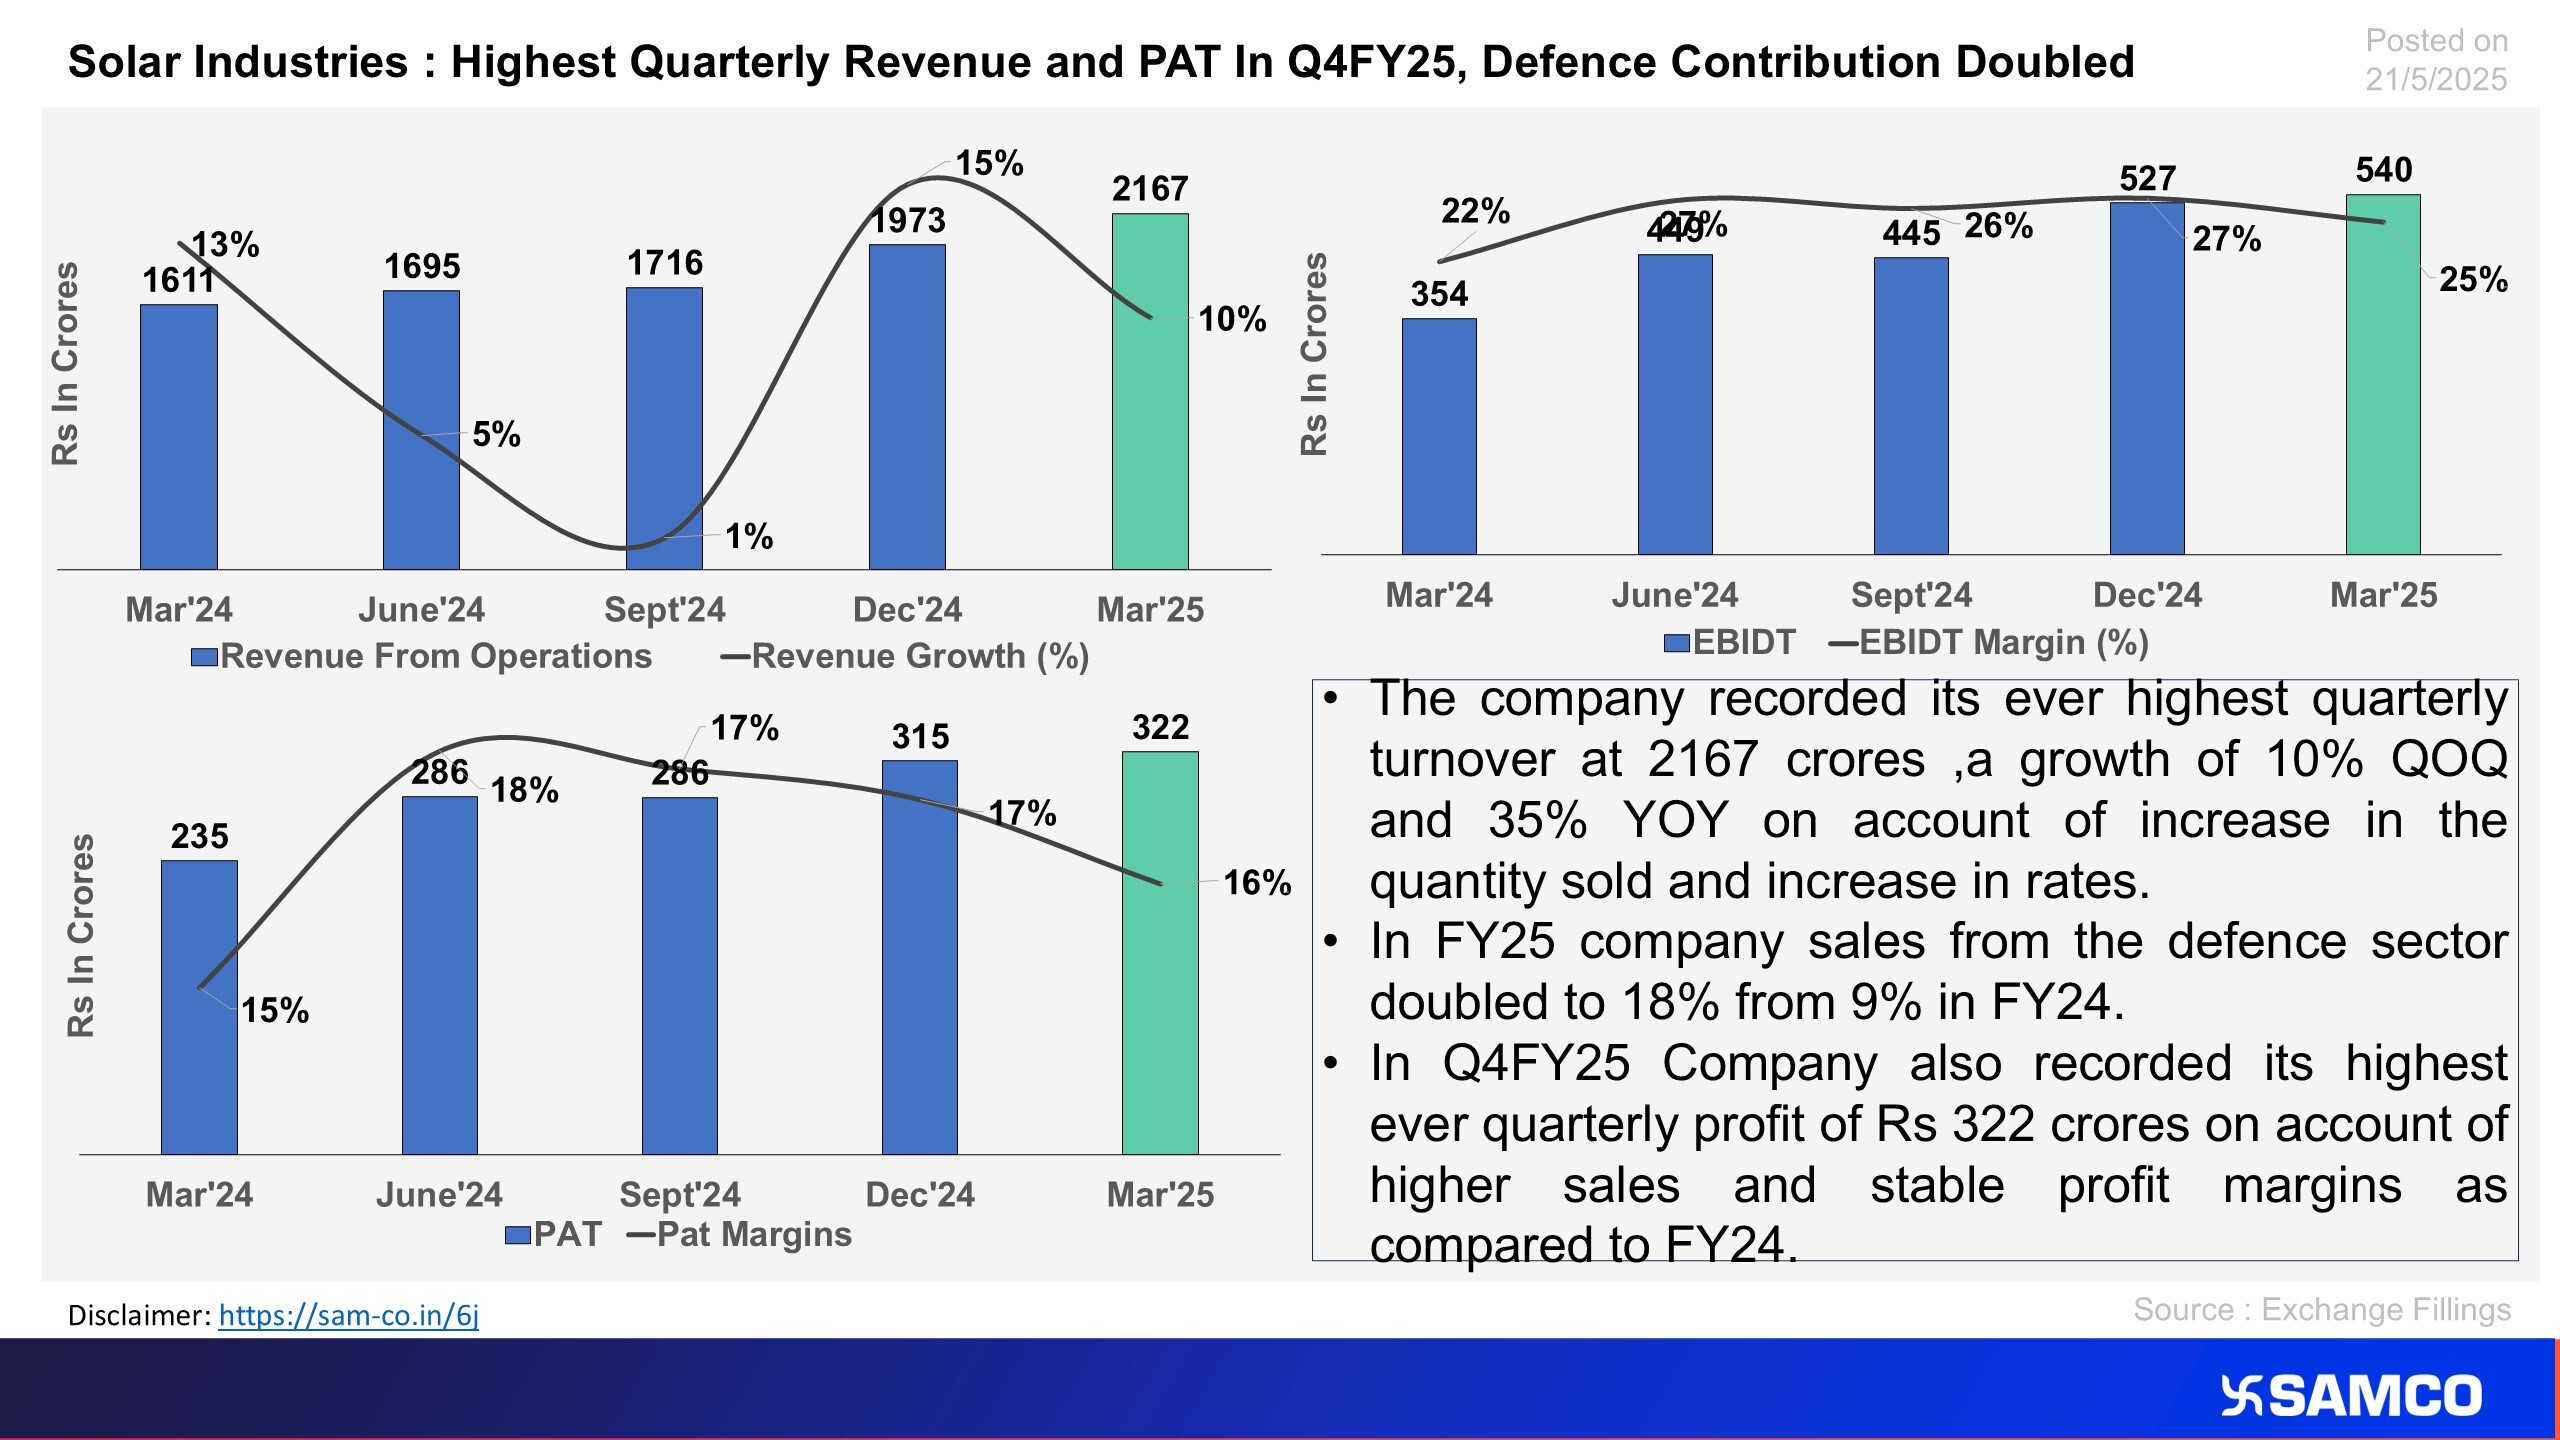
The chart evaluates the financial performance of Solar Industries for Q4
The chart evaluates the effect of reduction in debt on Trident Profits

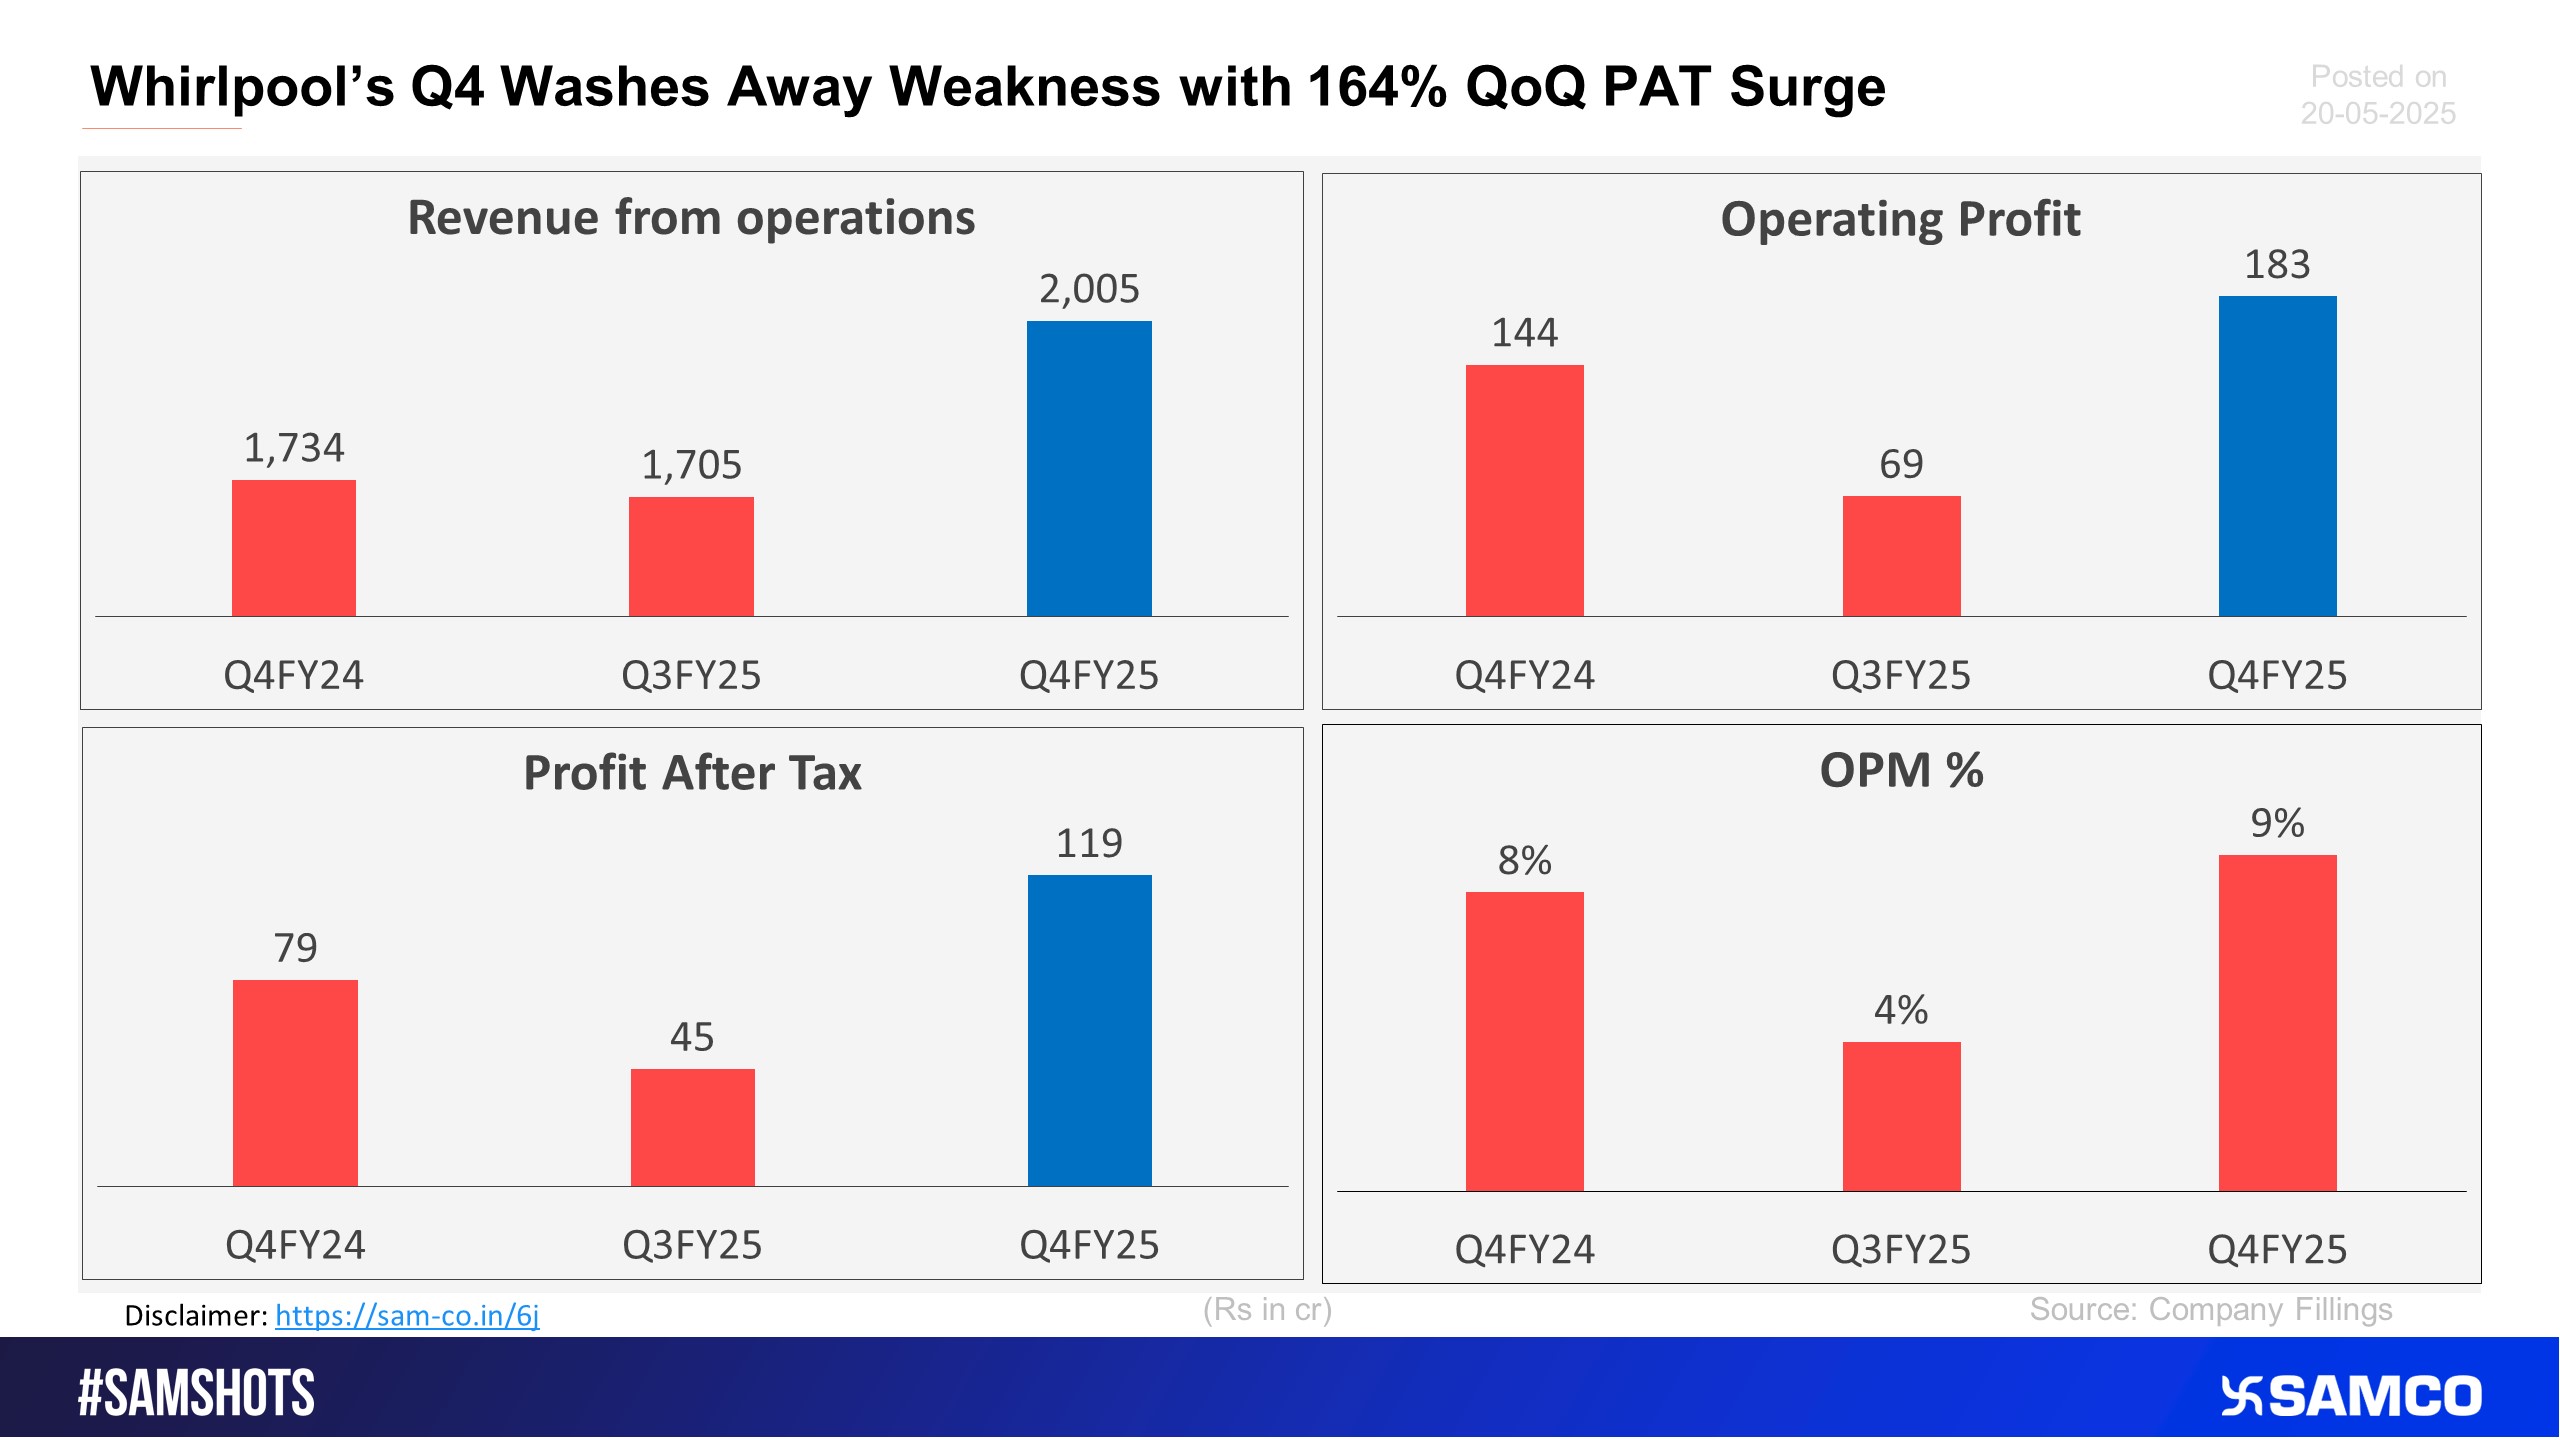
The below chart shows performance of Whirlpool India Ltd in Q4FY25.
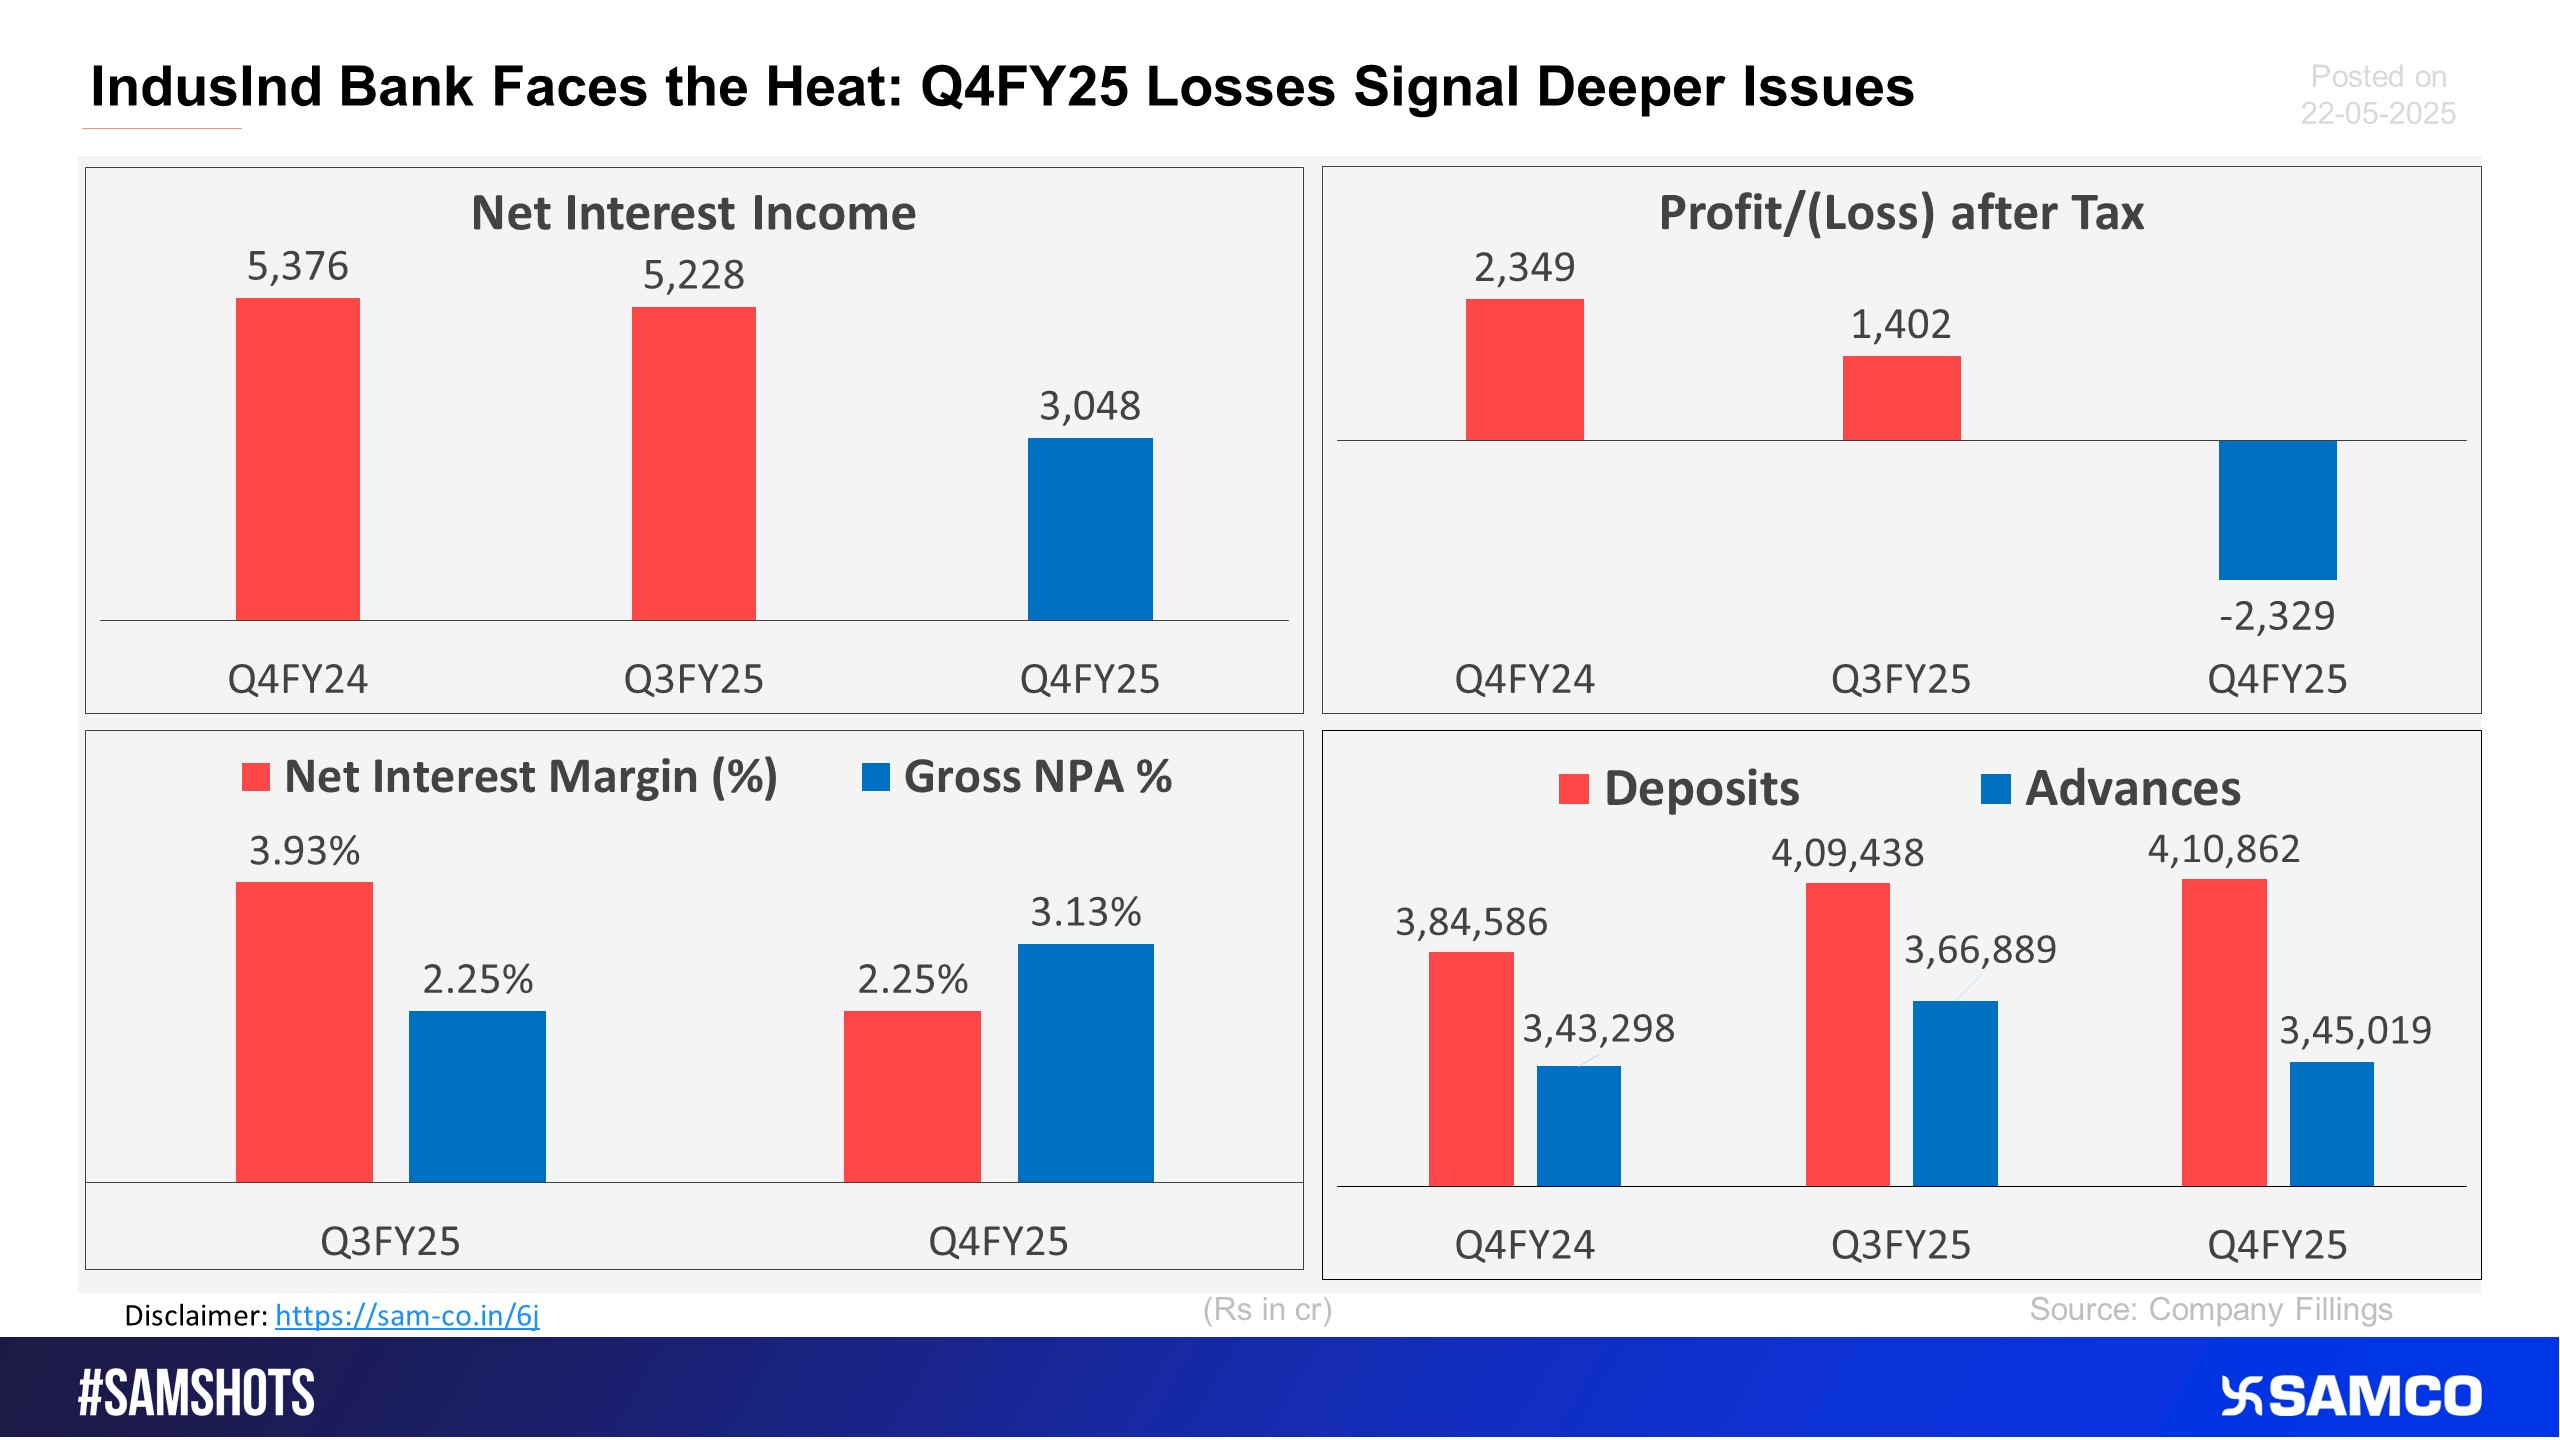
Here’s the performance of IndusInd Bank in Q4FY25.
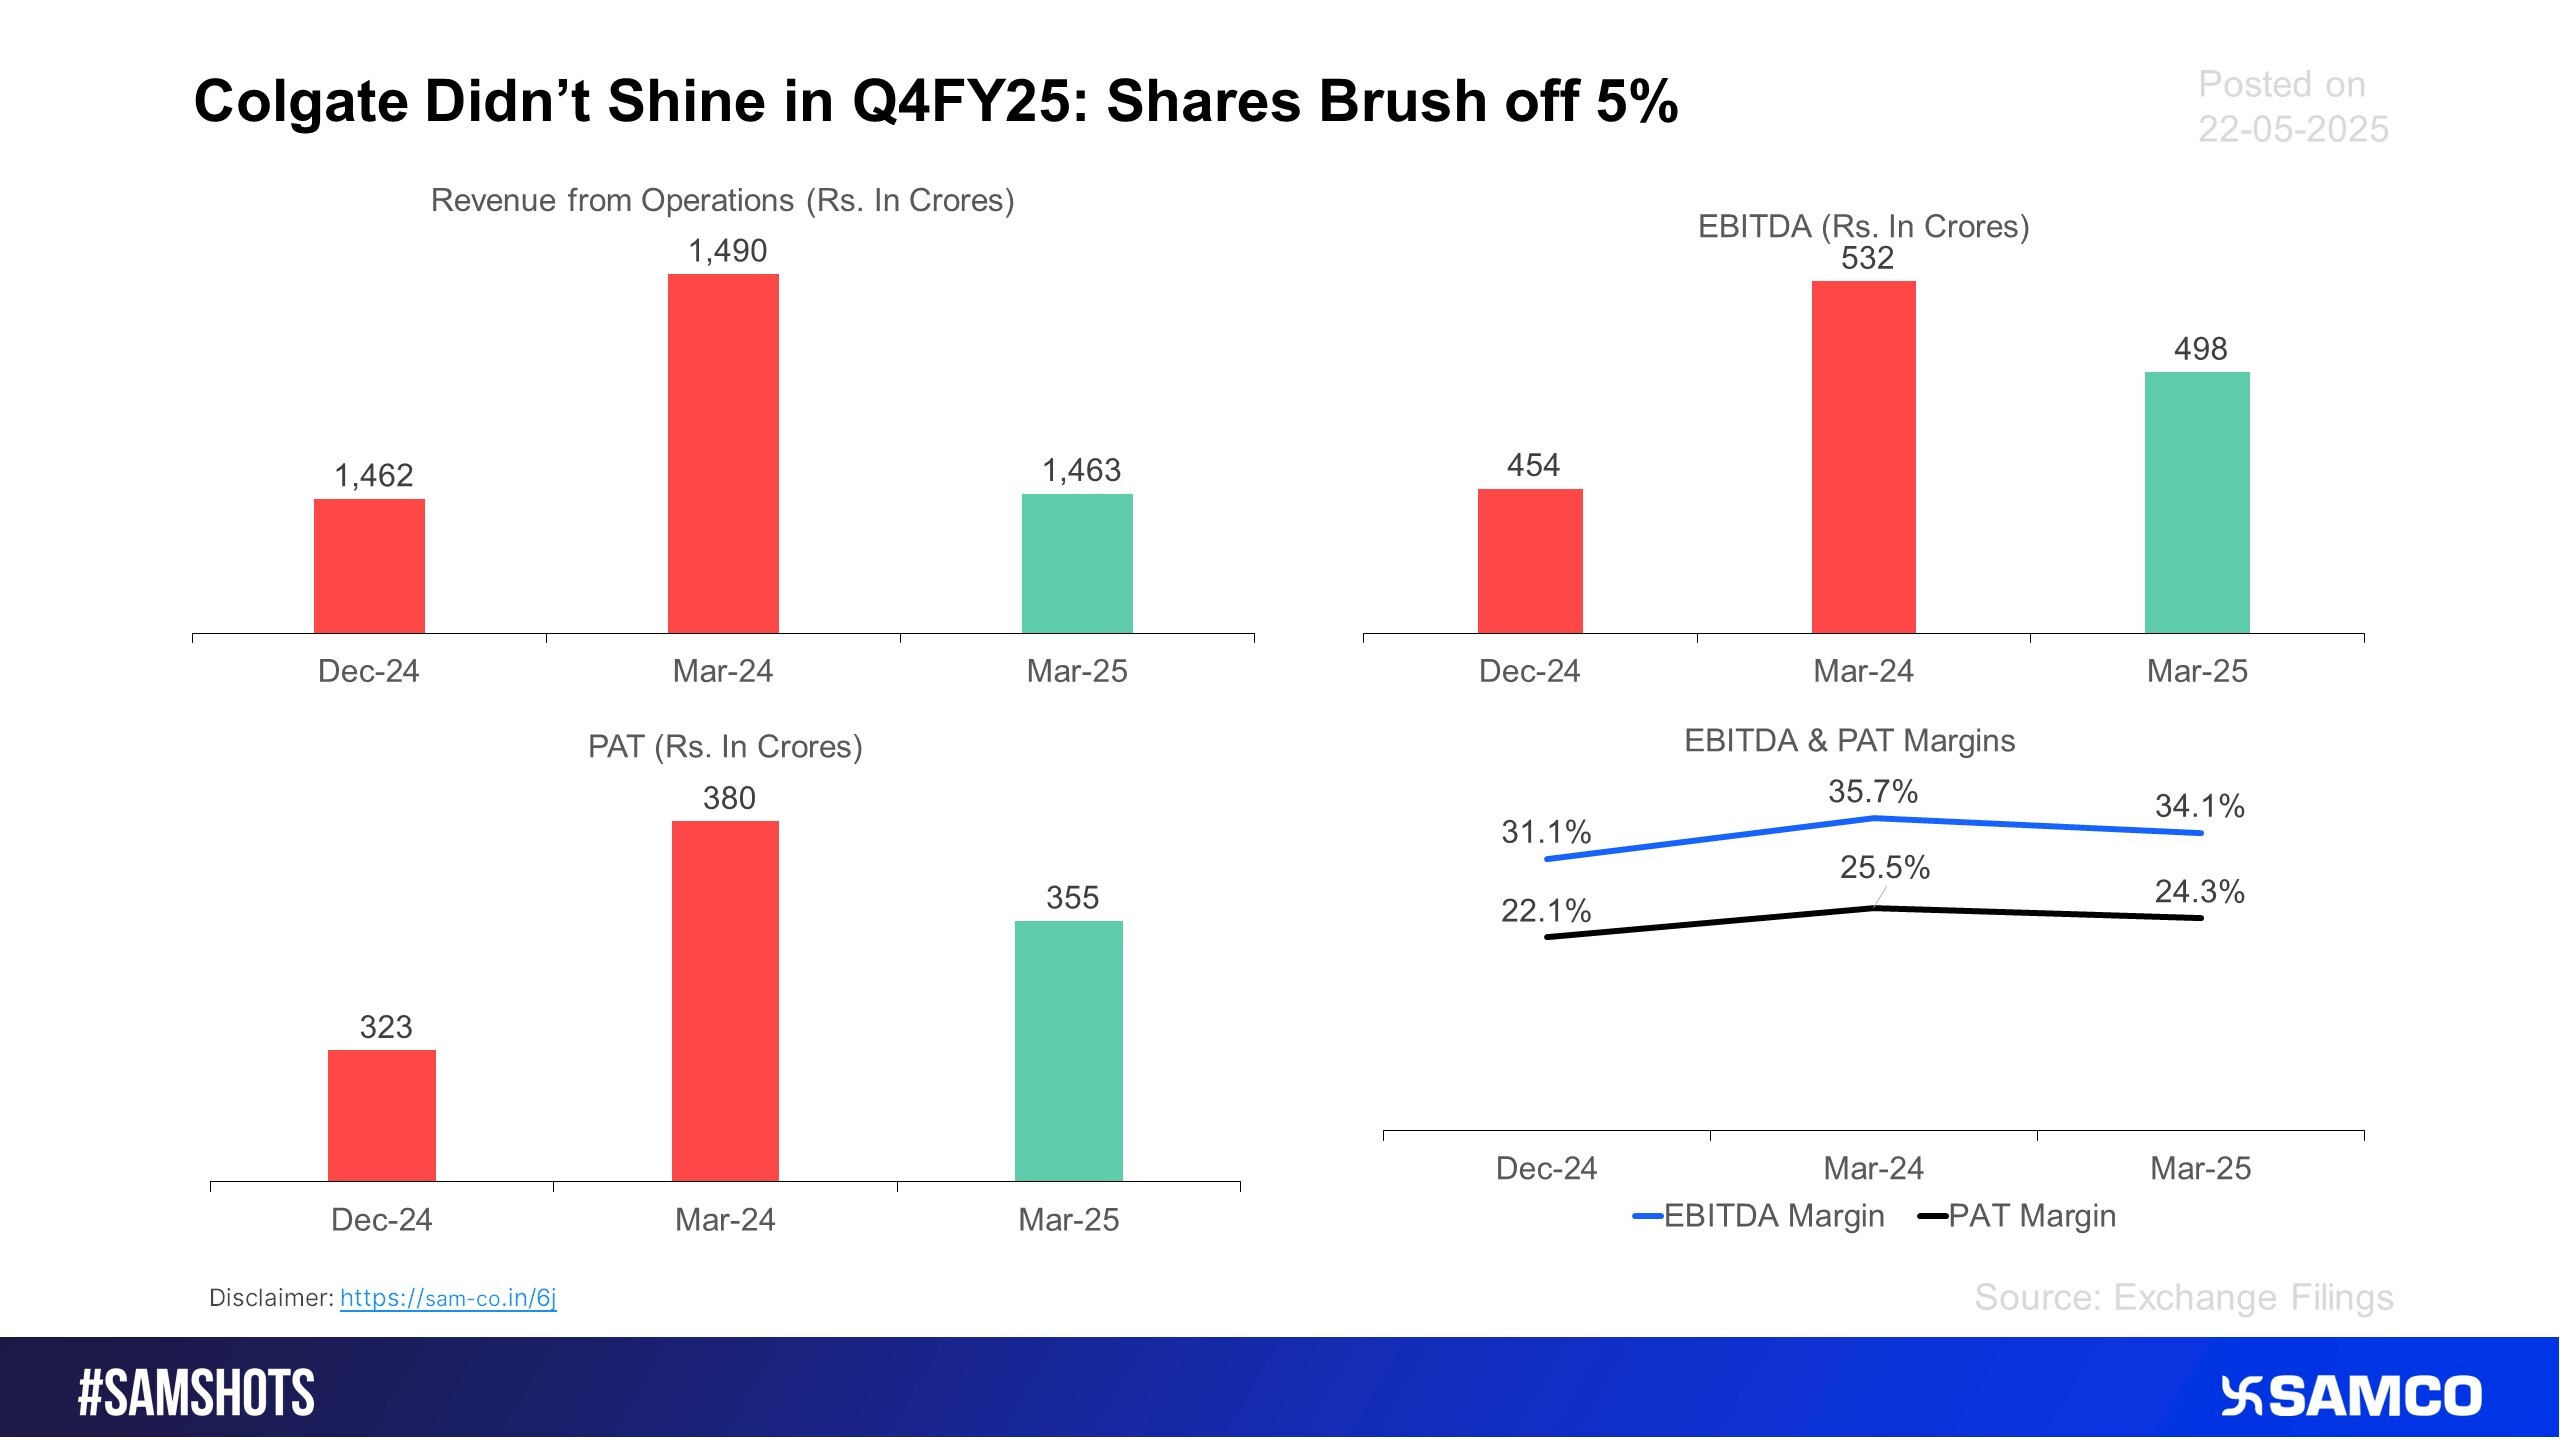
Here’s how Colgate performed in the Quarter ending Mar-25
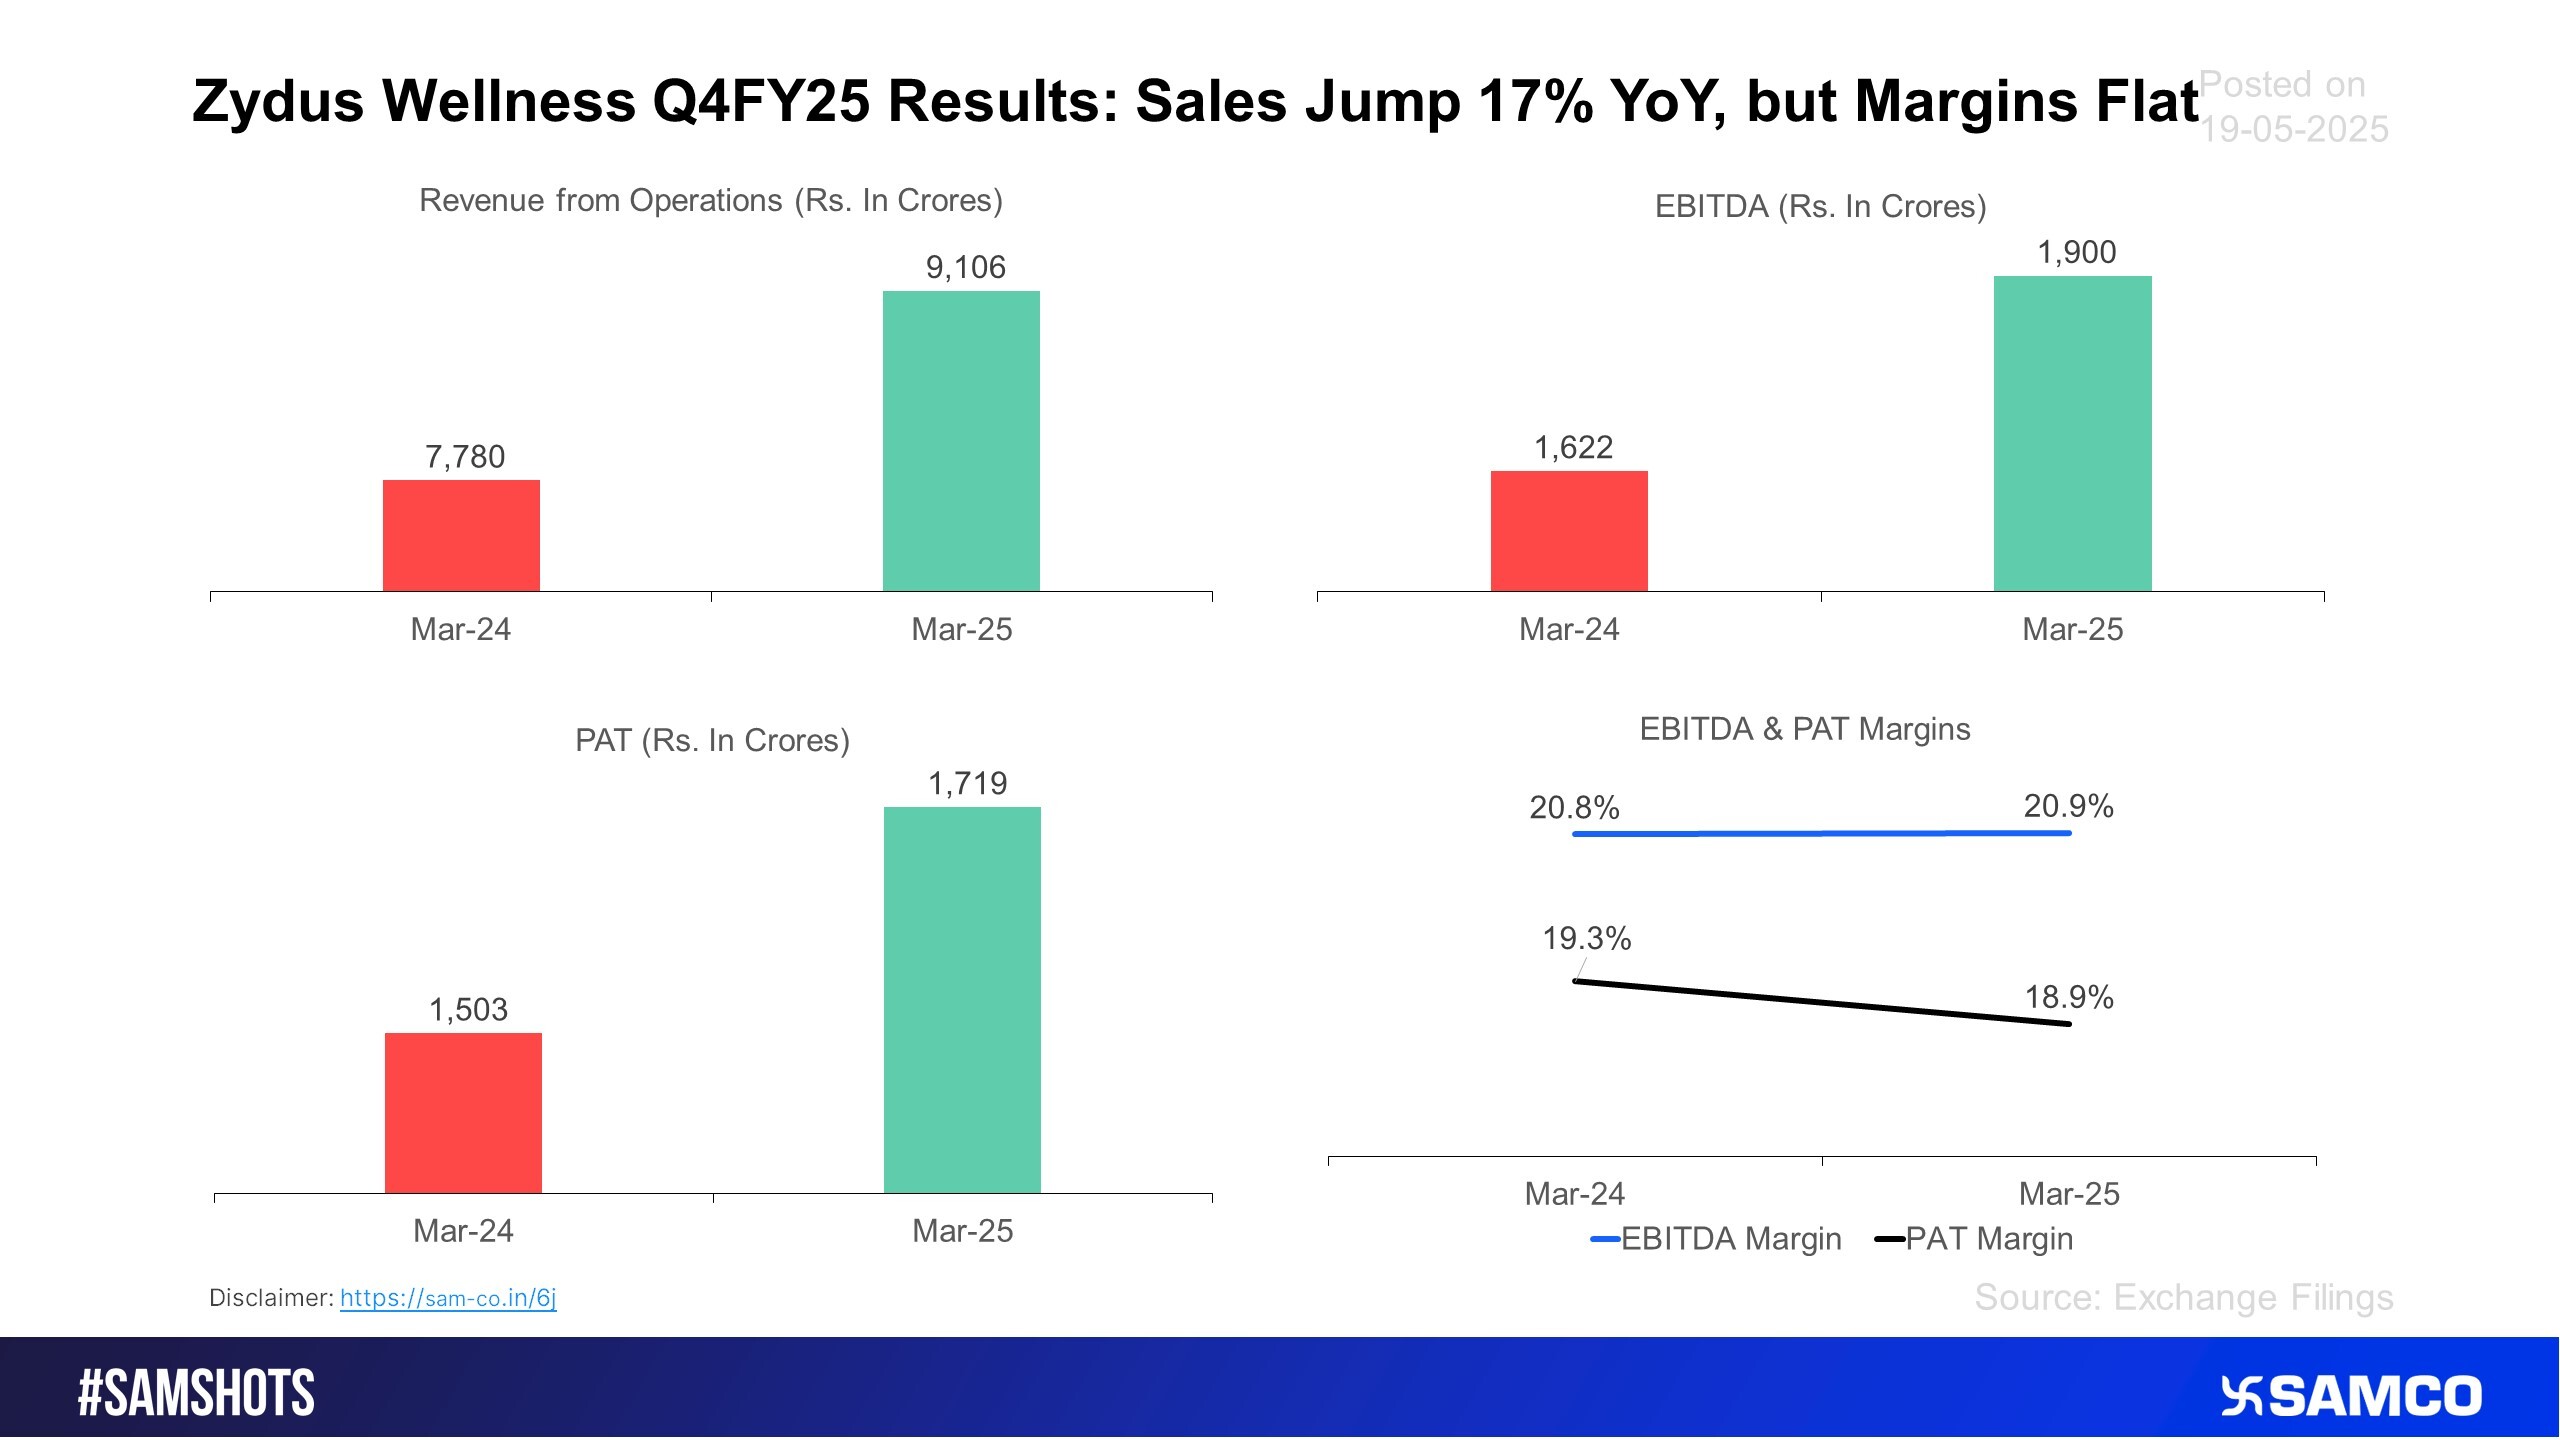
Here’s how the quarter went for Zydus Wellness for the Q4FY25
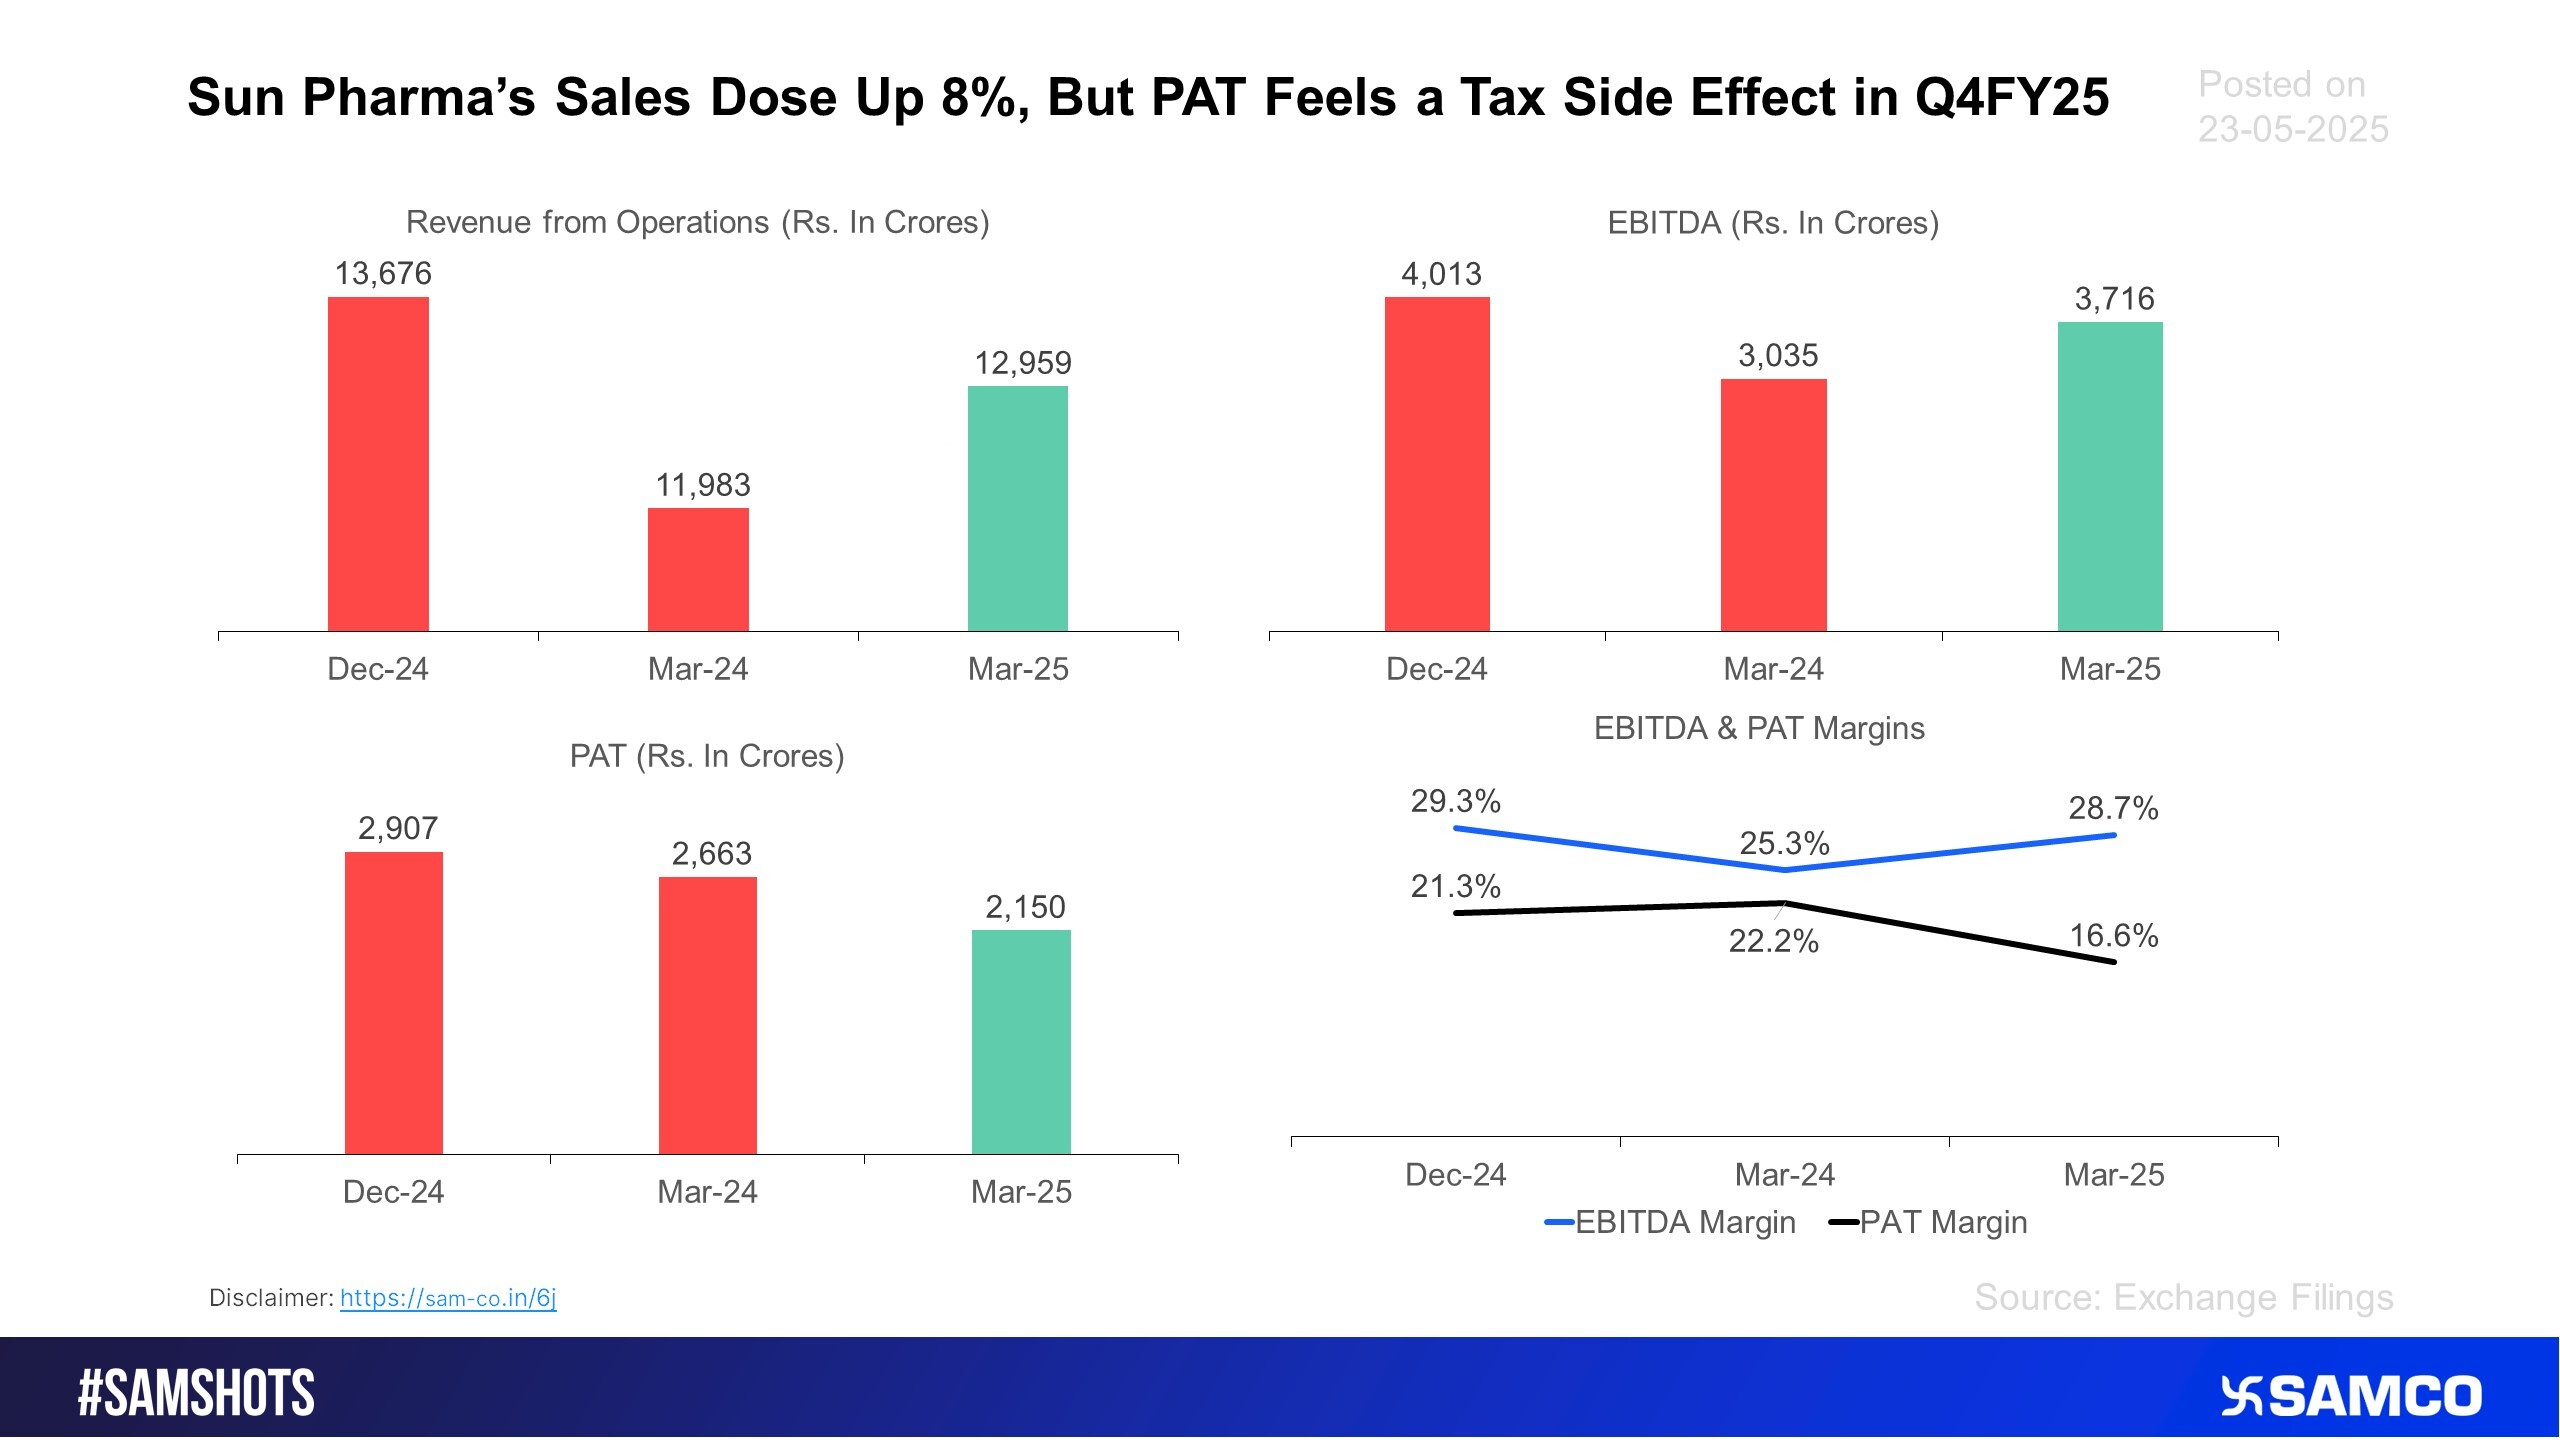
Sun Pharma’s below estimate results shocked the investors, below is the graphical representation of the same:
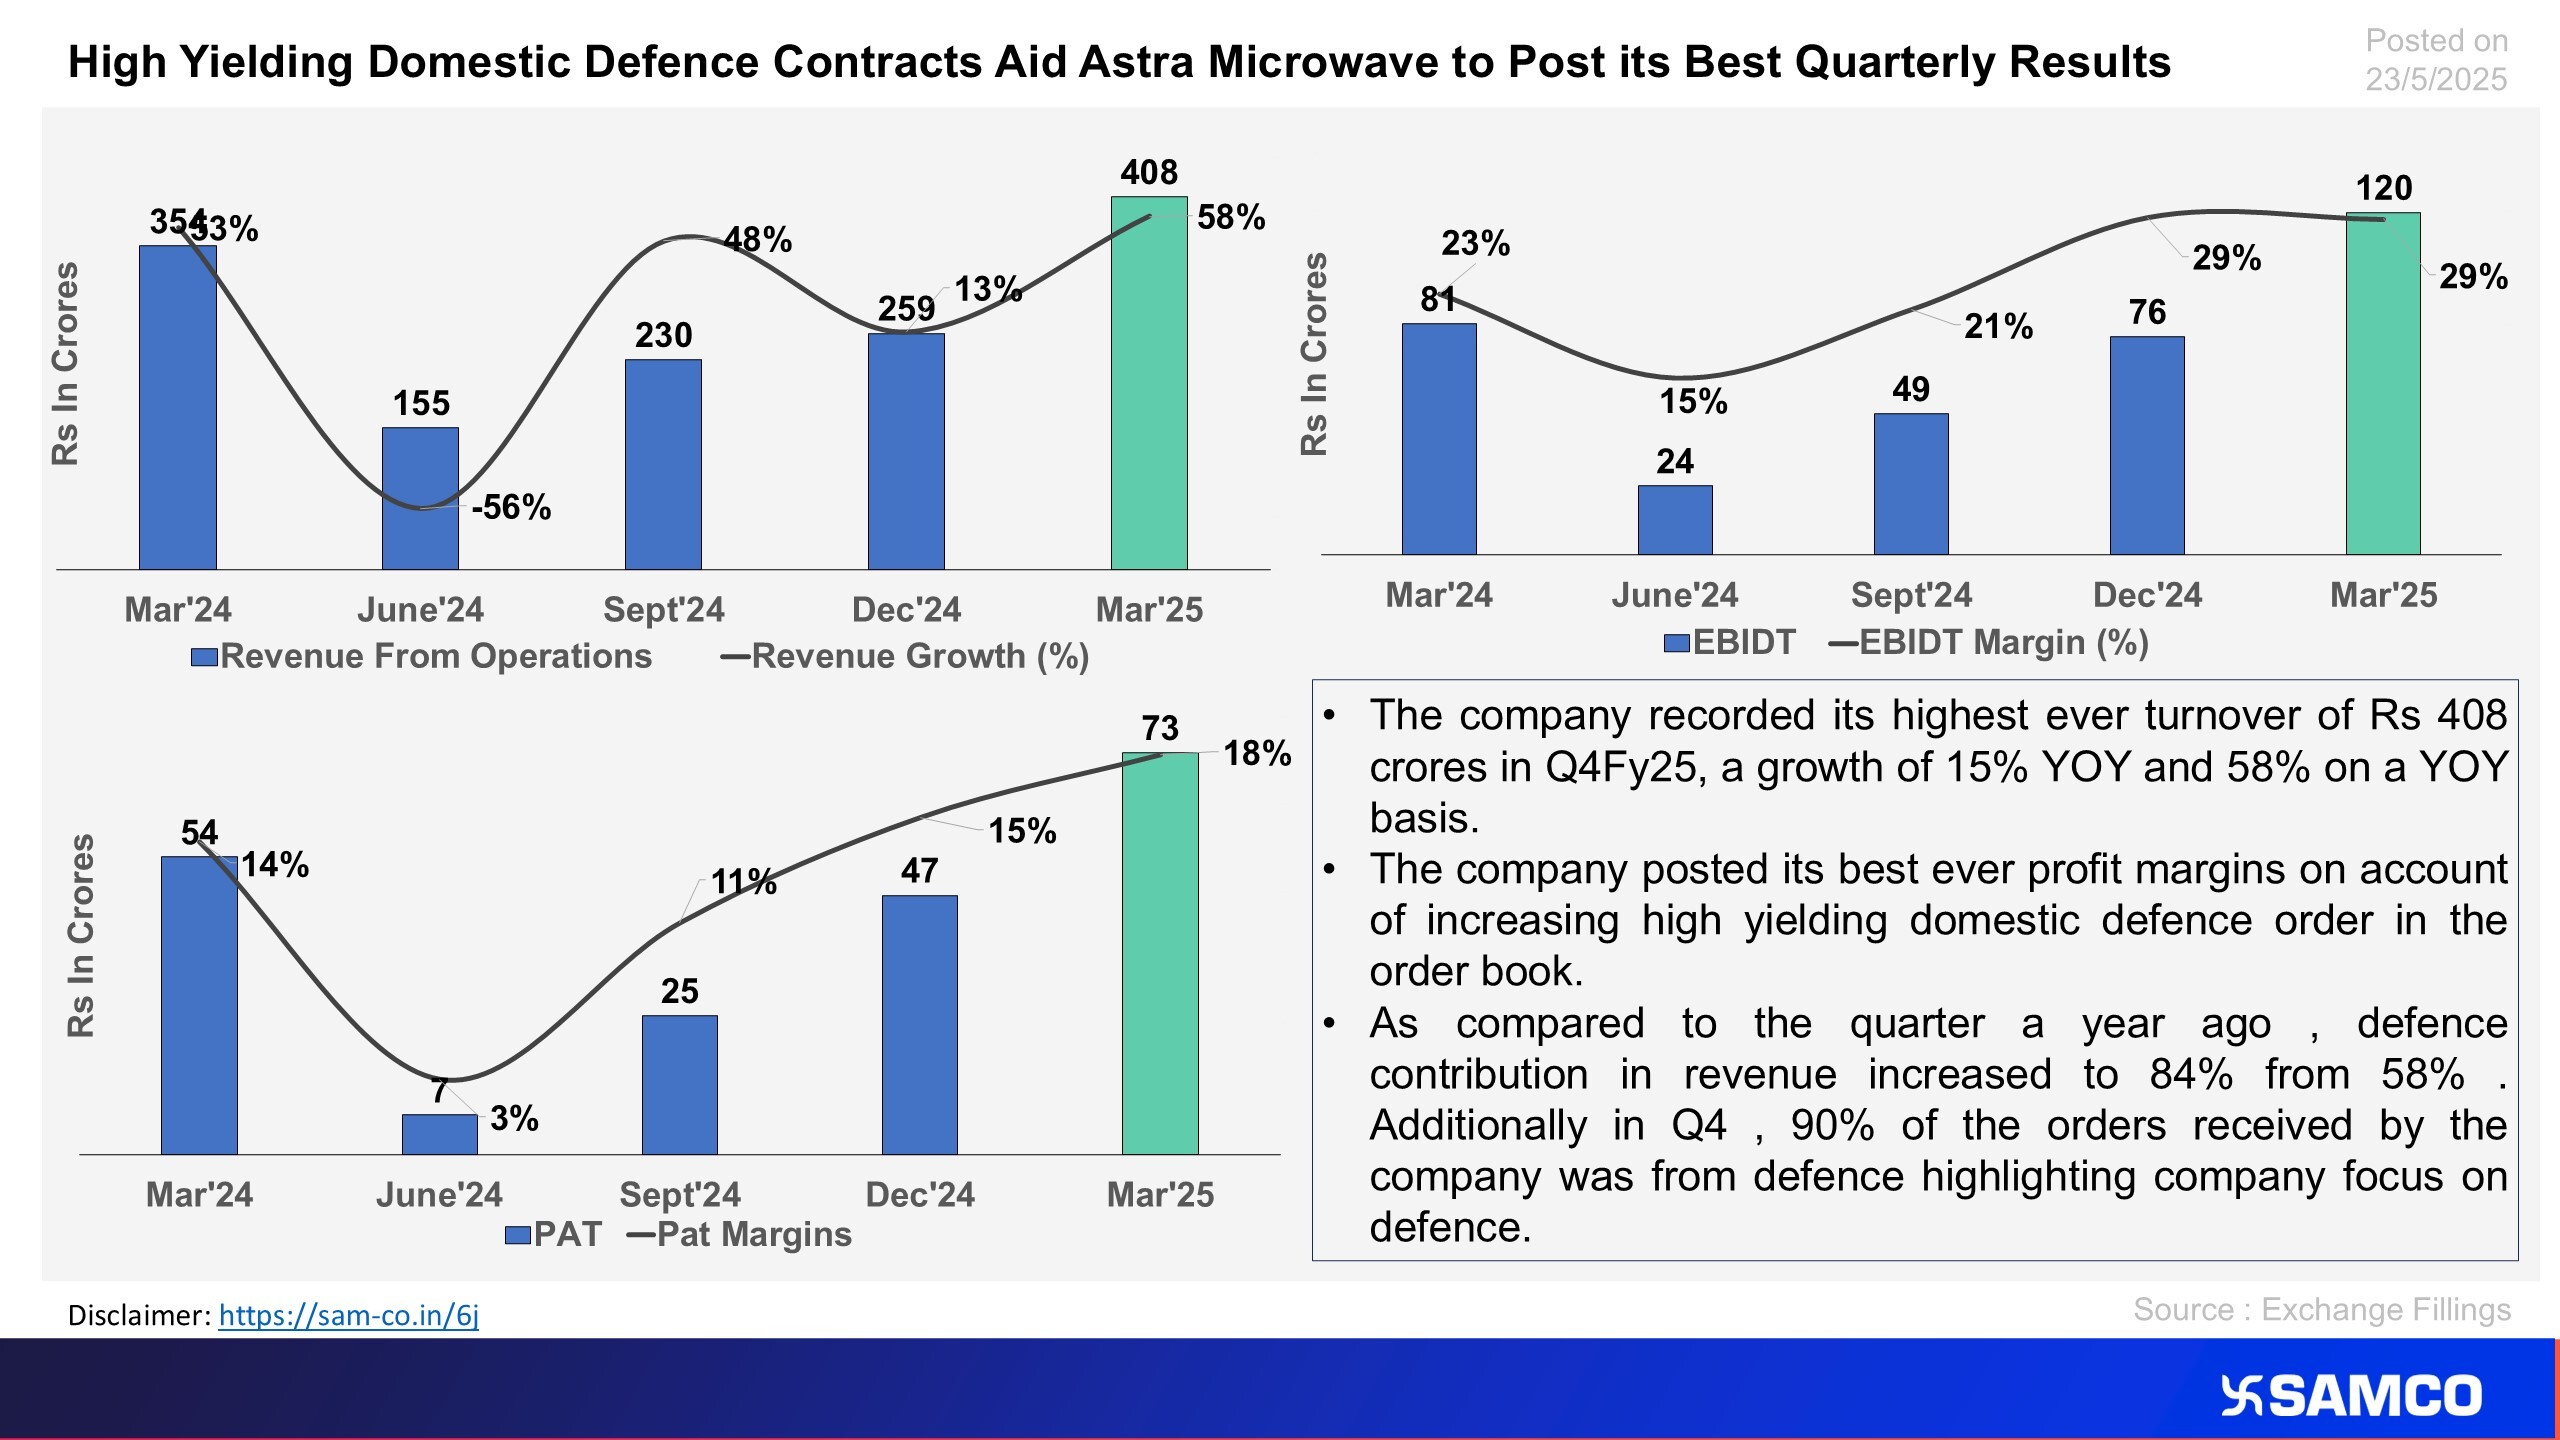
The chart explains the rationale behind the rise in margins of Astra Microwave
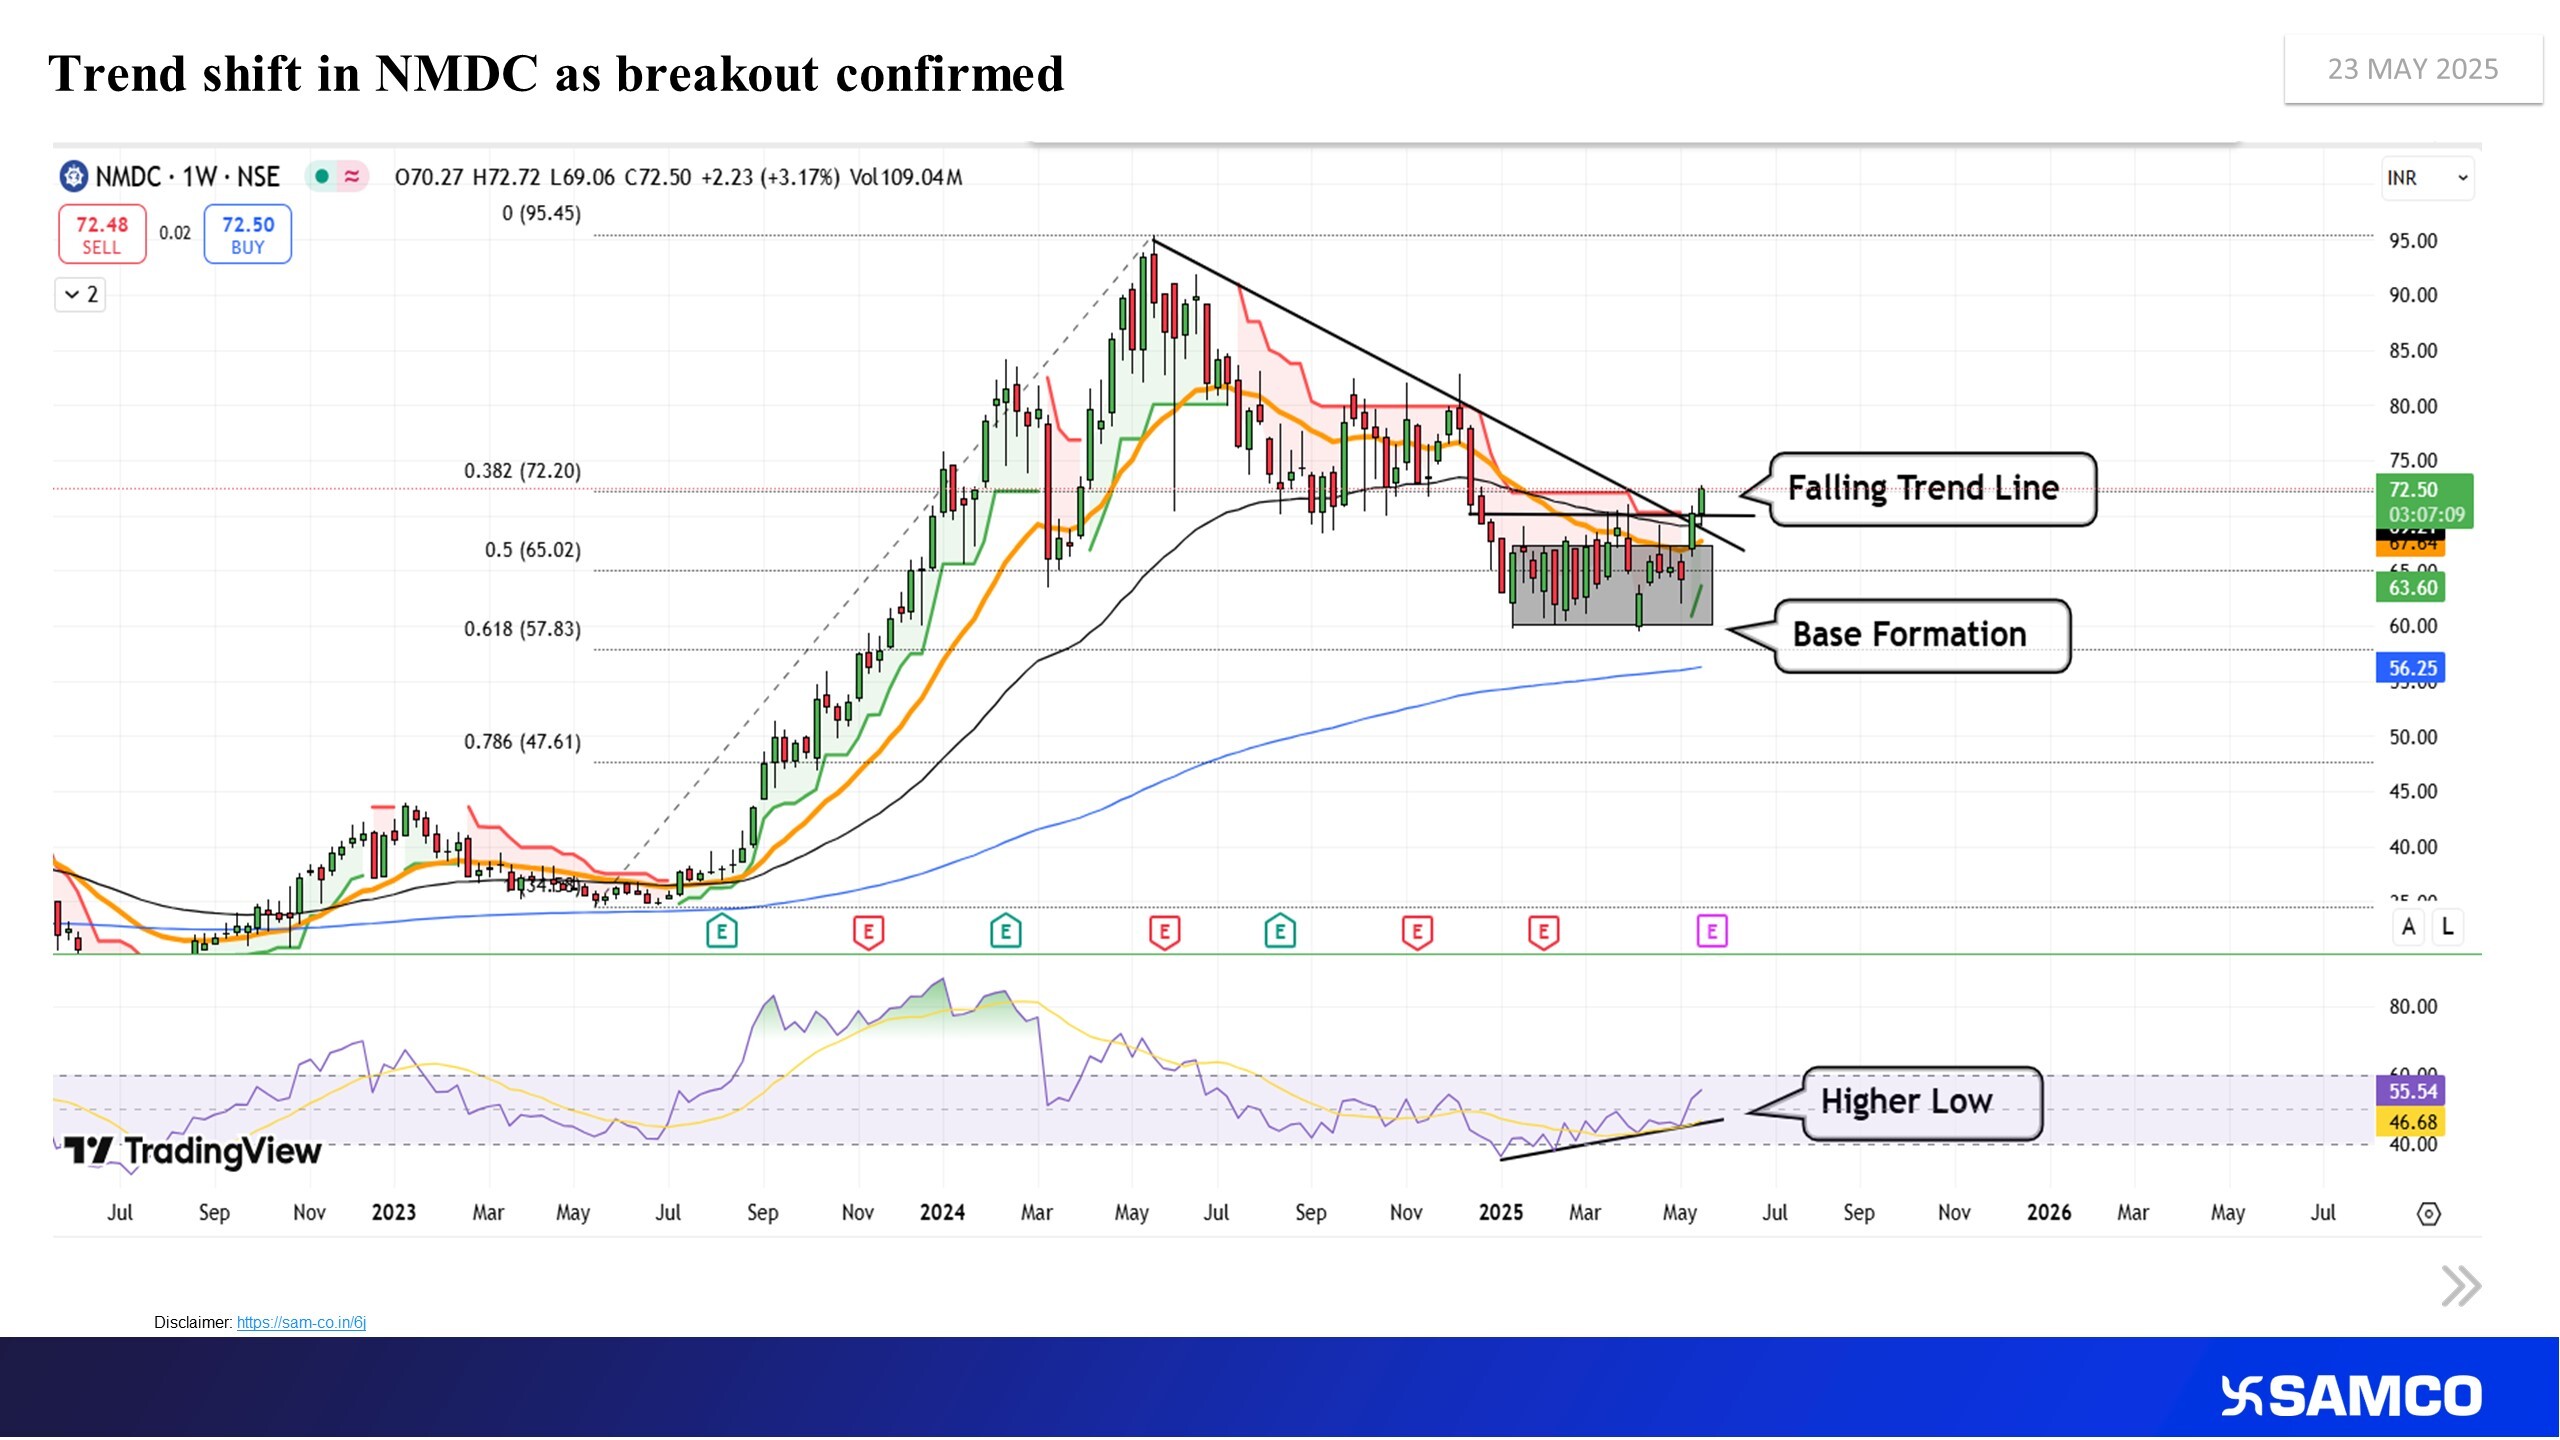
Bullish reversal brewing in NMDC
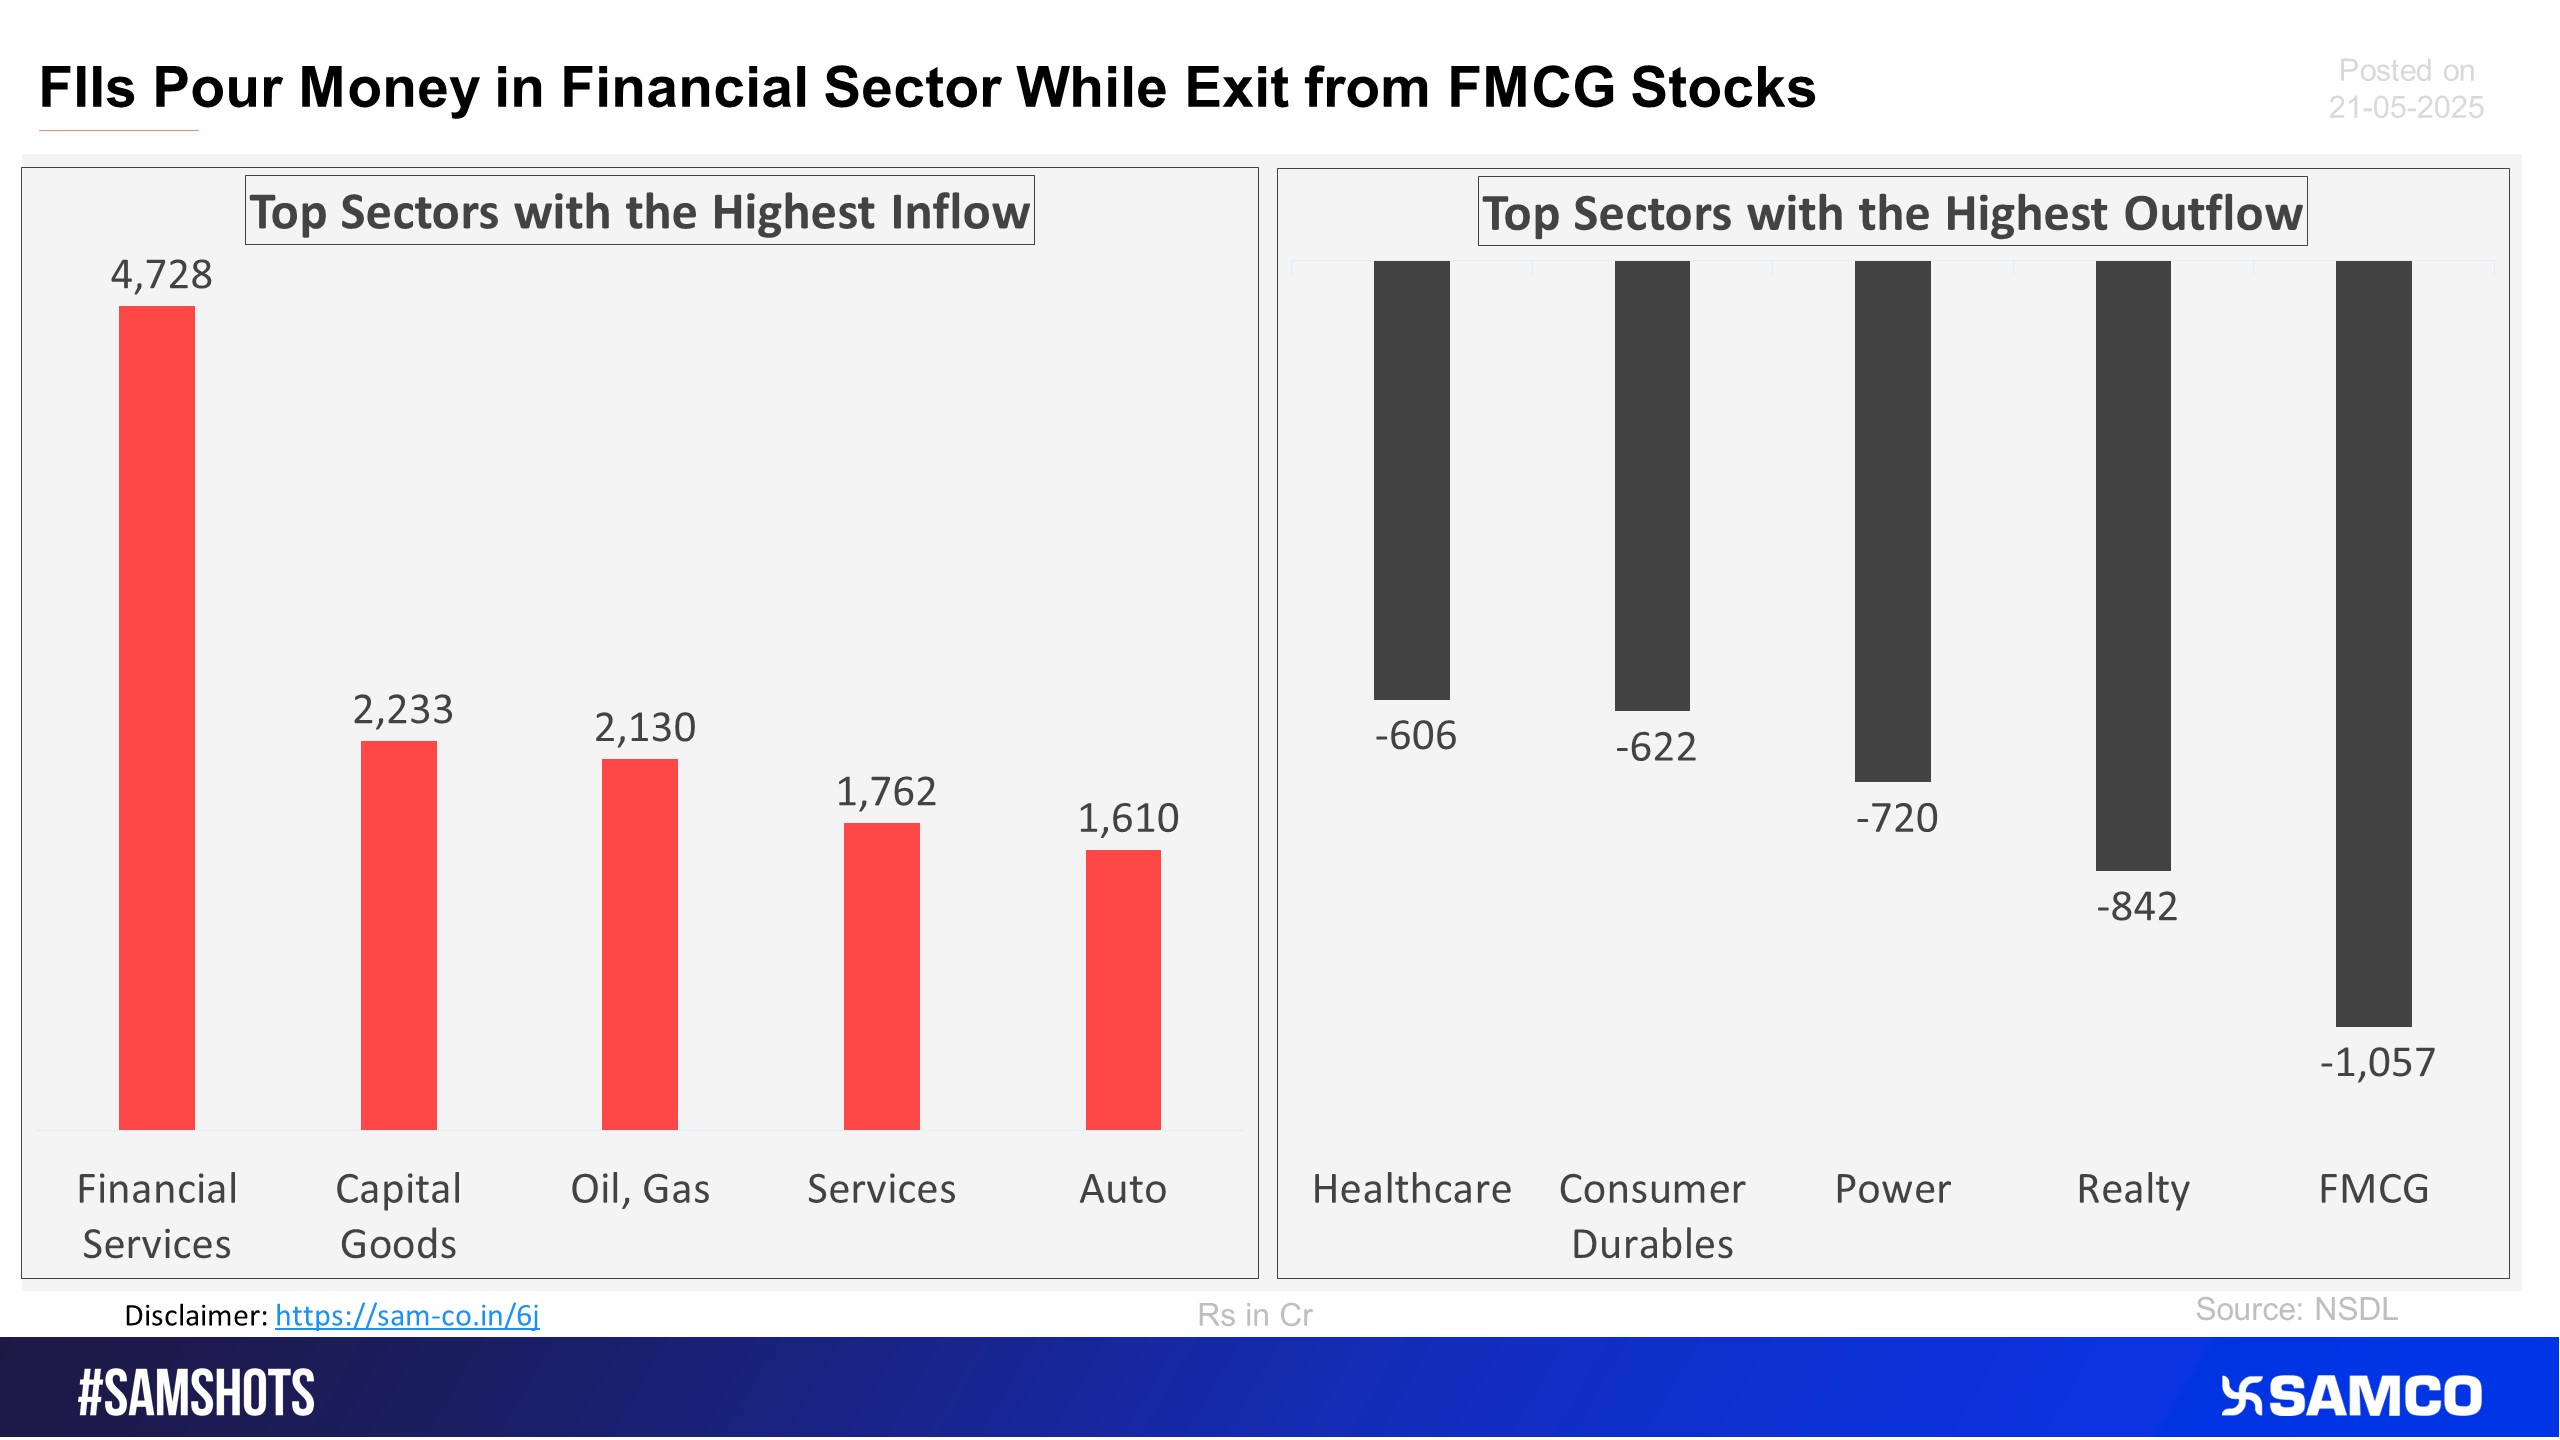
The accompanying chart shows the top 5 sectors that witnessed FPI’s highest inflow and outflow in the latest quarter.
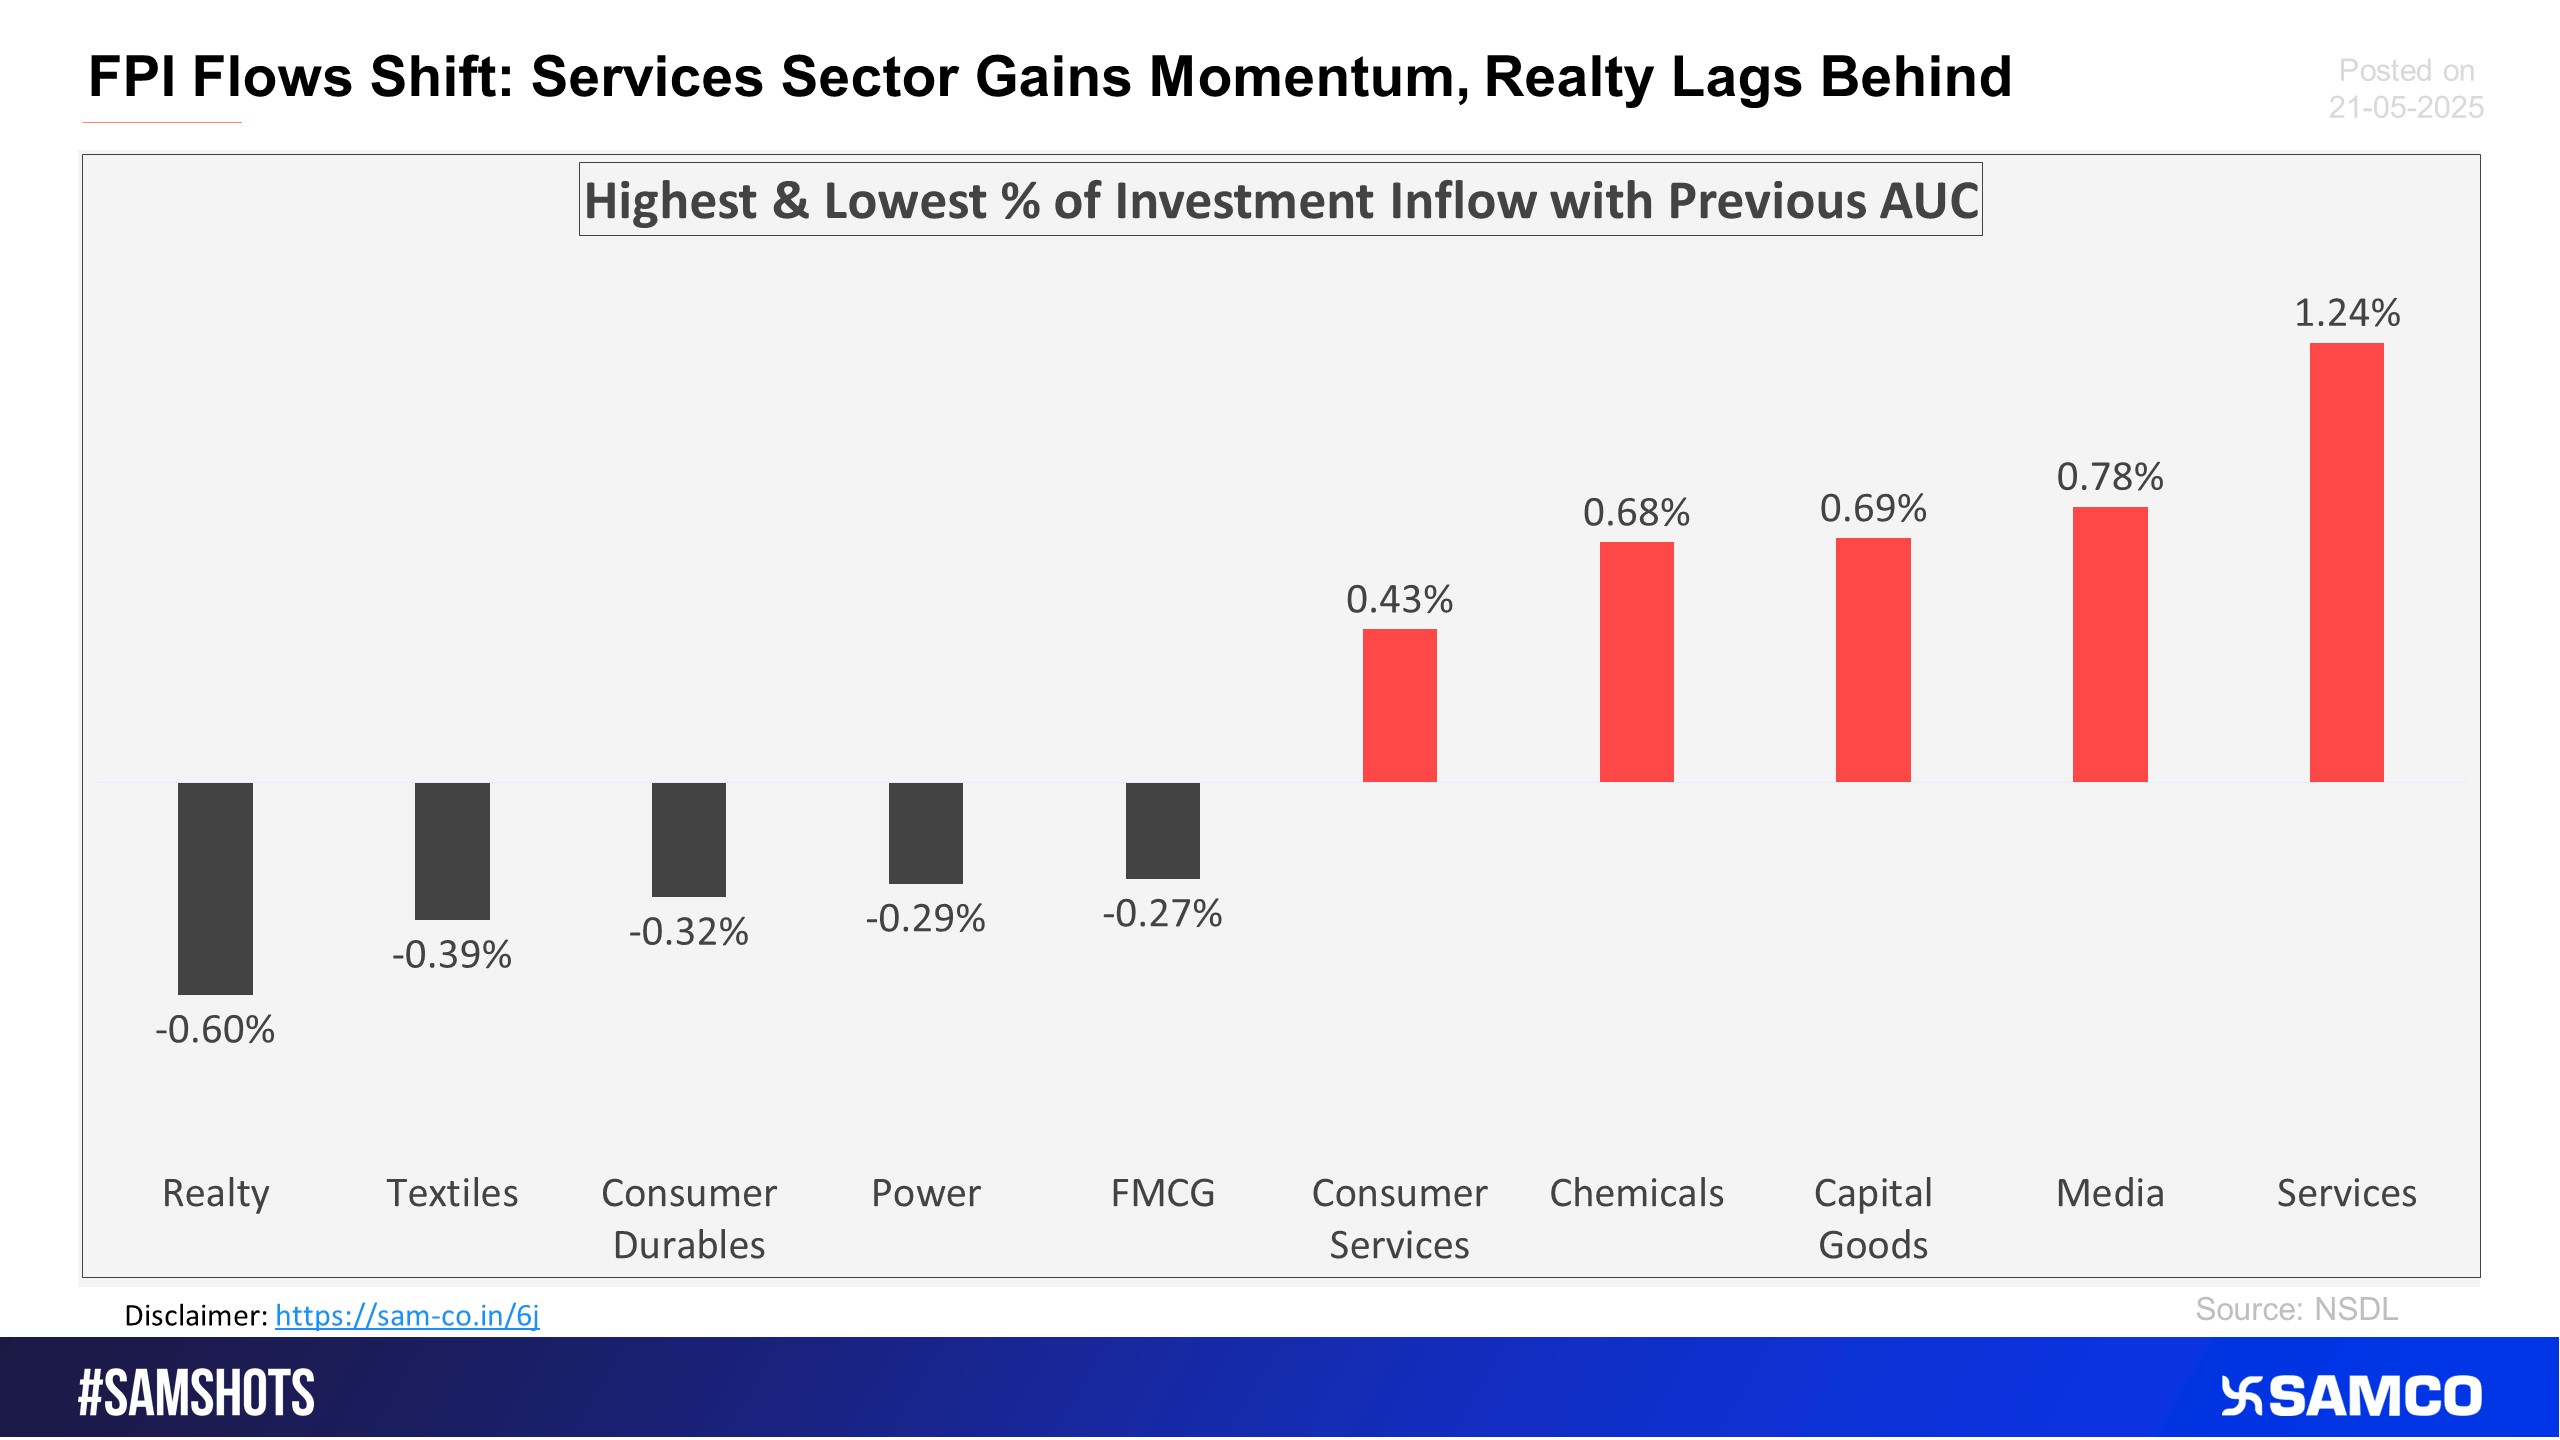
The below chart presents the highest & lowest percentage inflow of investment in the latest fortnight compared to the previous period AUC (Asset Under Custody) of FPI.
The chart below displays sectors that witnessed the highest and lowest change in the weightage of sectoral FPI holdings to the total FPI holdings compared to the previous fortnight.
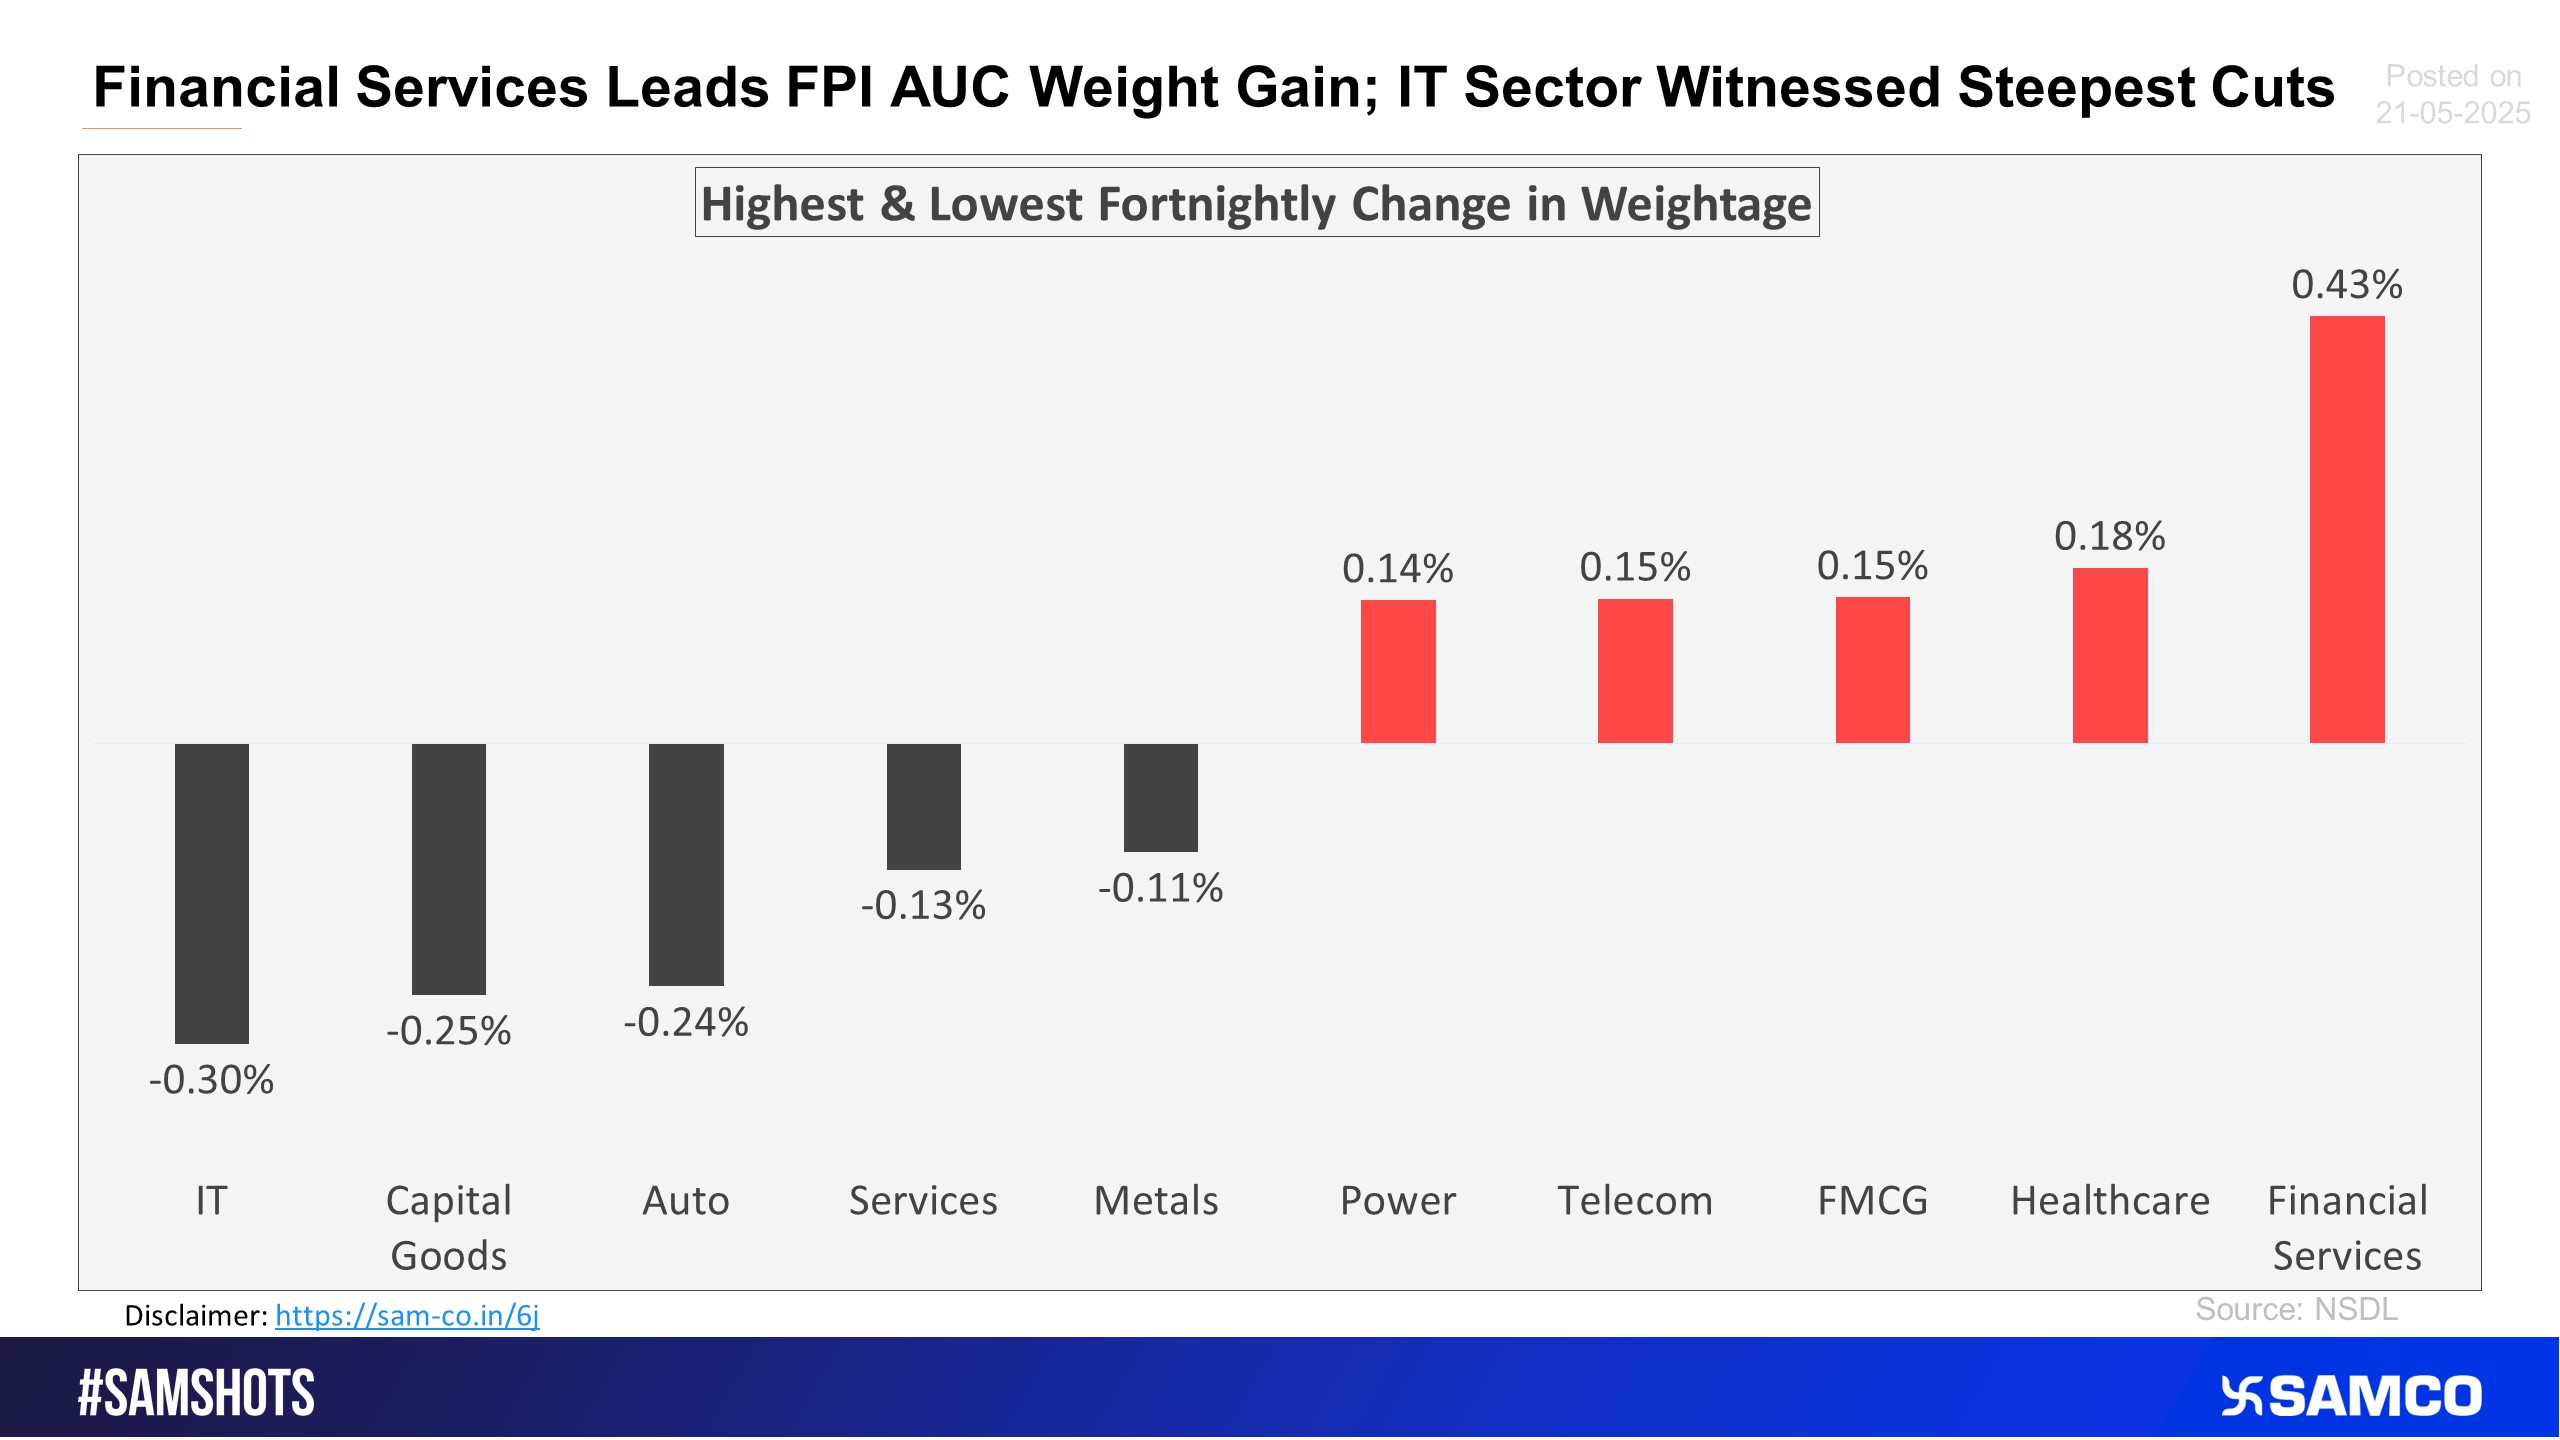
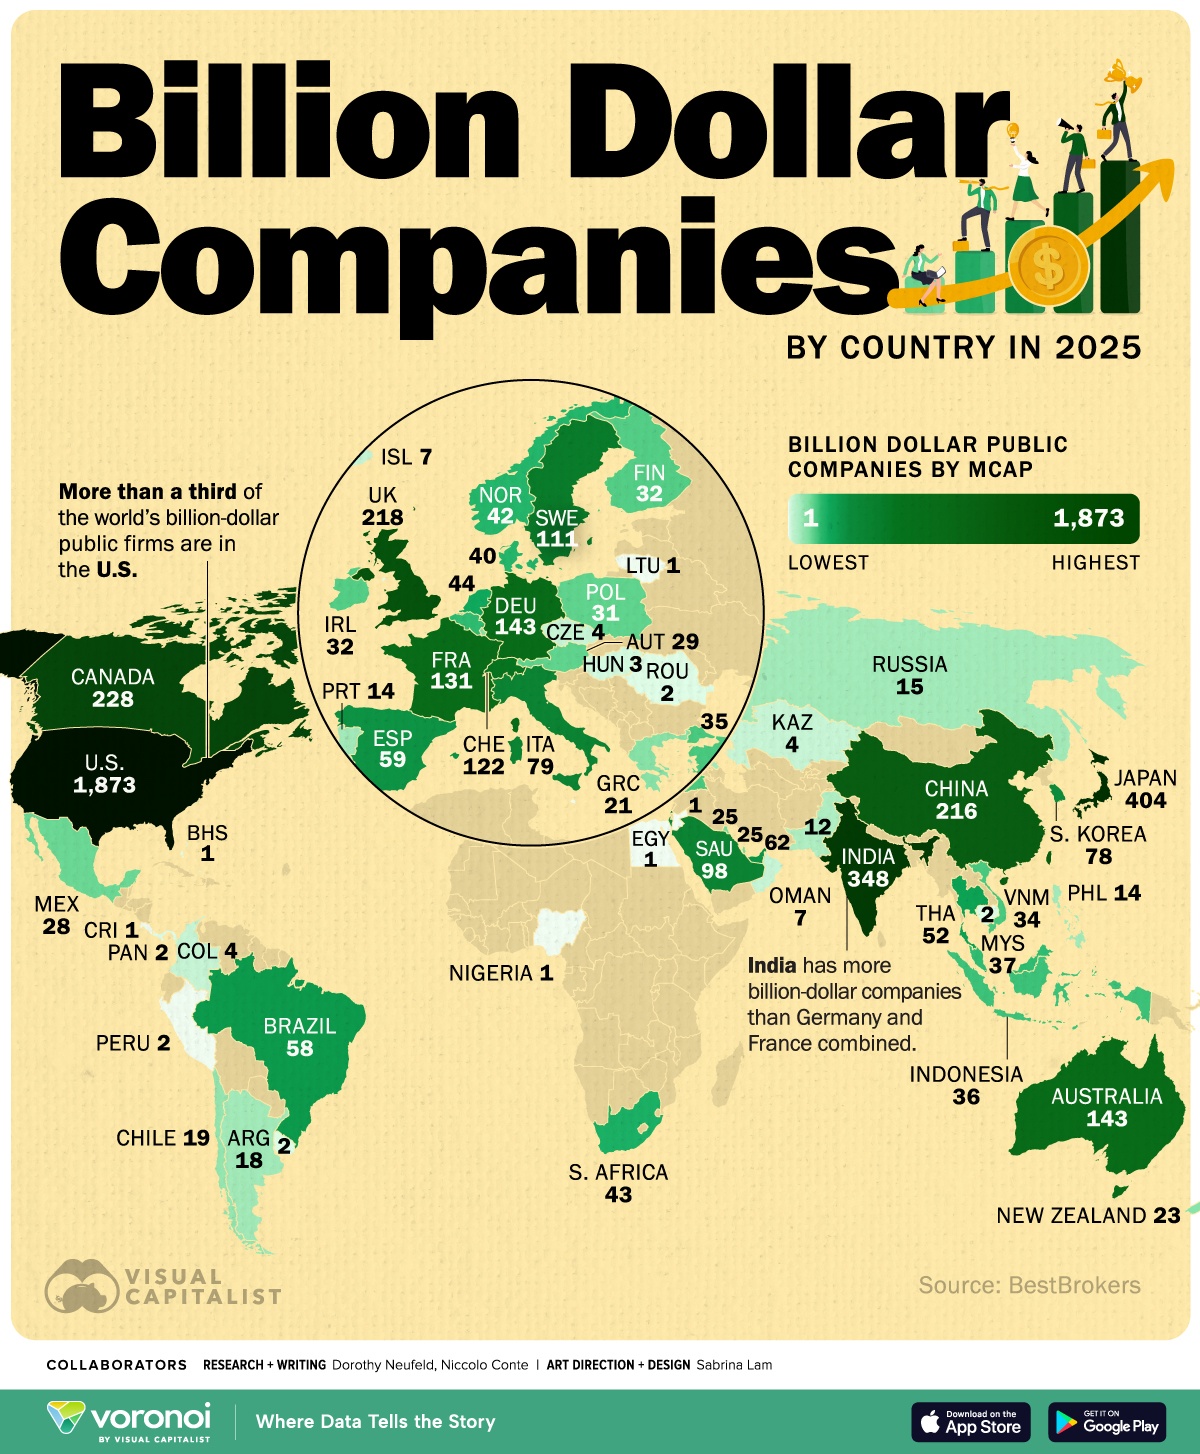
Image Source: @ VisualCap (Twitter)


 Easy & quick
1. Register on SCORES portal
2. Mandatory details for filling complaints on SCORES
Name | PAN | Address | Mobile | Number | E-mail ID
3. Benefits
Effective Communication
Speedy redressal of the grievances
