After a weak closing in the previous week, Indian equities staged a sharp rebound with Nifty gaining 1.39% during the week. Interestingly, the index opened at its weekly low, setting the tone for a positive momentum that was largely driven by the GST rate rationalisation announced by the Finance Minister. The reforms included a reduction in rates on several daily consumption items and a complete waiver of GST on insurance premiums, boosting investor sentiment.
On the global front, the India-China-Russia trilateral meet at the SCO summit in China was closely watched. The discussions are expected to open new trade avenues for India at a time when the U.S. administration under President Trump has imposed tariffs on Indian exports.
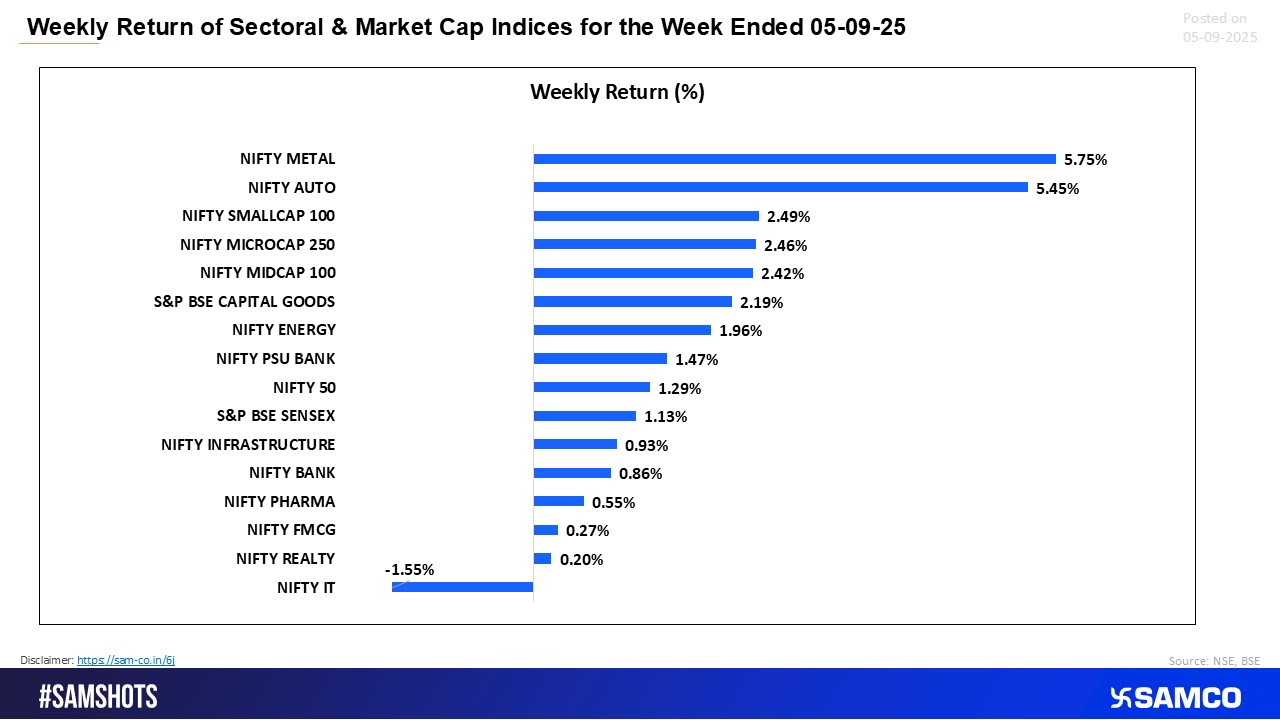
From a sectoral perspective, Nifty Metal led the rally with a robust 5.75% gain, supported by strong global commodity cues, while Nifty Auto advanced 5.45% amid expectations of a demand recovery. In contrast, Nifty IT declined 1.55%, reflecting global uncertainties and cautious outlook on tech spending.
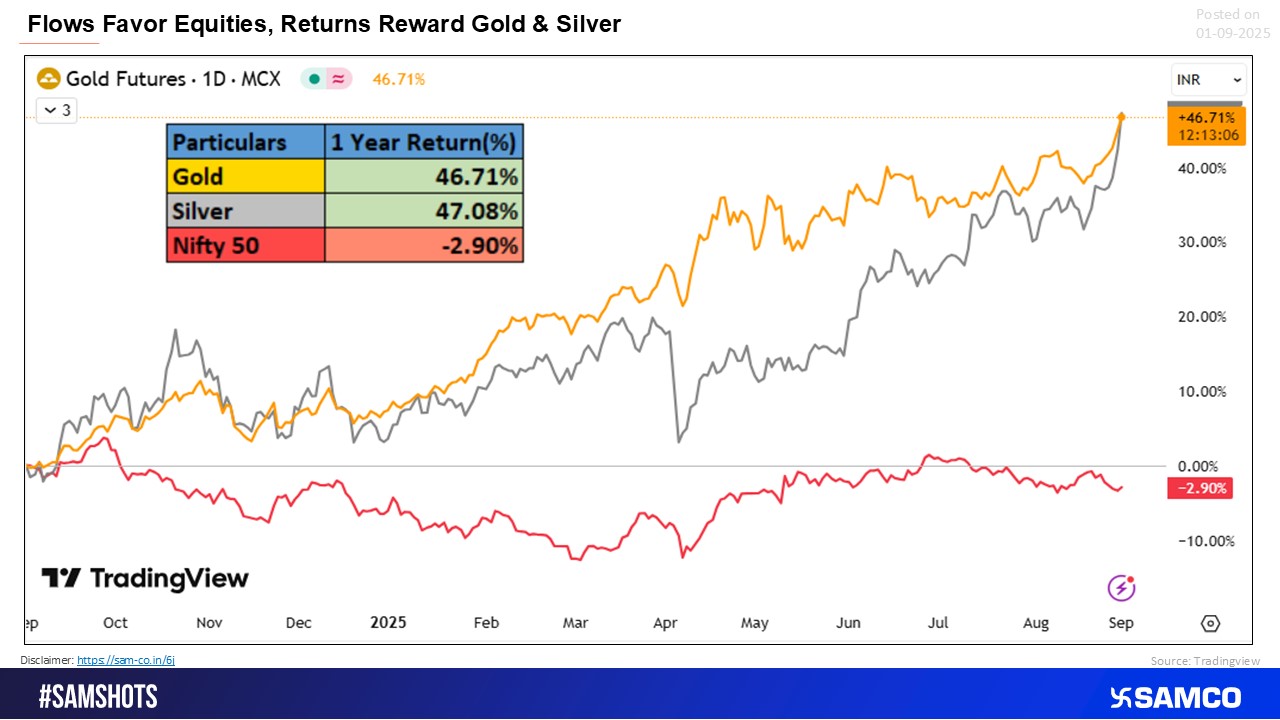
Meanwhile, heightened market volatility prompted investors to seek refuge in safe-haven assets. Gold futures rose 2.82%, marking yet another week of gains, while silver futures surged 3.56%, underscoring the defensive shift in investment flows.
Scroll down to understand more of such market news and perspectives for the week gone by in easily understandable charts.
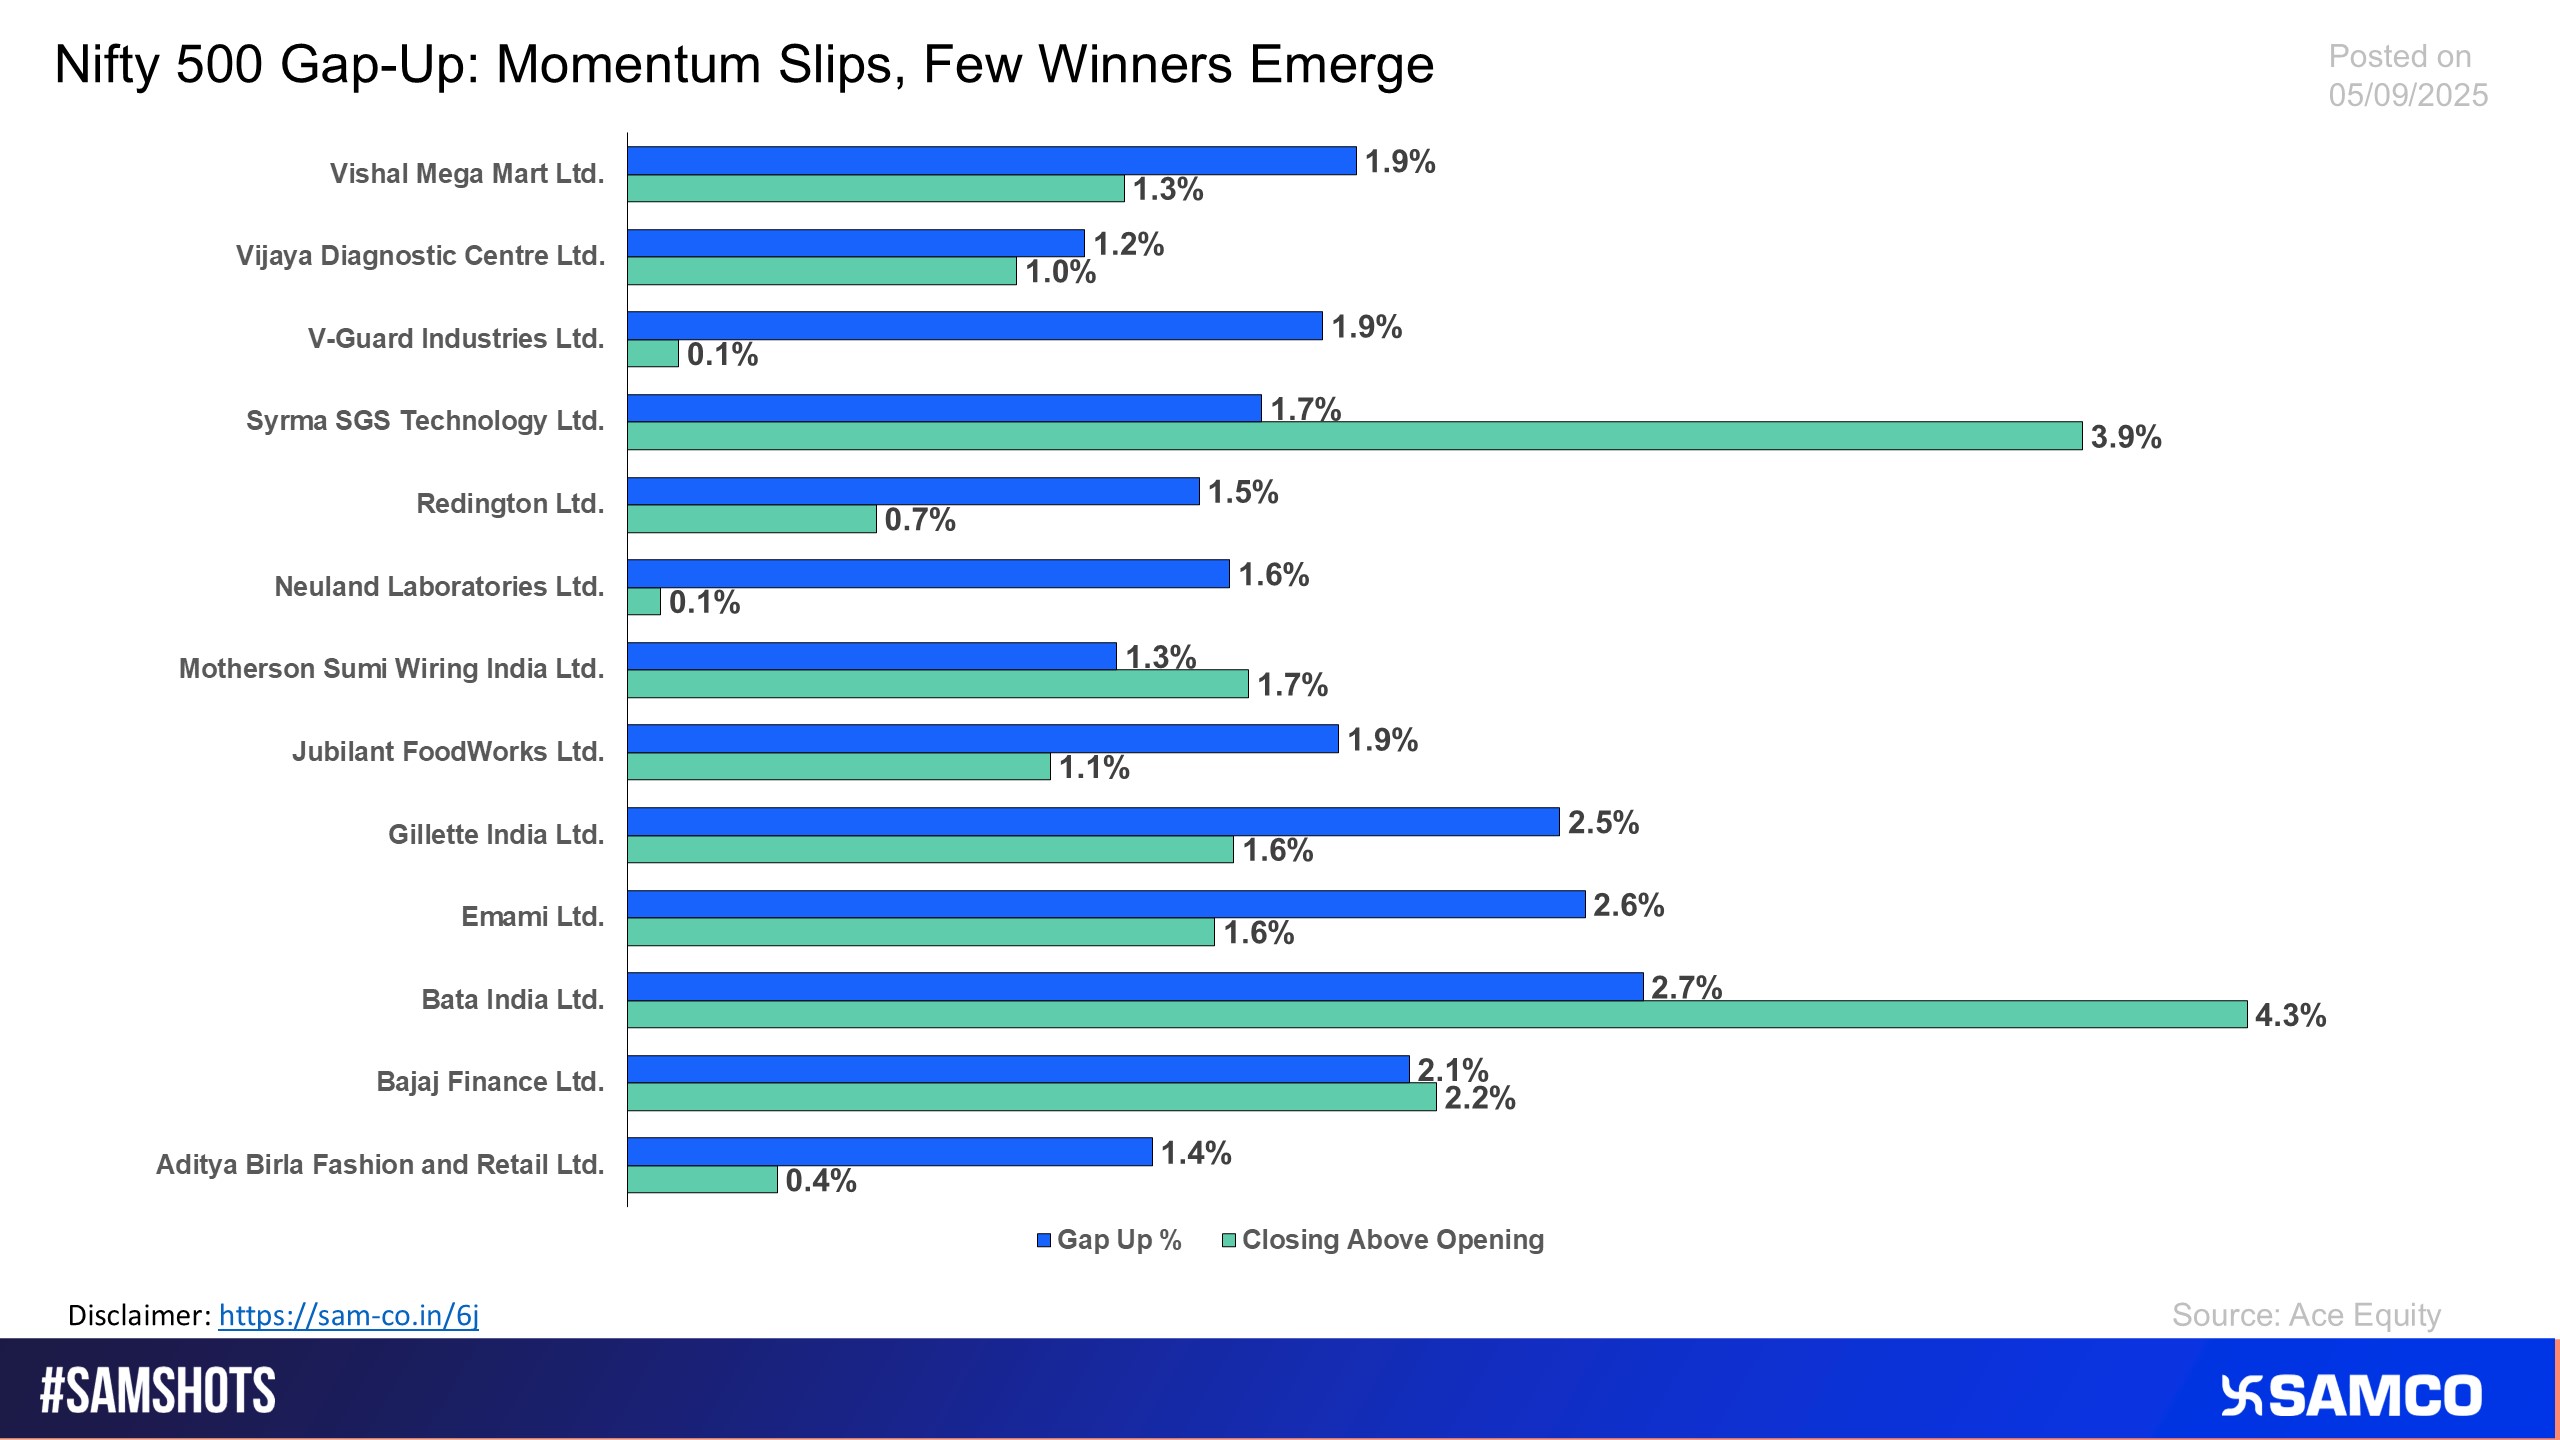
The chart lists the Nifty 500 stocks which sustain its momentum post gap up opening on 4th September


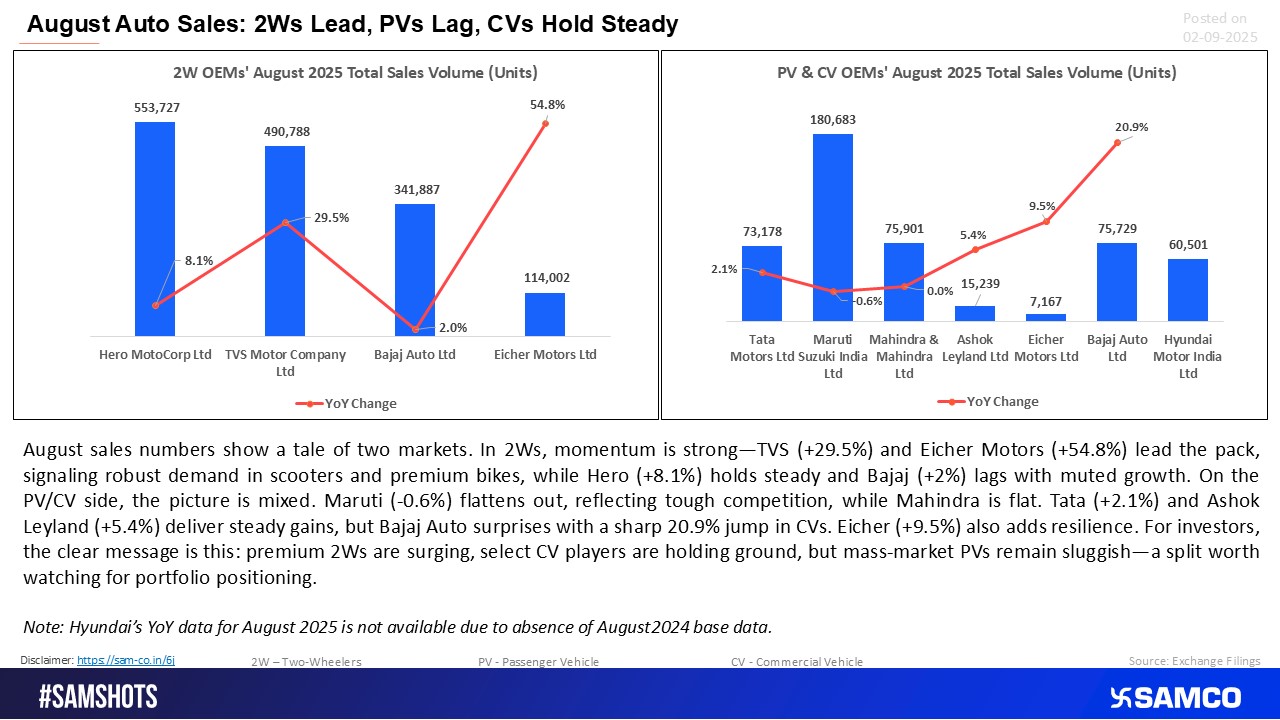
August auto sales reveal a split market, premium 2Ws surge, select CVs hold firm, but mass PVs stay sluggish
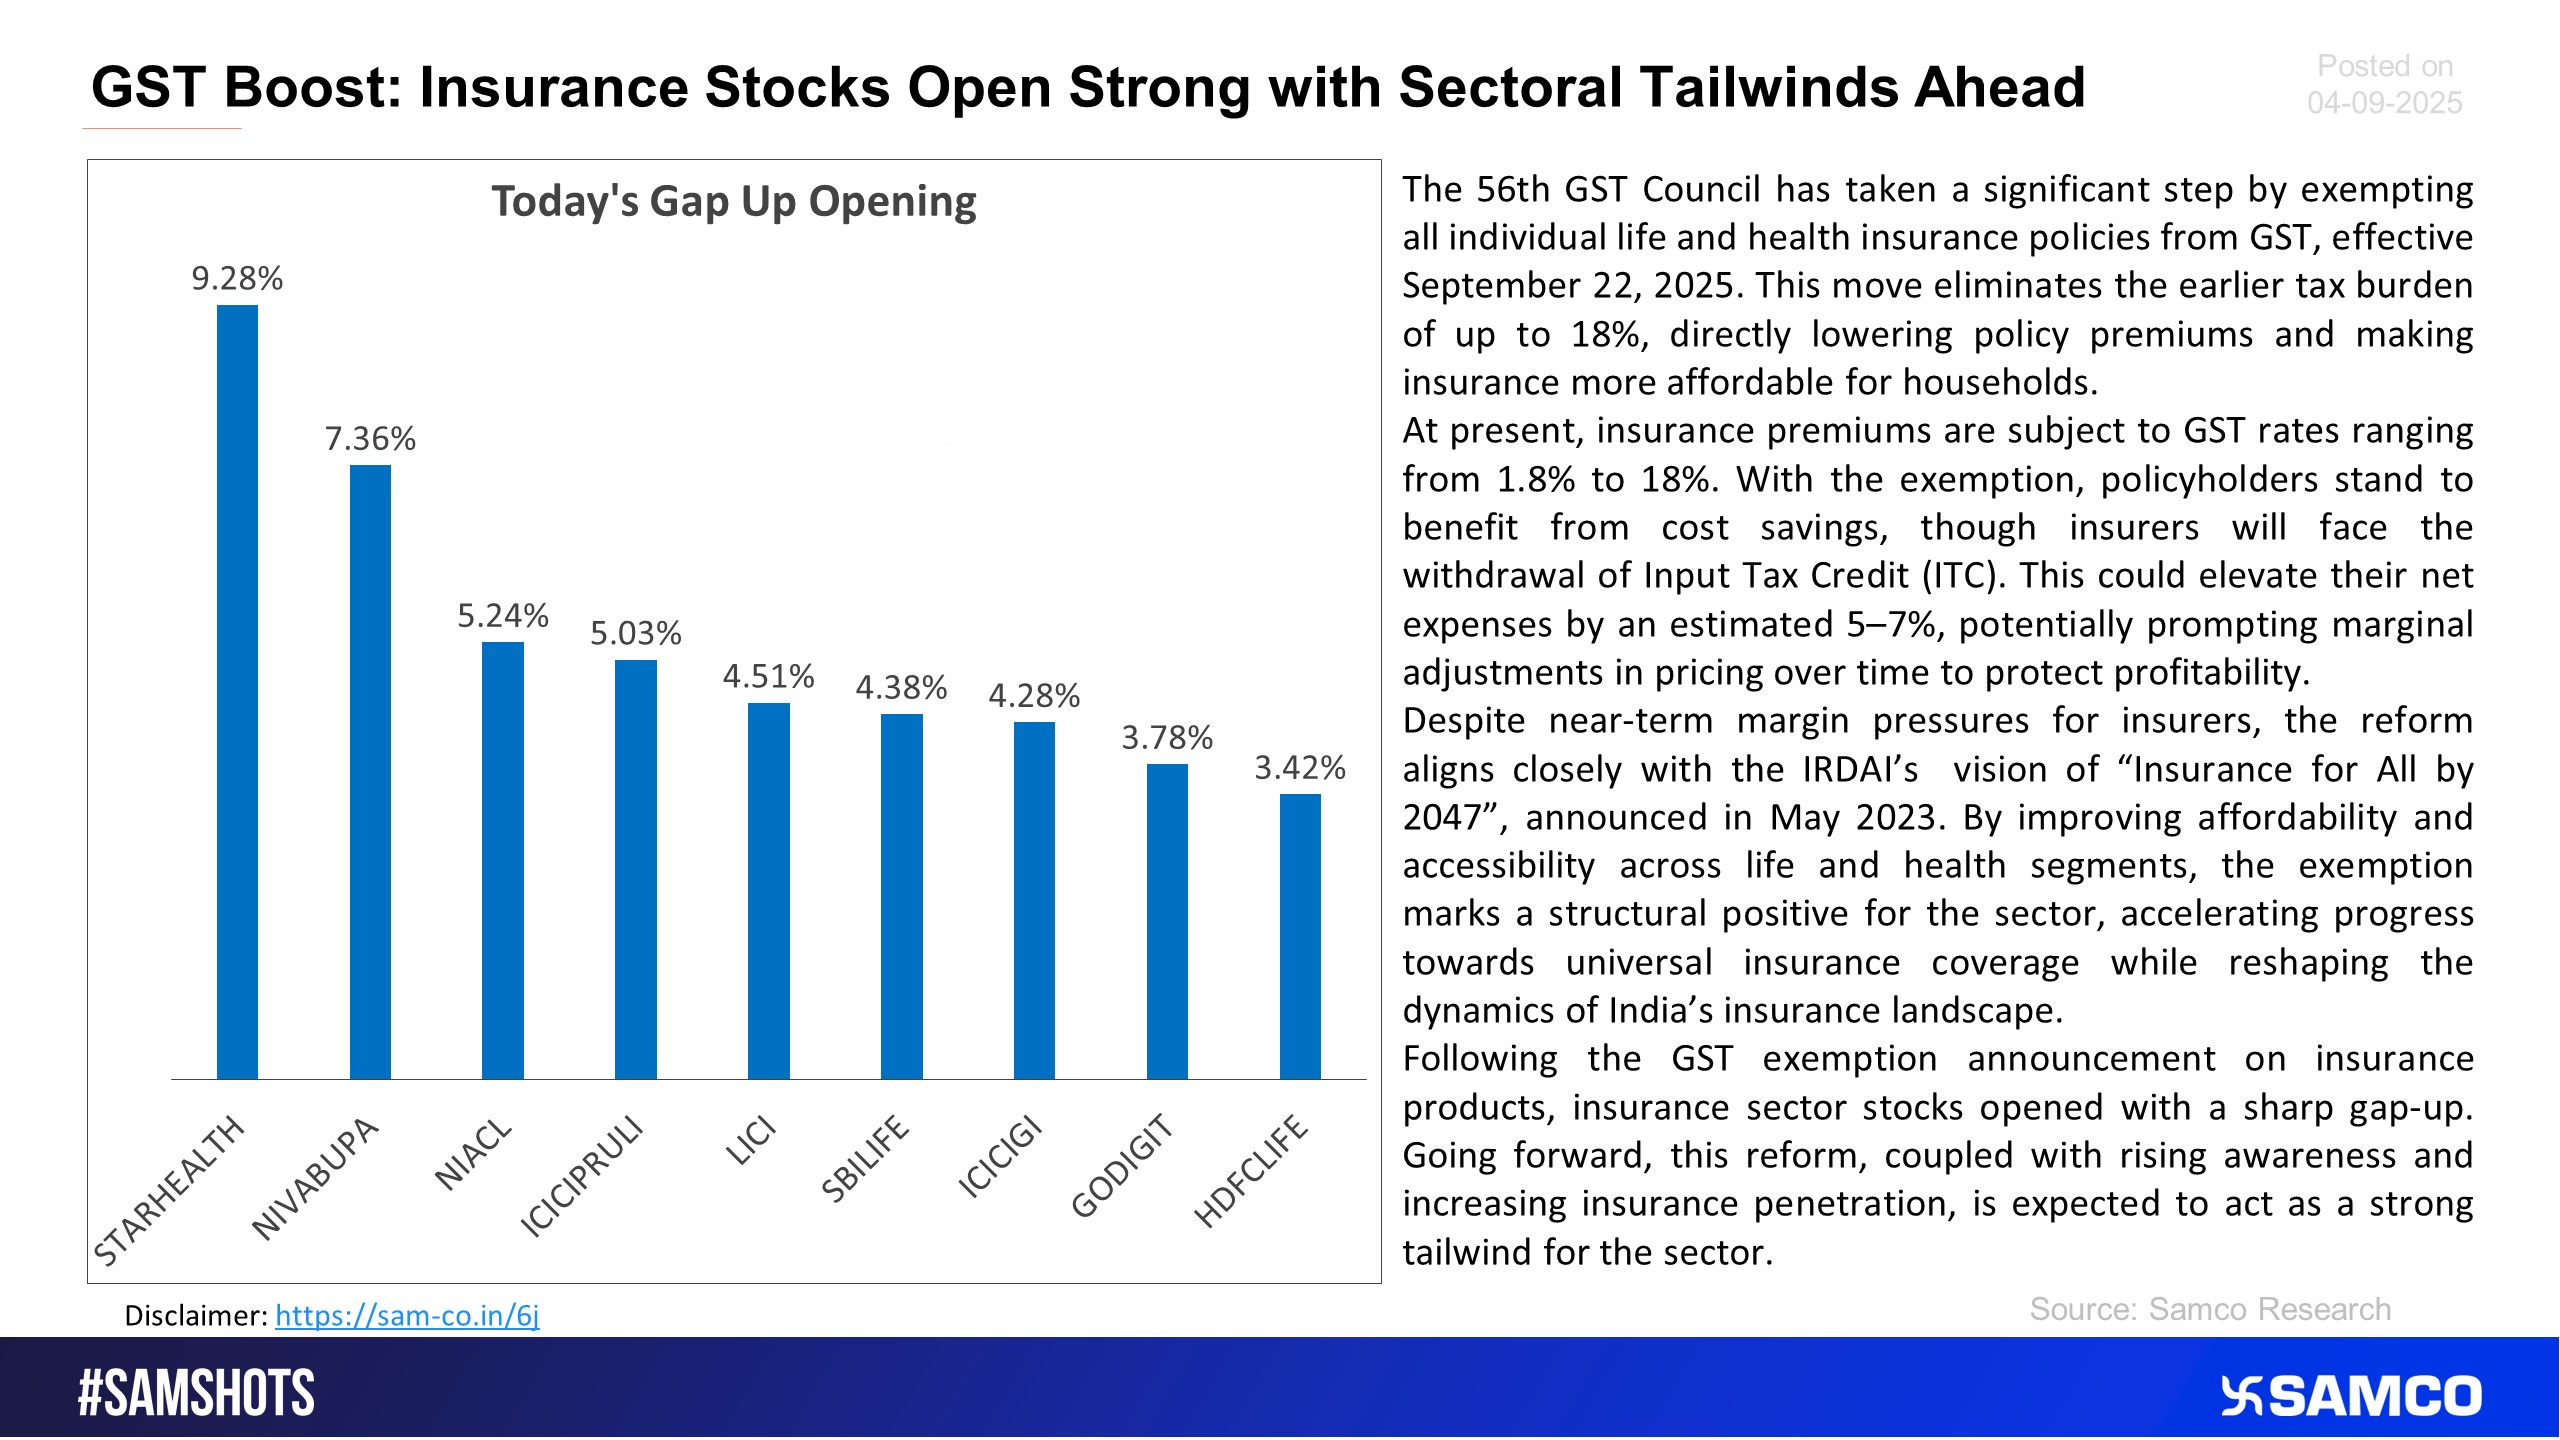
The chart below highlights the major GST relief on the Insurance sector in the latest GST reform announcement.
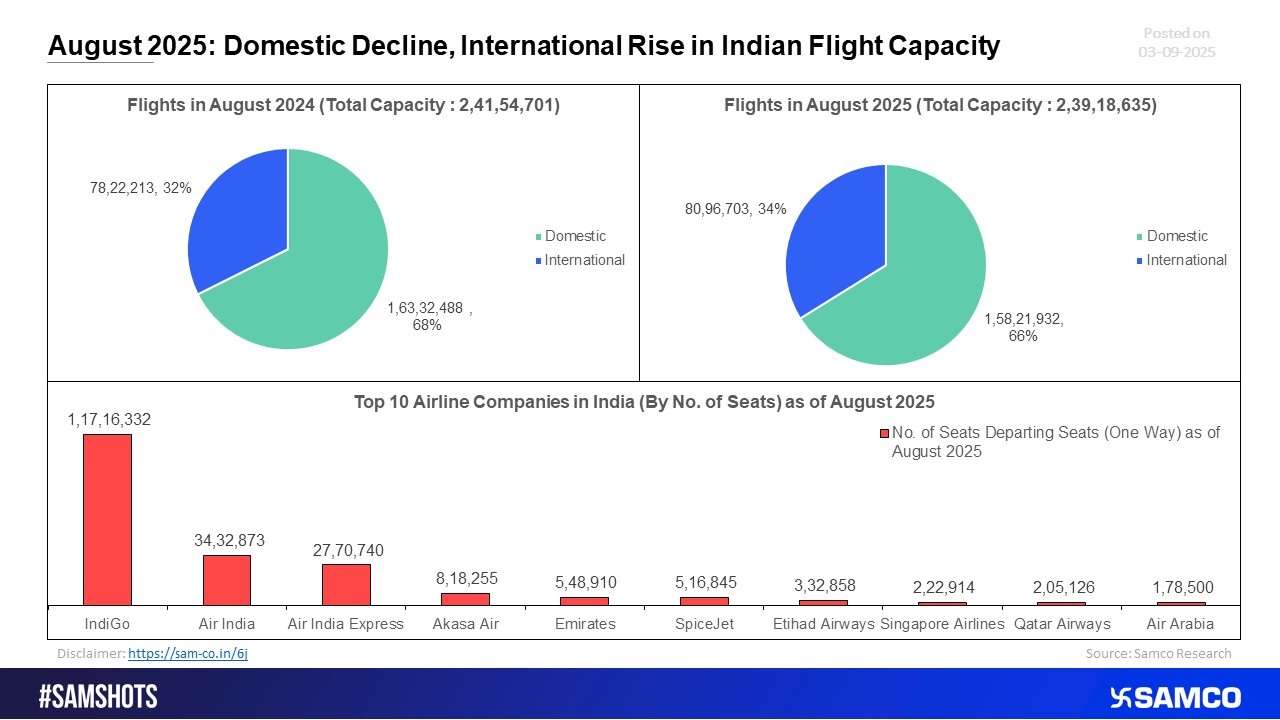
Contrasting Trends in August: Domestic Aviation Declines YoY as International Sector Gains Traction
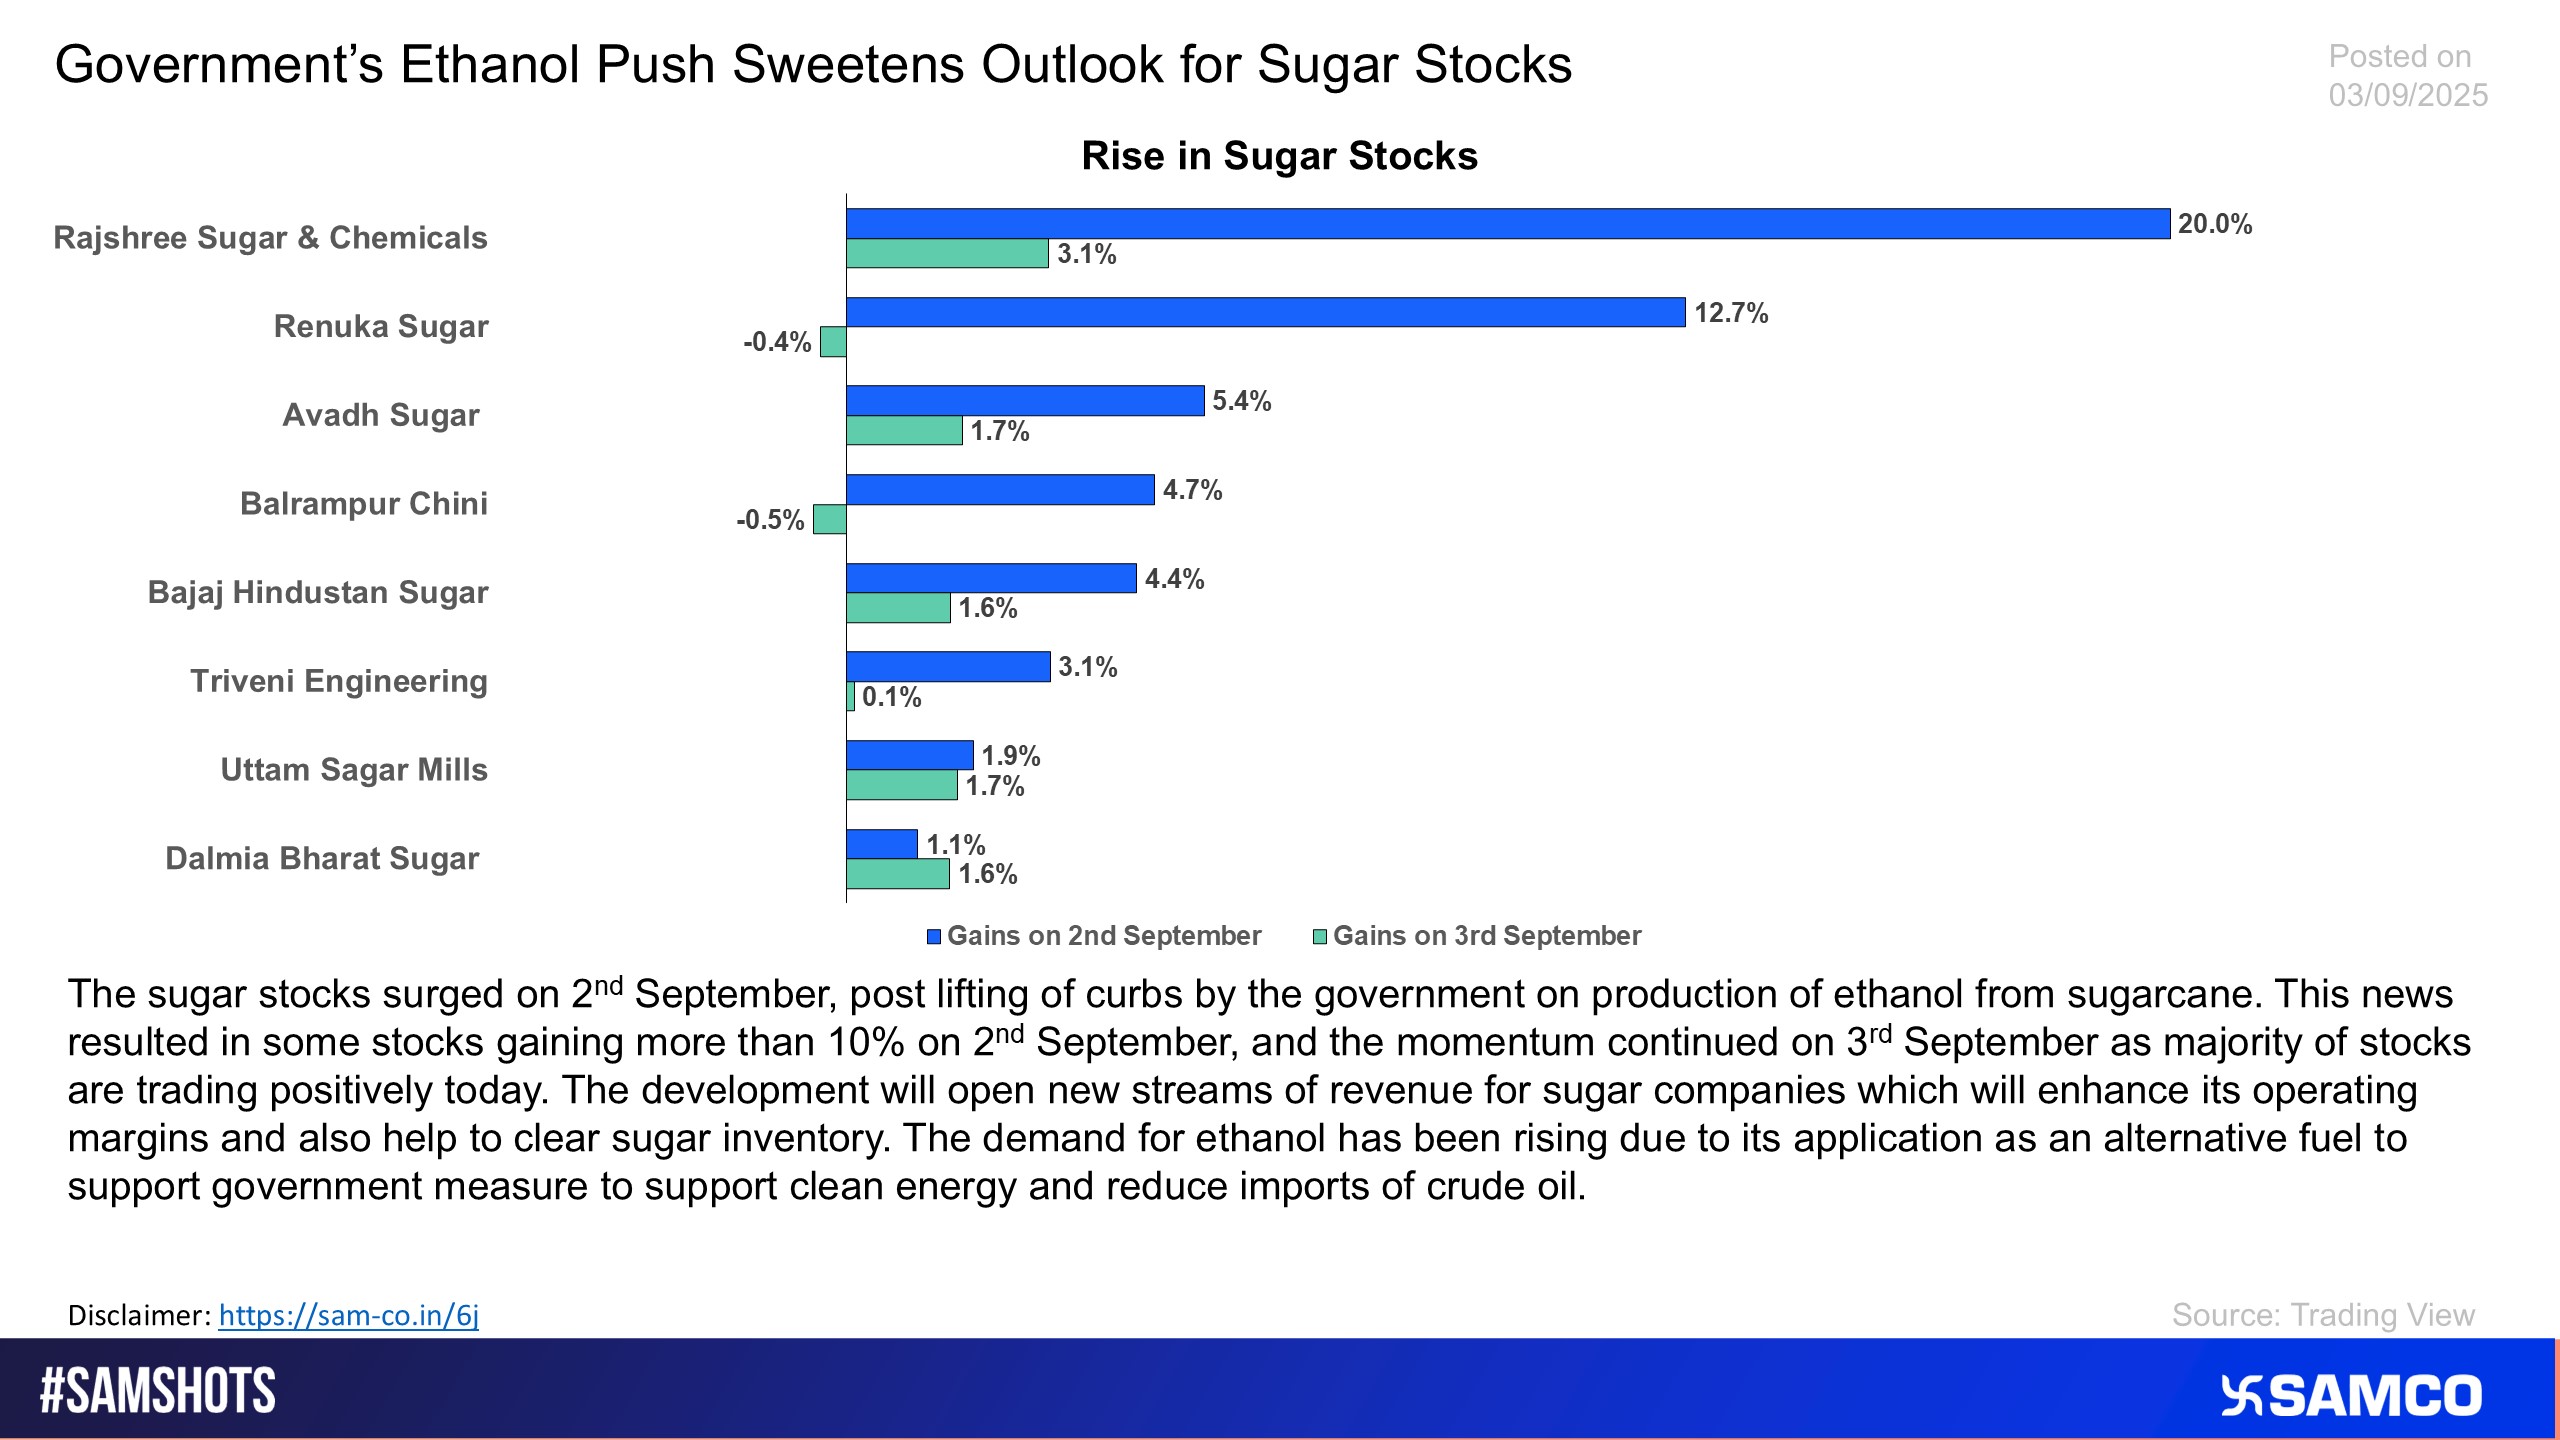
The chart explains the reason behind the surge in sugar stocks on 2nd September
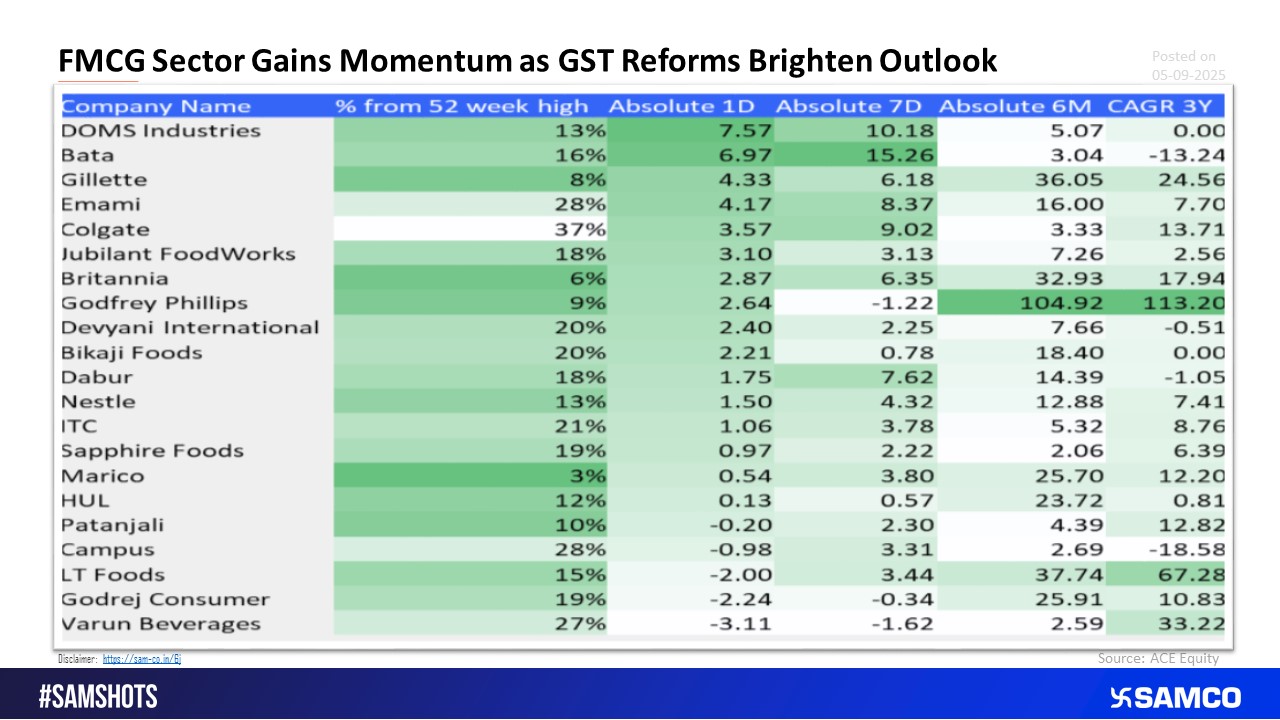
GST Reforms boost FMCG Stocks
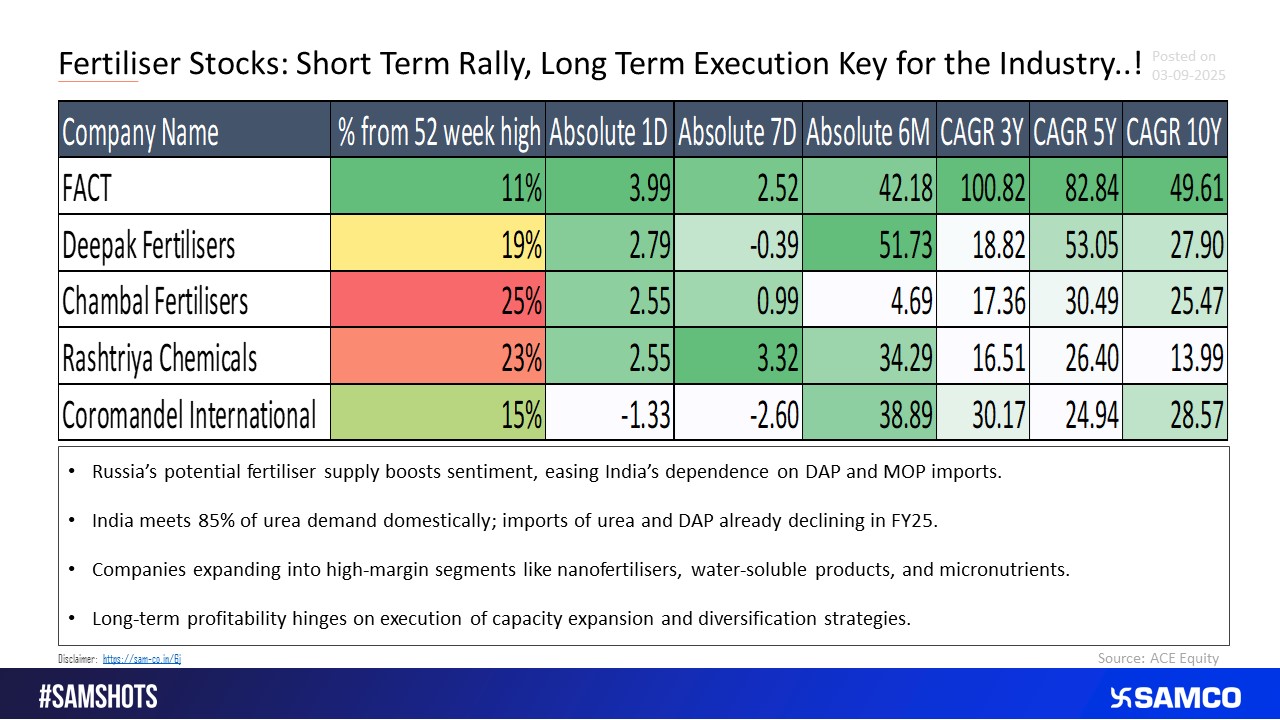
Fertiliser Stocks and their returns over the years
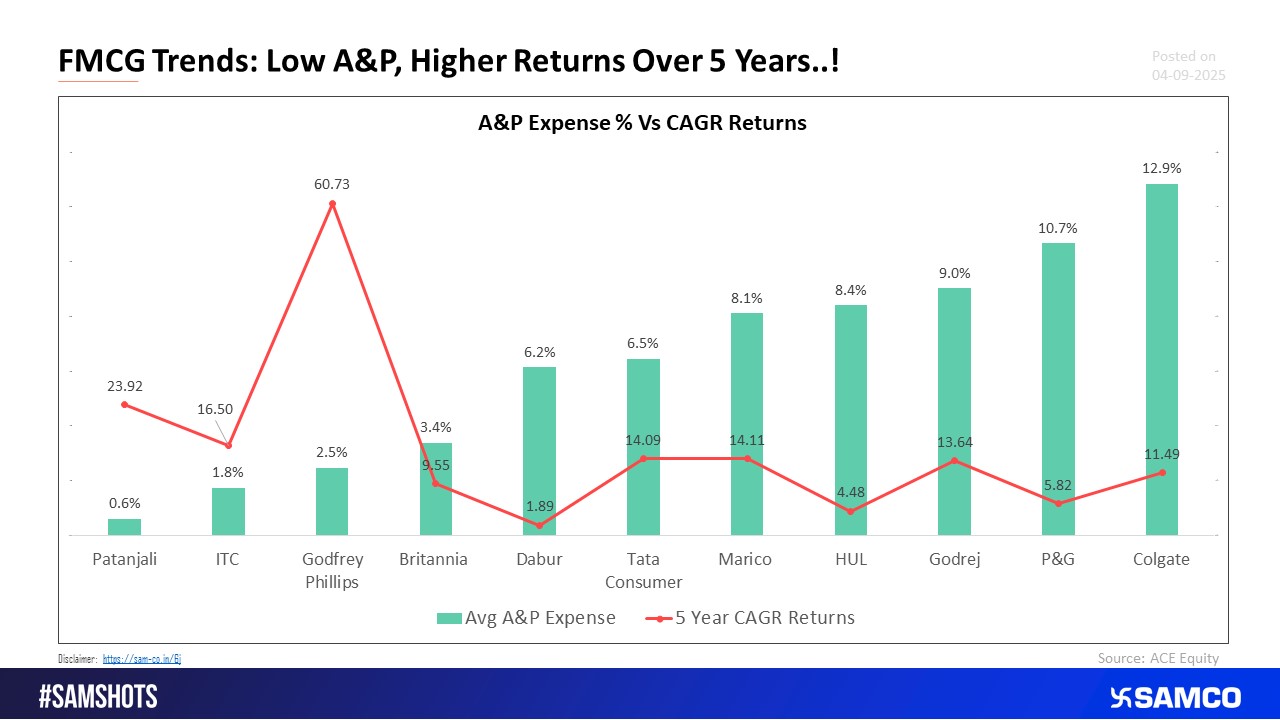
Advertisement and Promotion Expense % and Returns Trend in the FMCG Sector over the past 5 years
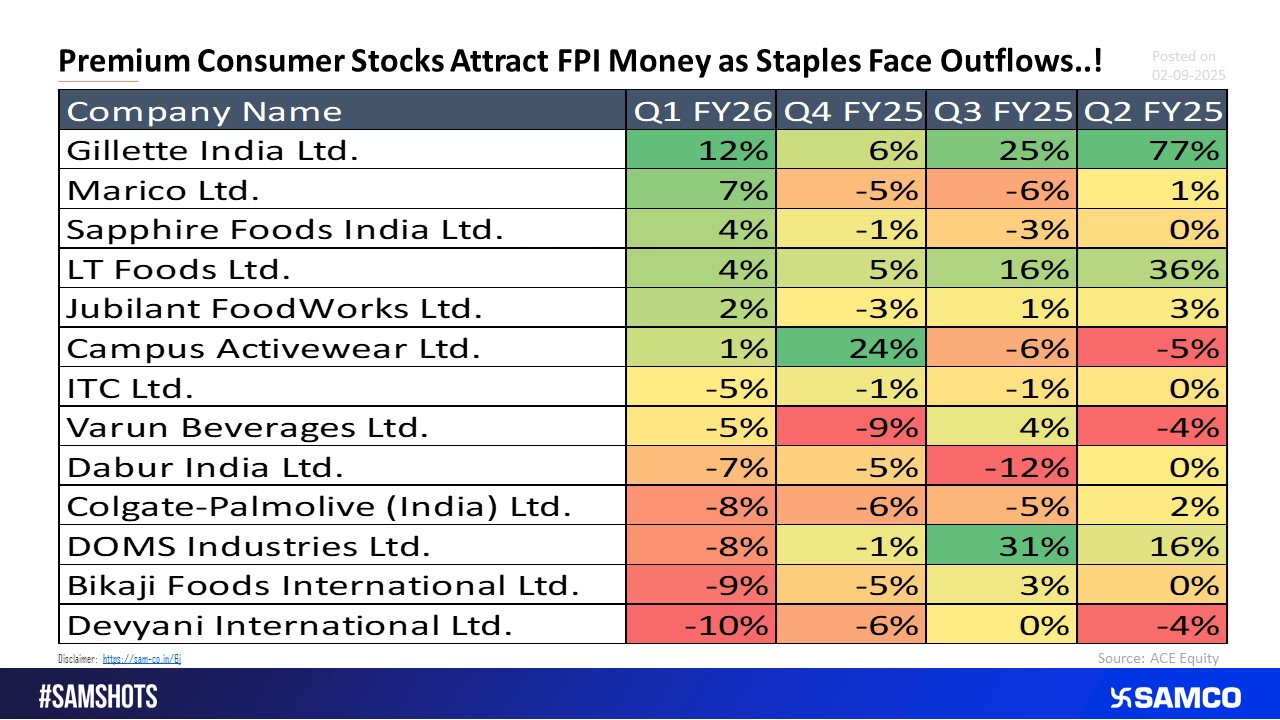
FPI Allocation in FMCG Stocks Quarterly Trend
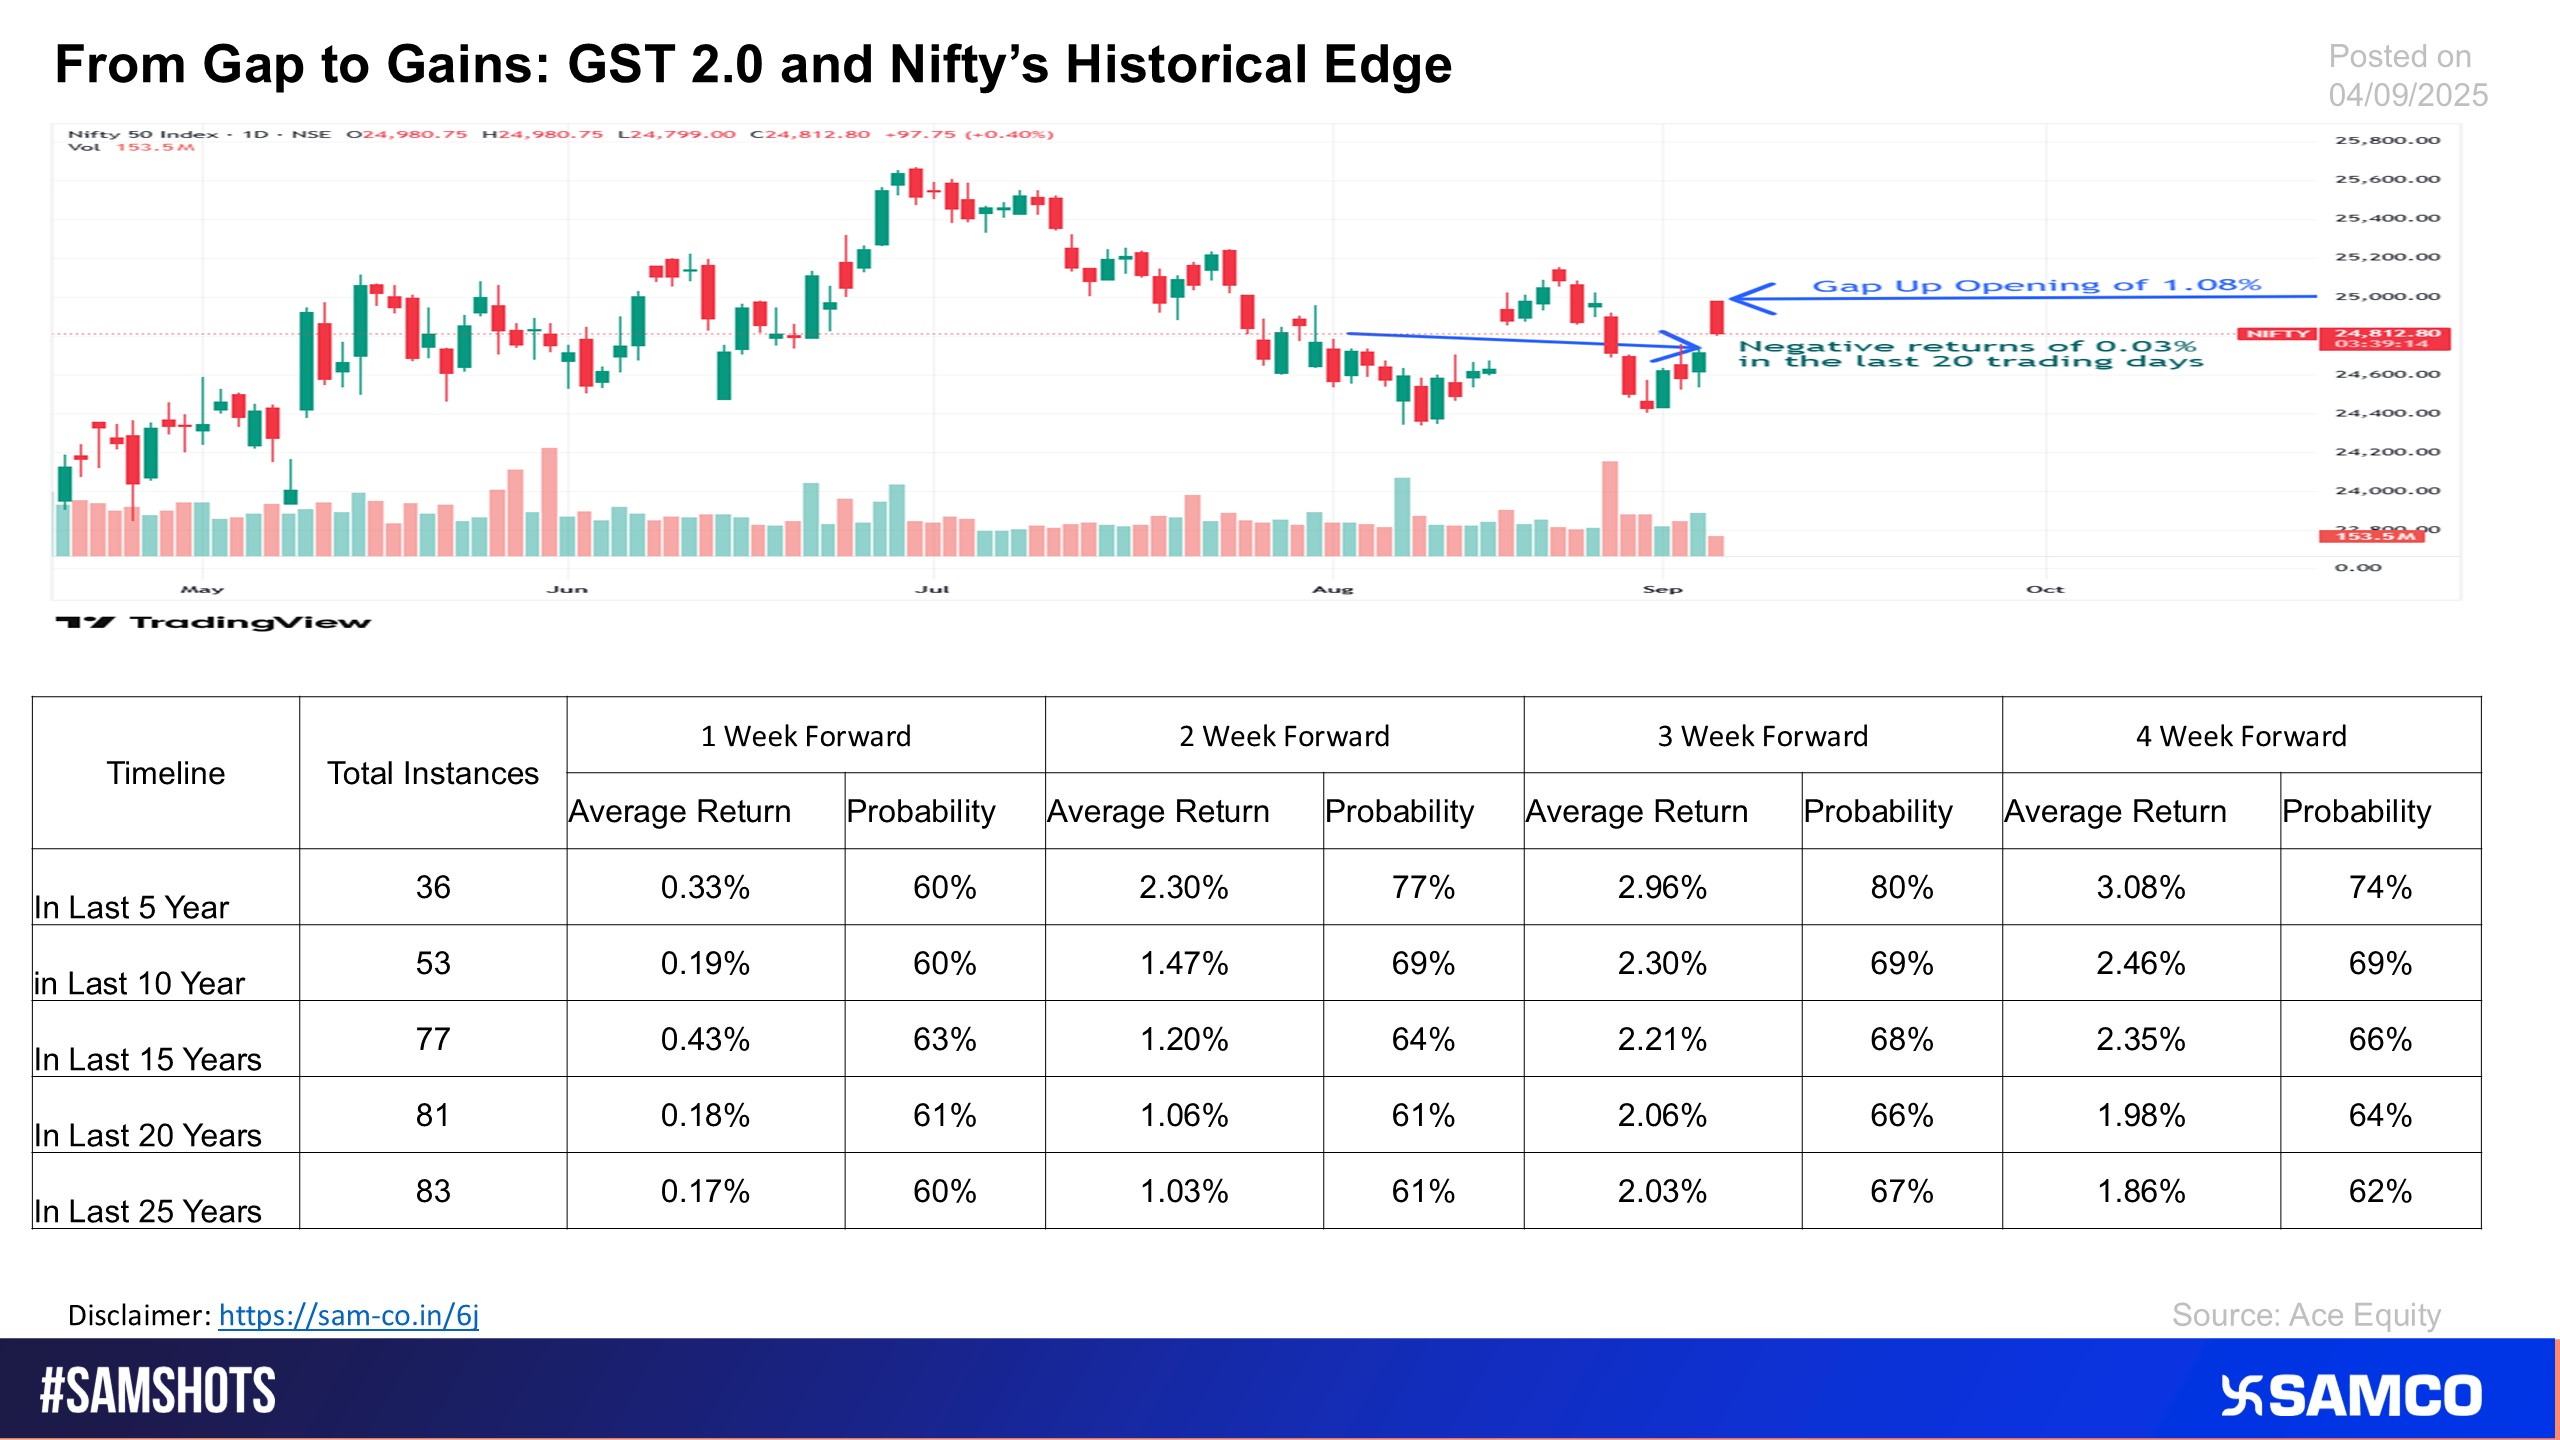
The chart estimates the forward returns of Nifty post GST 2.0 by evaluating past data
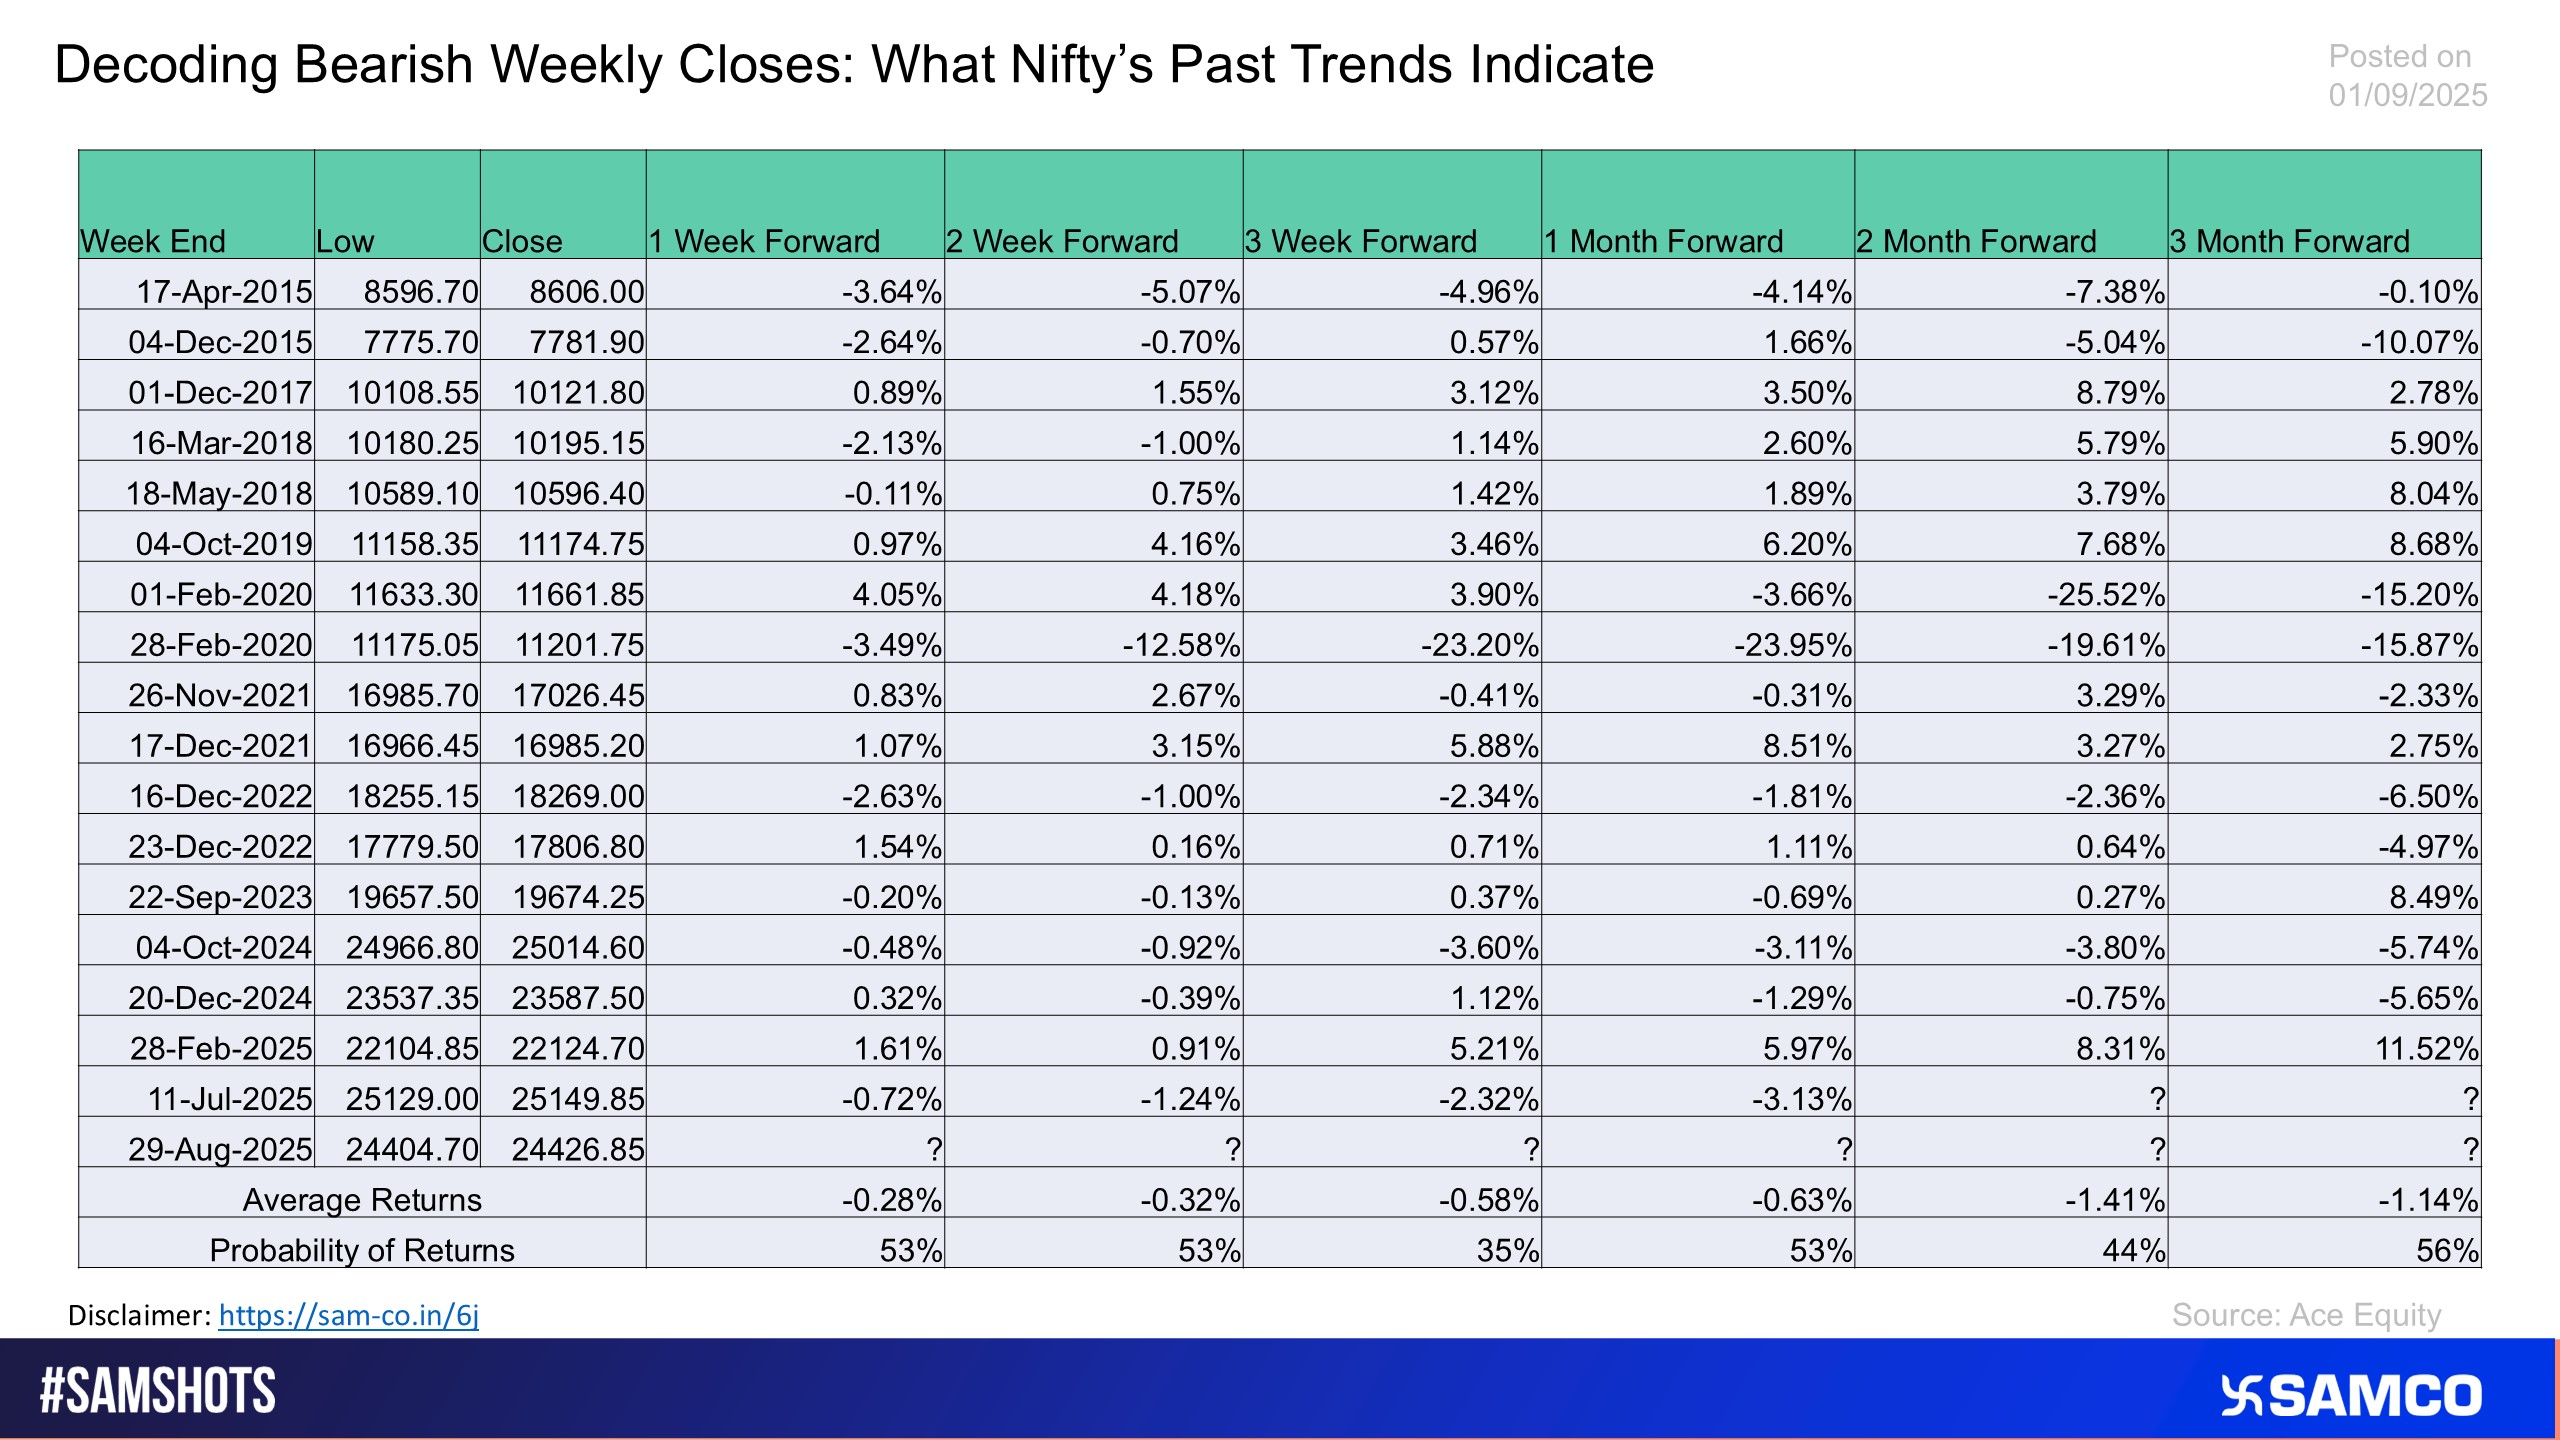
The chart evaluates the historical Nifty 50 behaviour post a weak weekly close
Metals, Autos, and Midcaps are leading the rally, while IT drags, signaling a clear shift toward cyclicals and growth pockets.
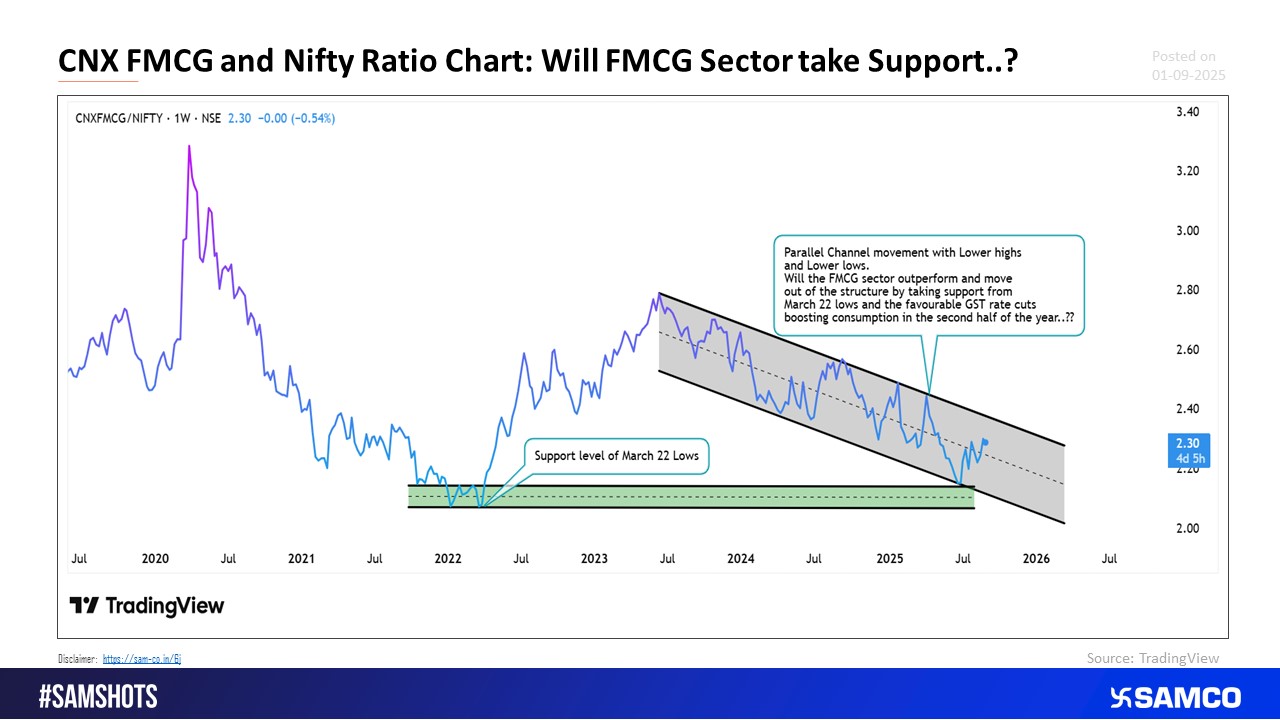
Ratio Chart of CNX FMCG and Nifty
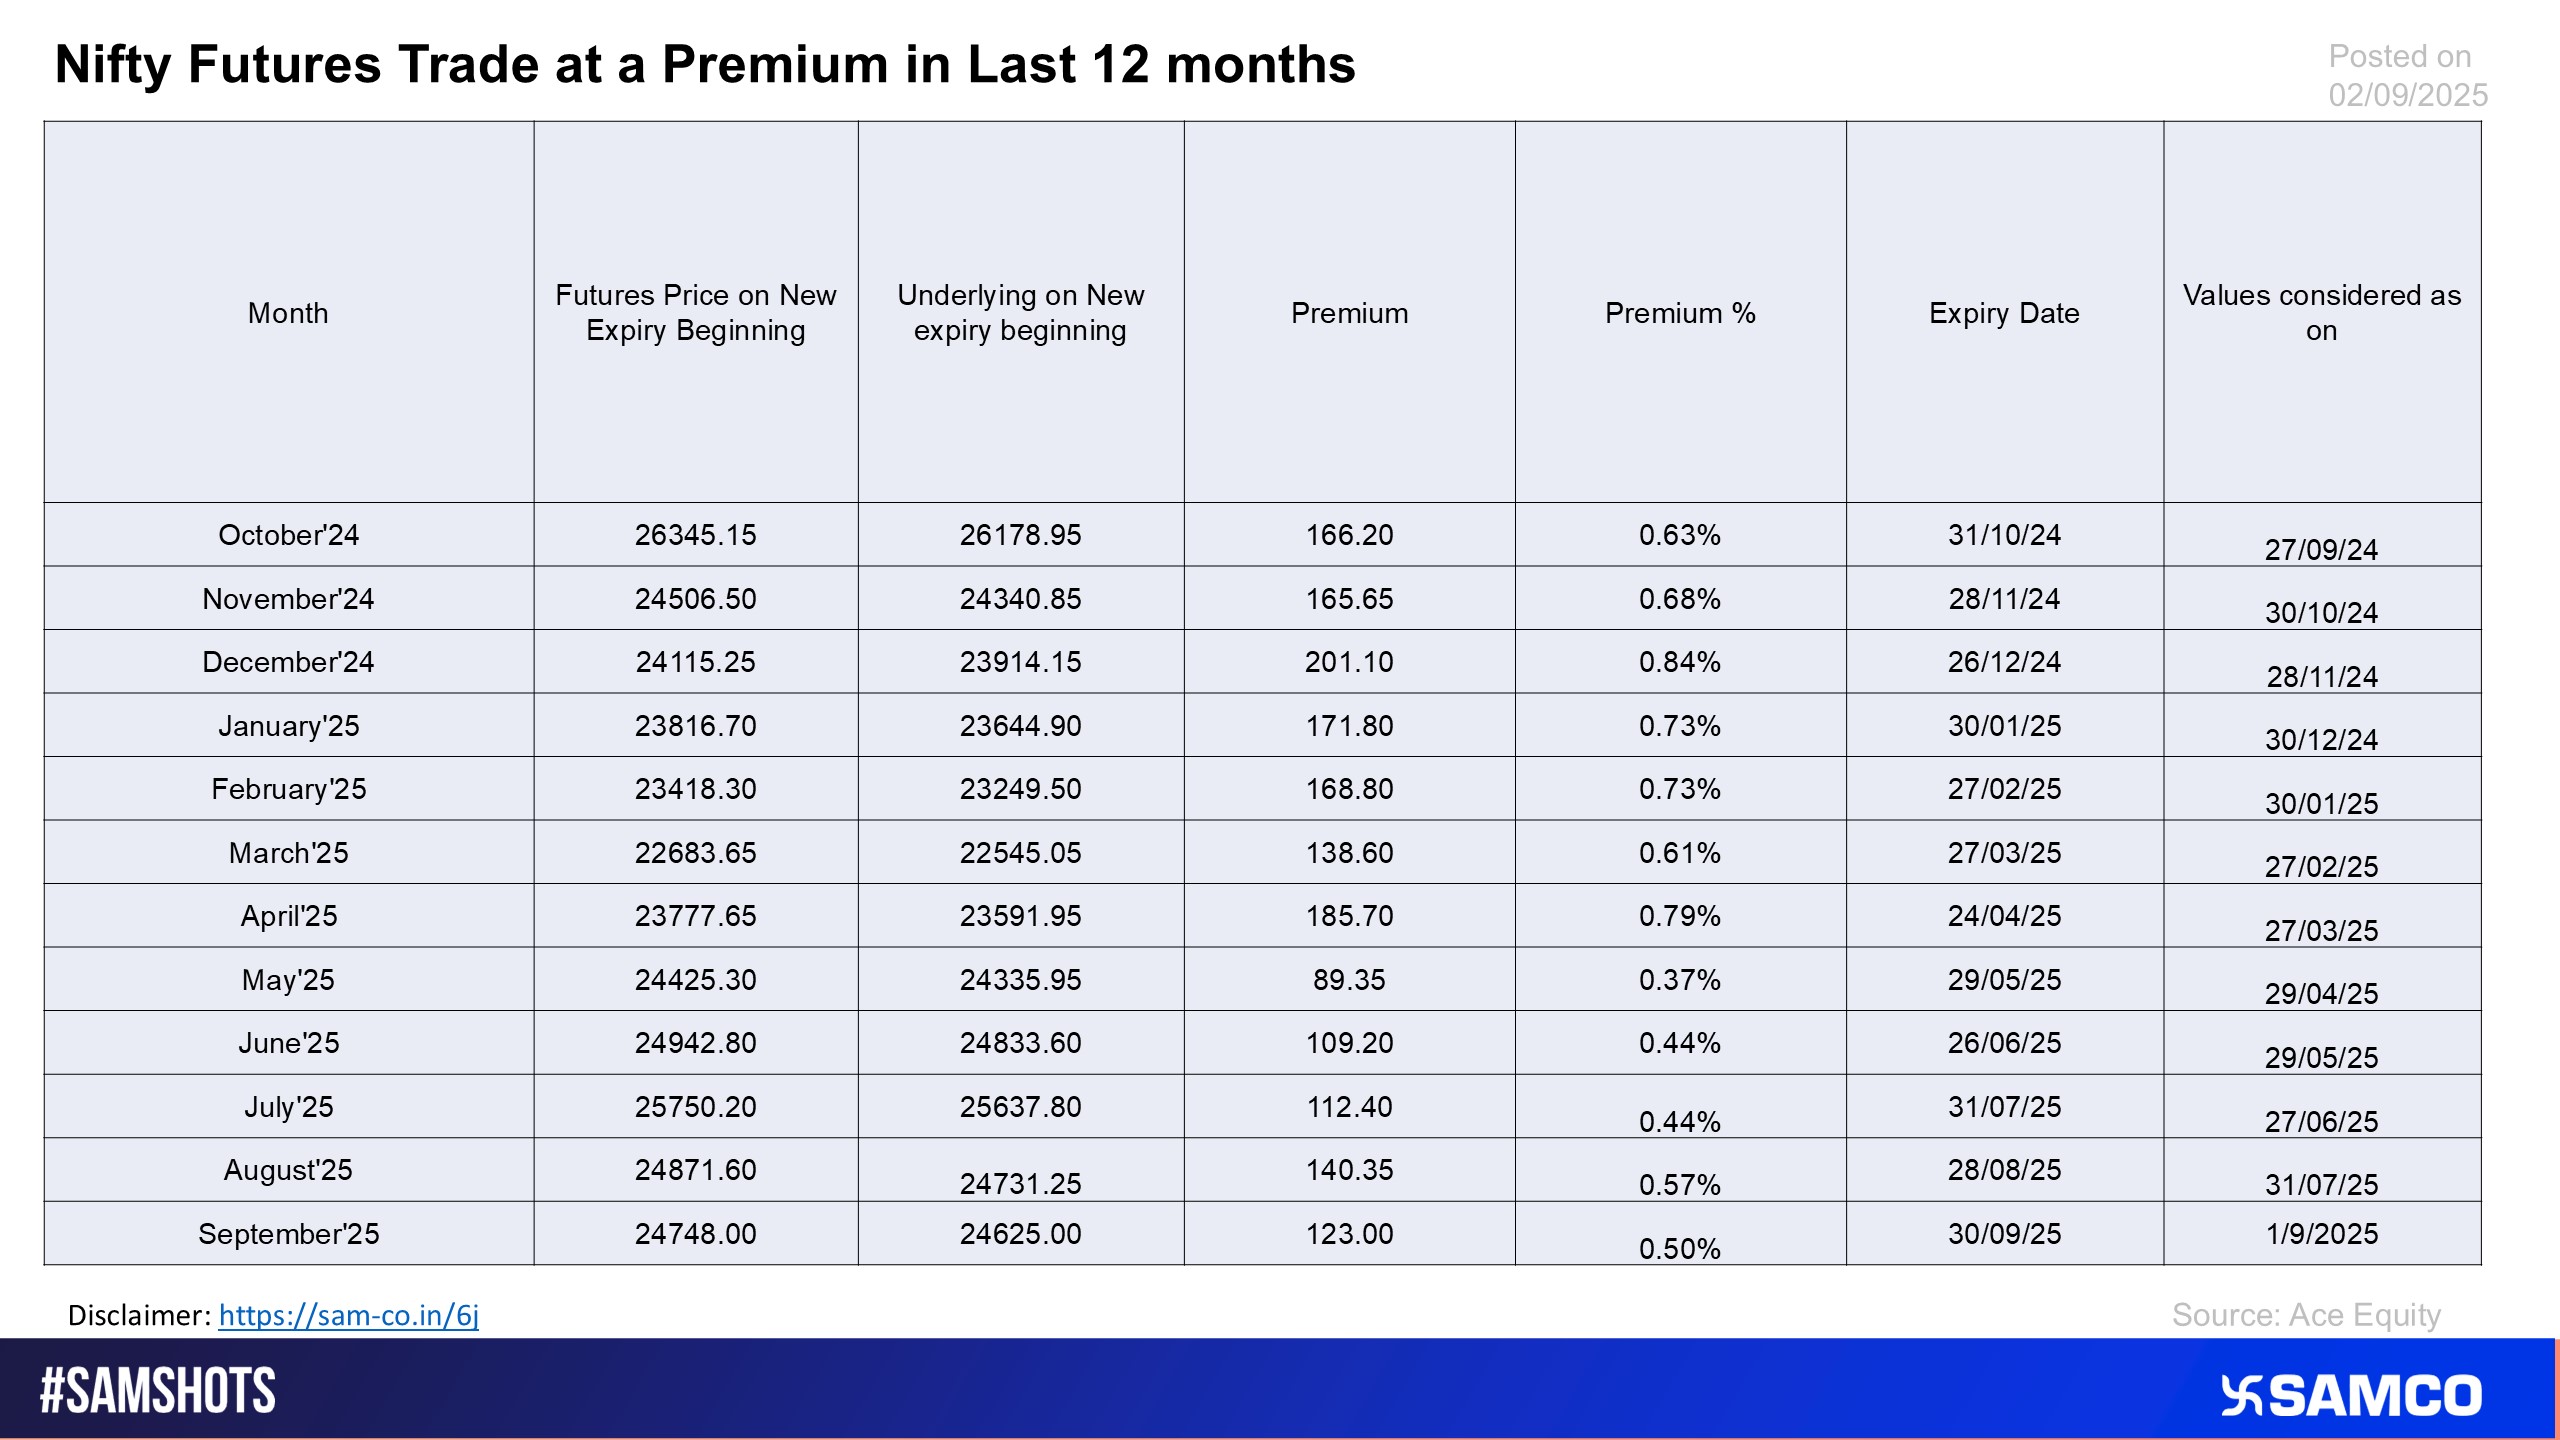
The chart evaluates the Nifty 50 future’s Premium over the last 12 months
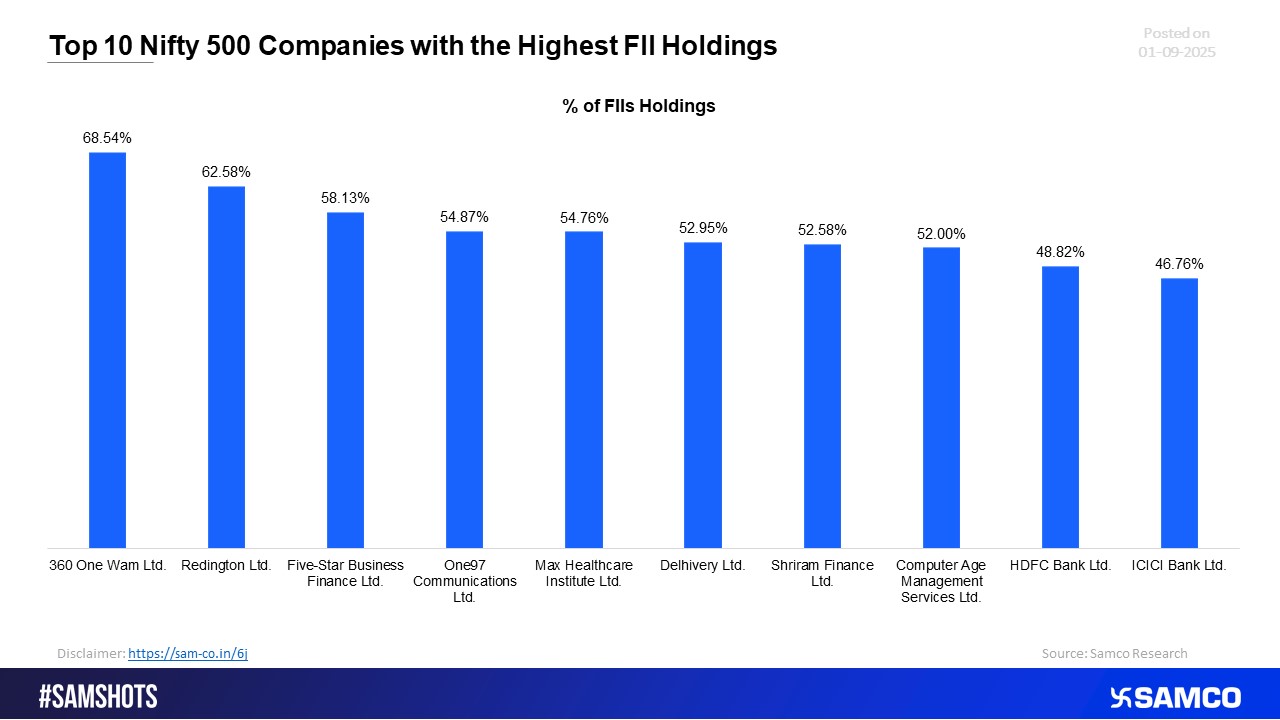
FIIs Top 10 Nifty 500 holdings
Money Chases Equities, But Gold & Silver Pay the Dividends
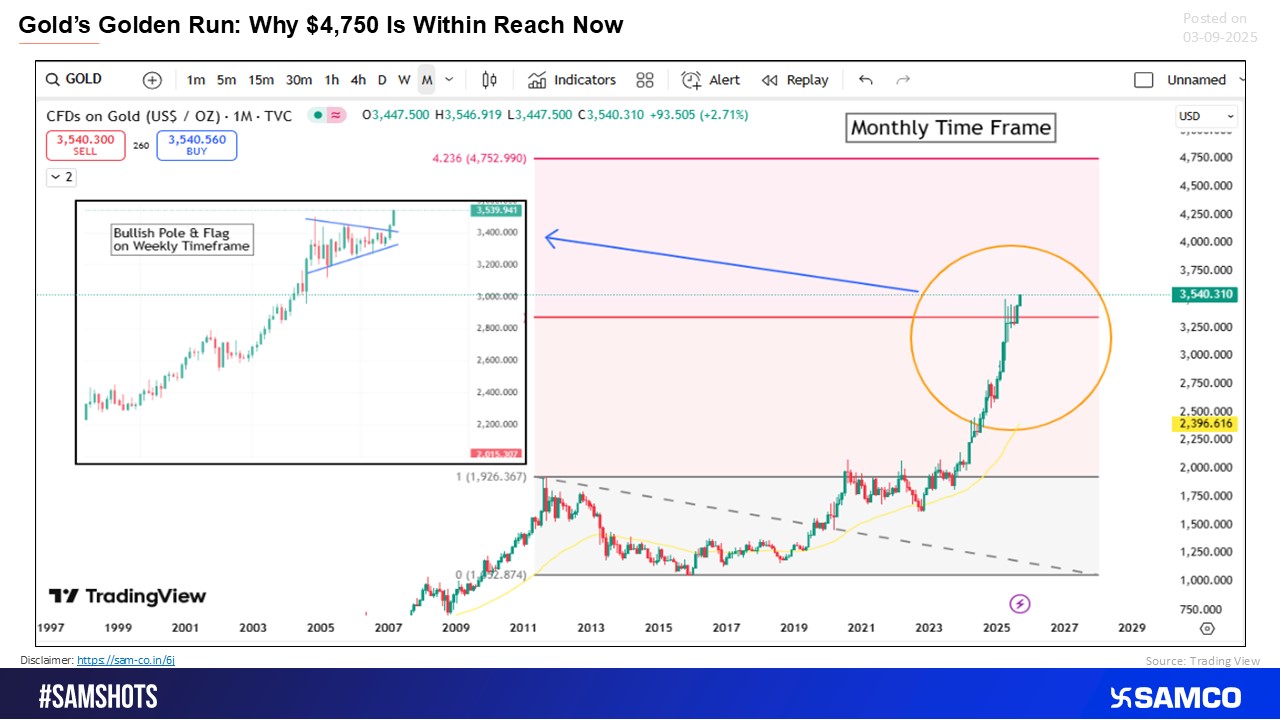
The Rally That Lasts: Why Gold Can Touch $4,750
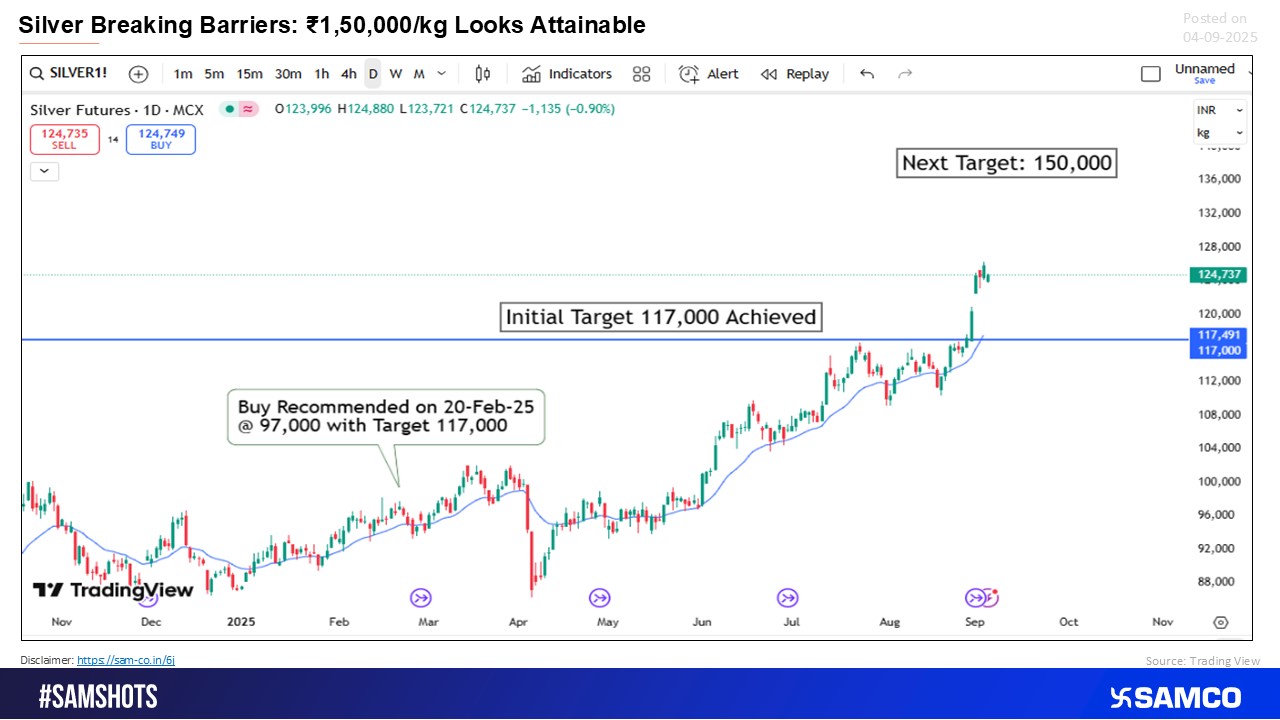
Silver’s Rally Gains Power — Next Stop ?1,50,000/kg
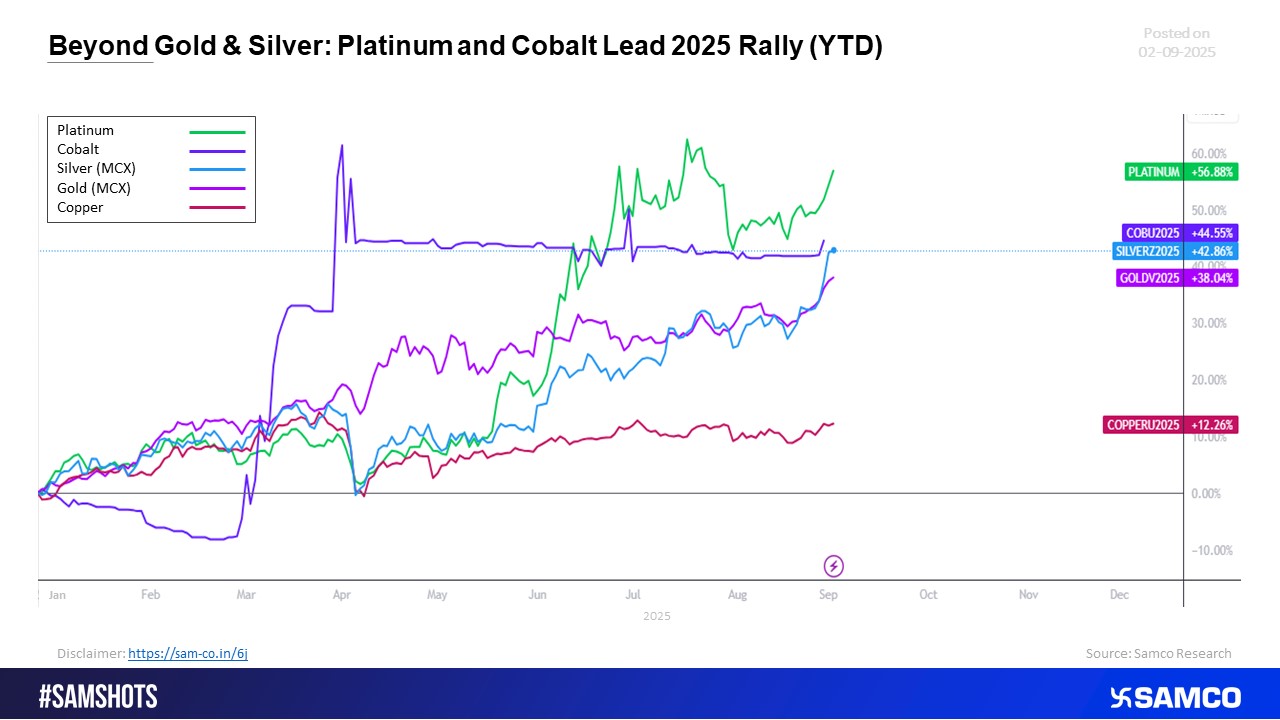
Platinum and Cobalt lead the race to returns in 2025 Rally (YTD)
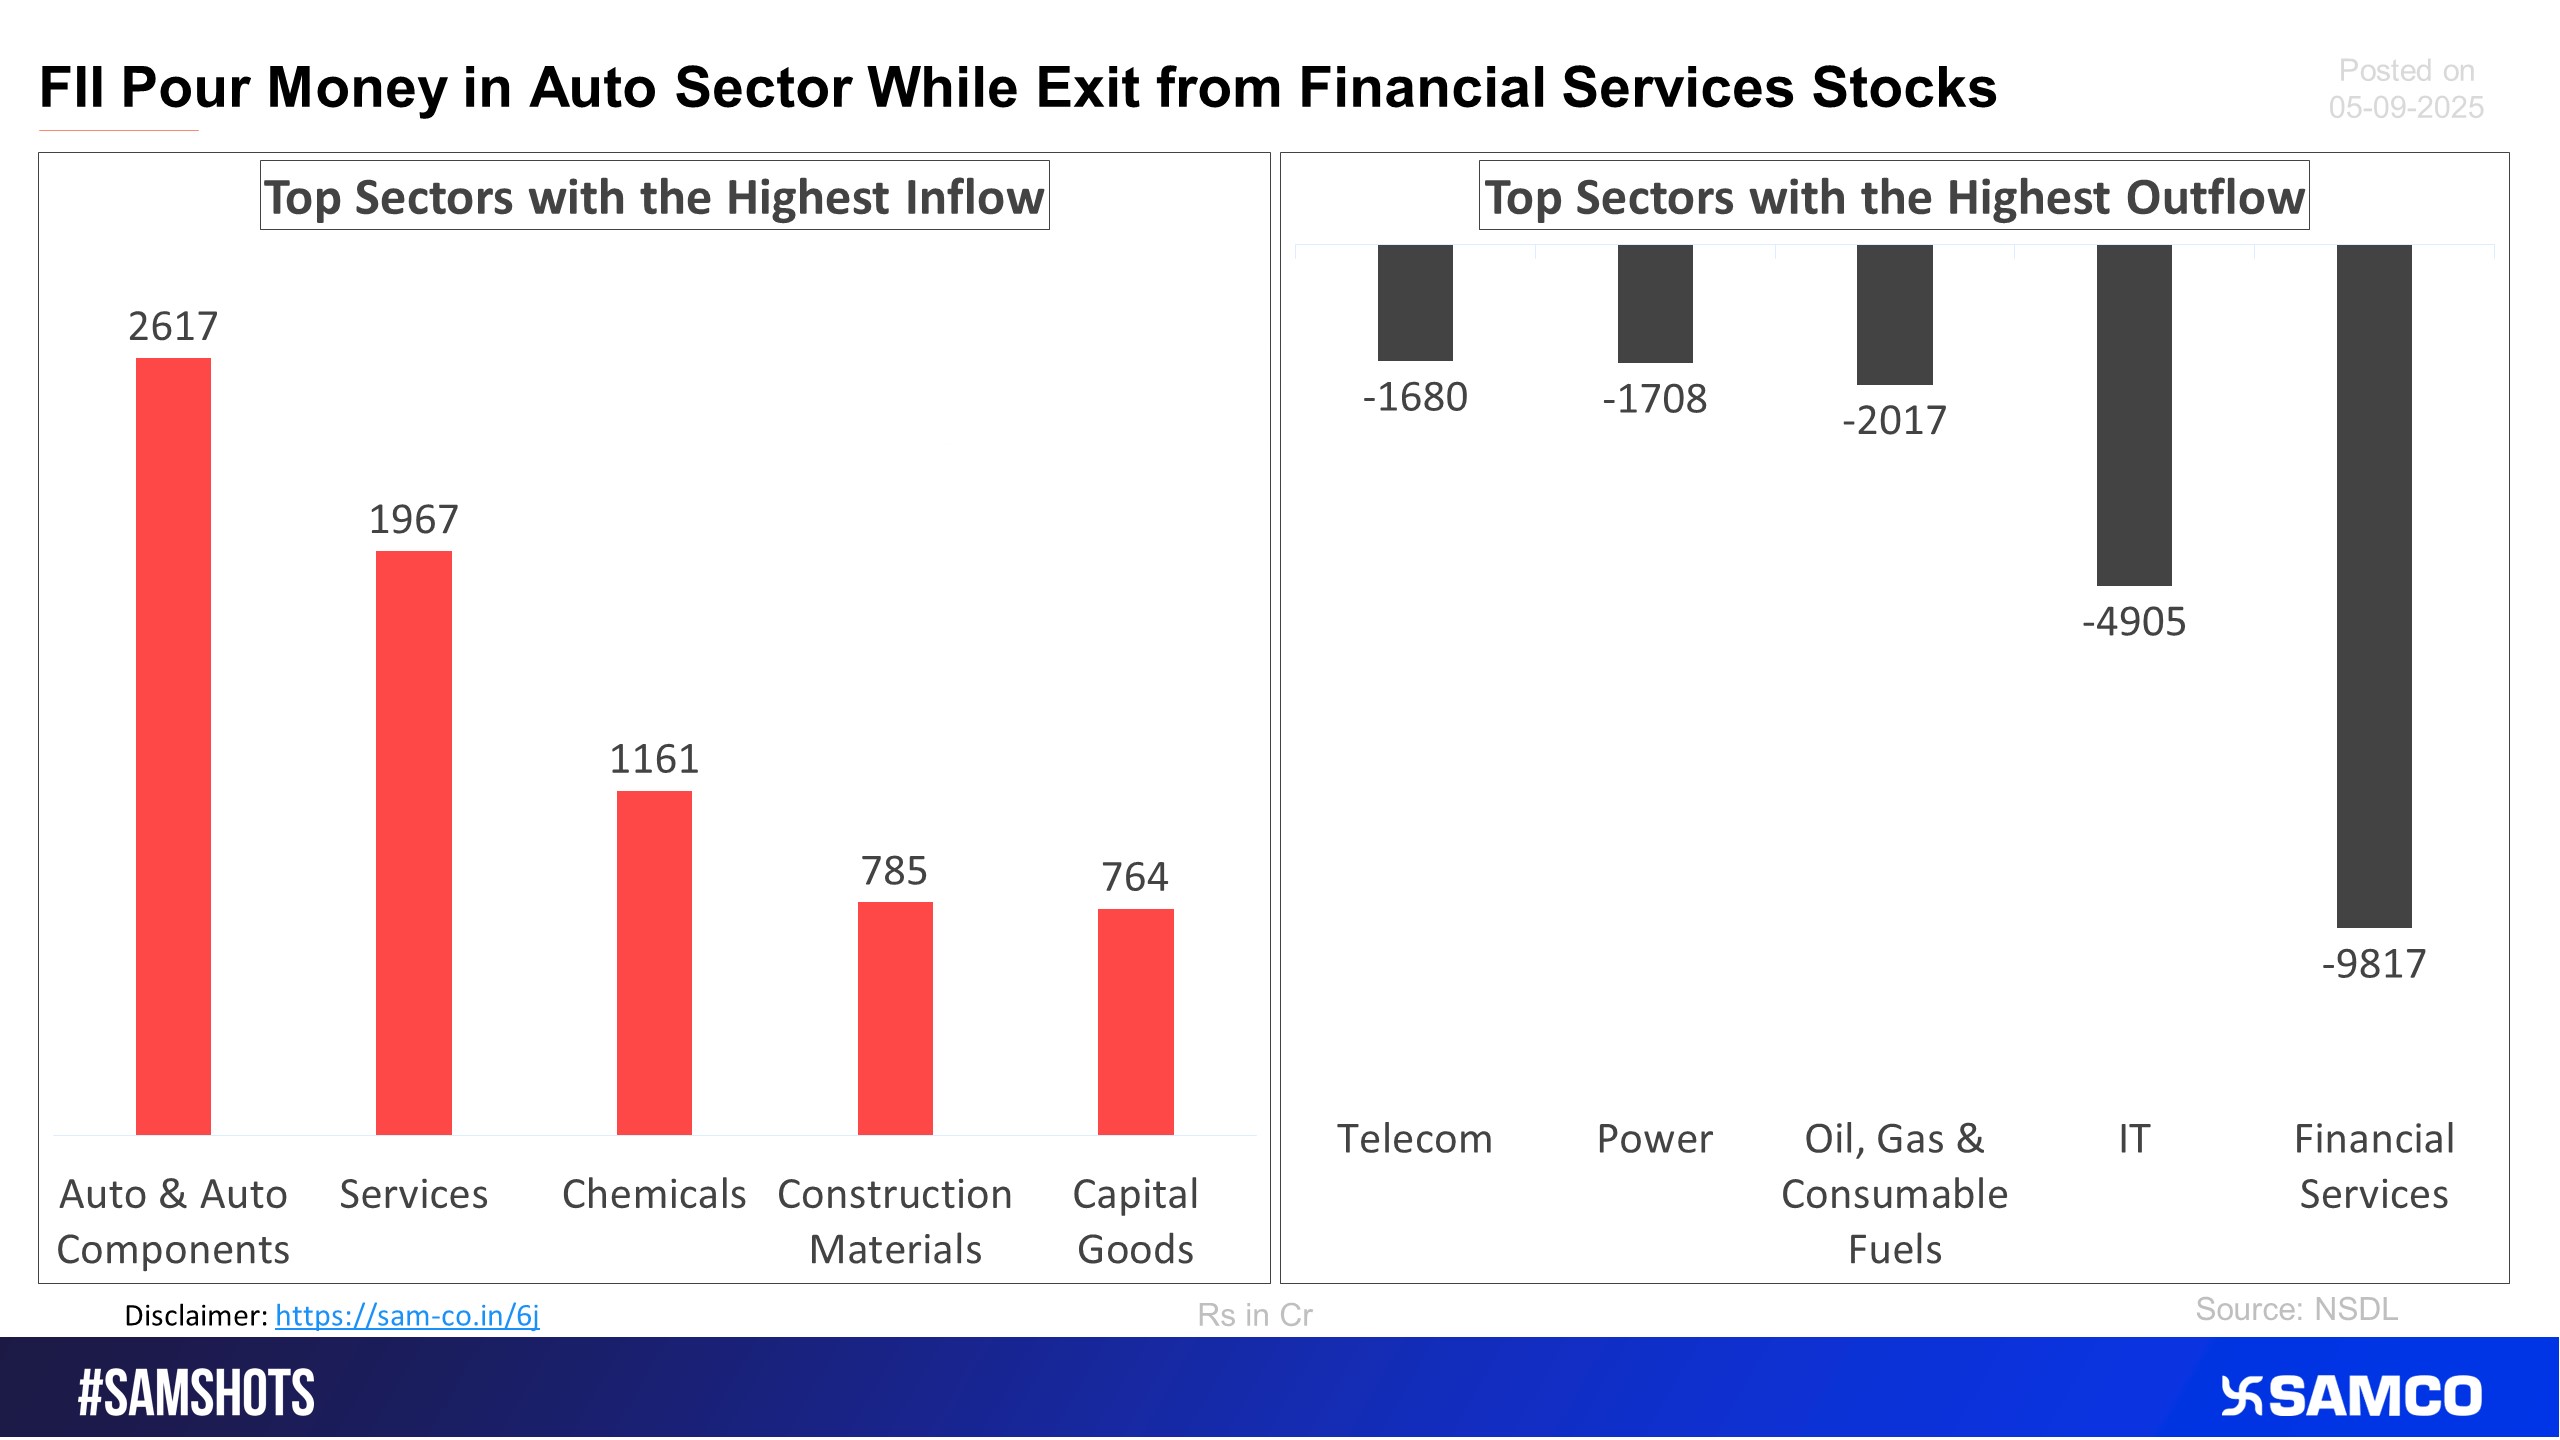
The accompanying chart shows the top 5 sectors that witnessed FPI’s highest inflow and outflow in the latest quarter.
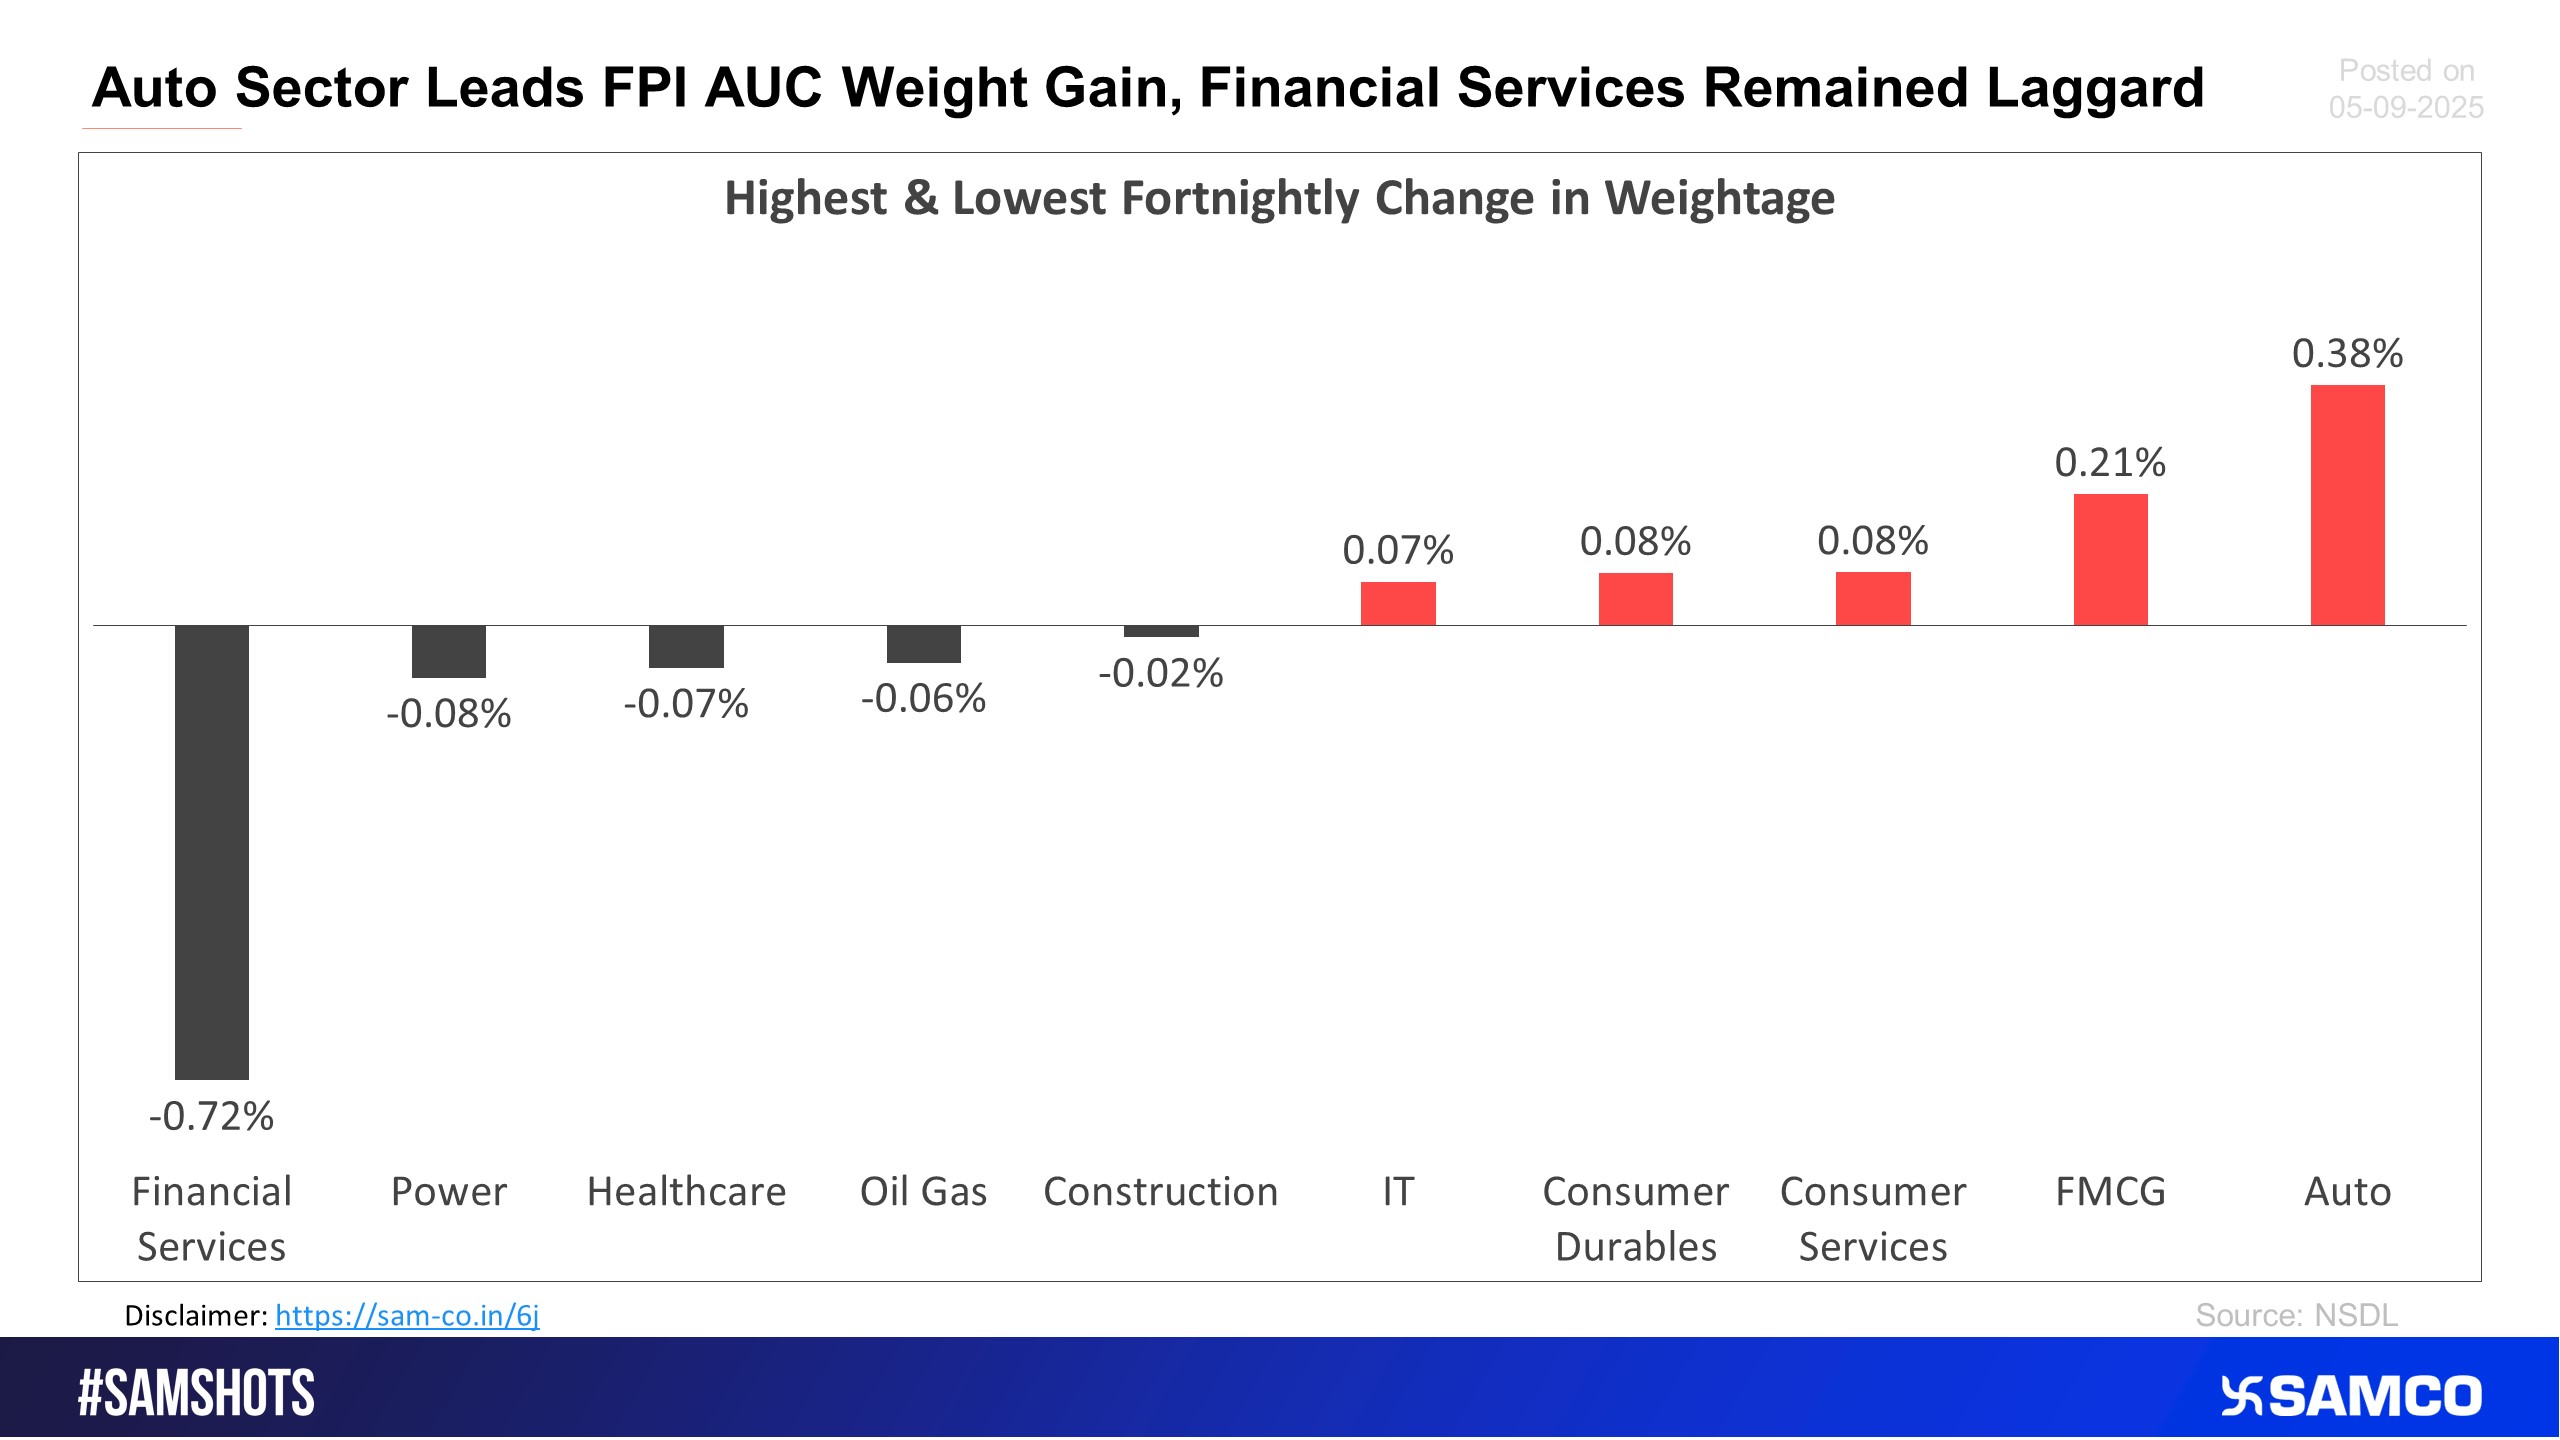
The chart below displays sectors that witnessed the highest and lowest change in the weightage of sectoral FPI holdings to the total FPI holdings compared to the previous fortnight.
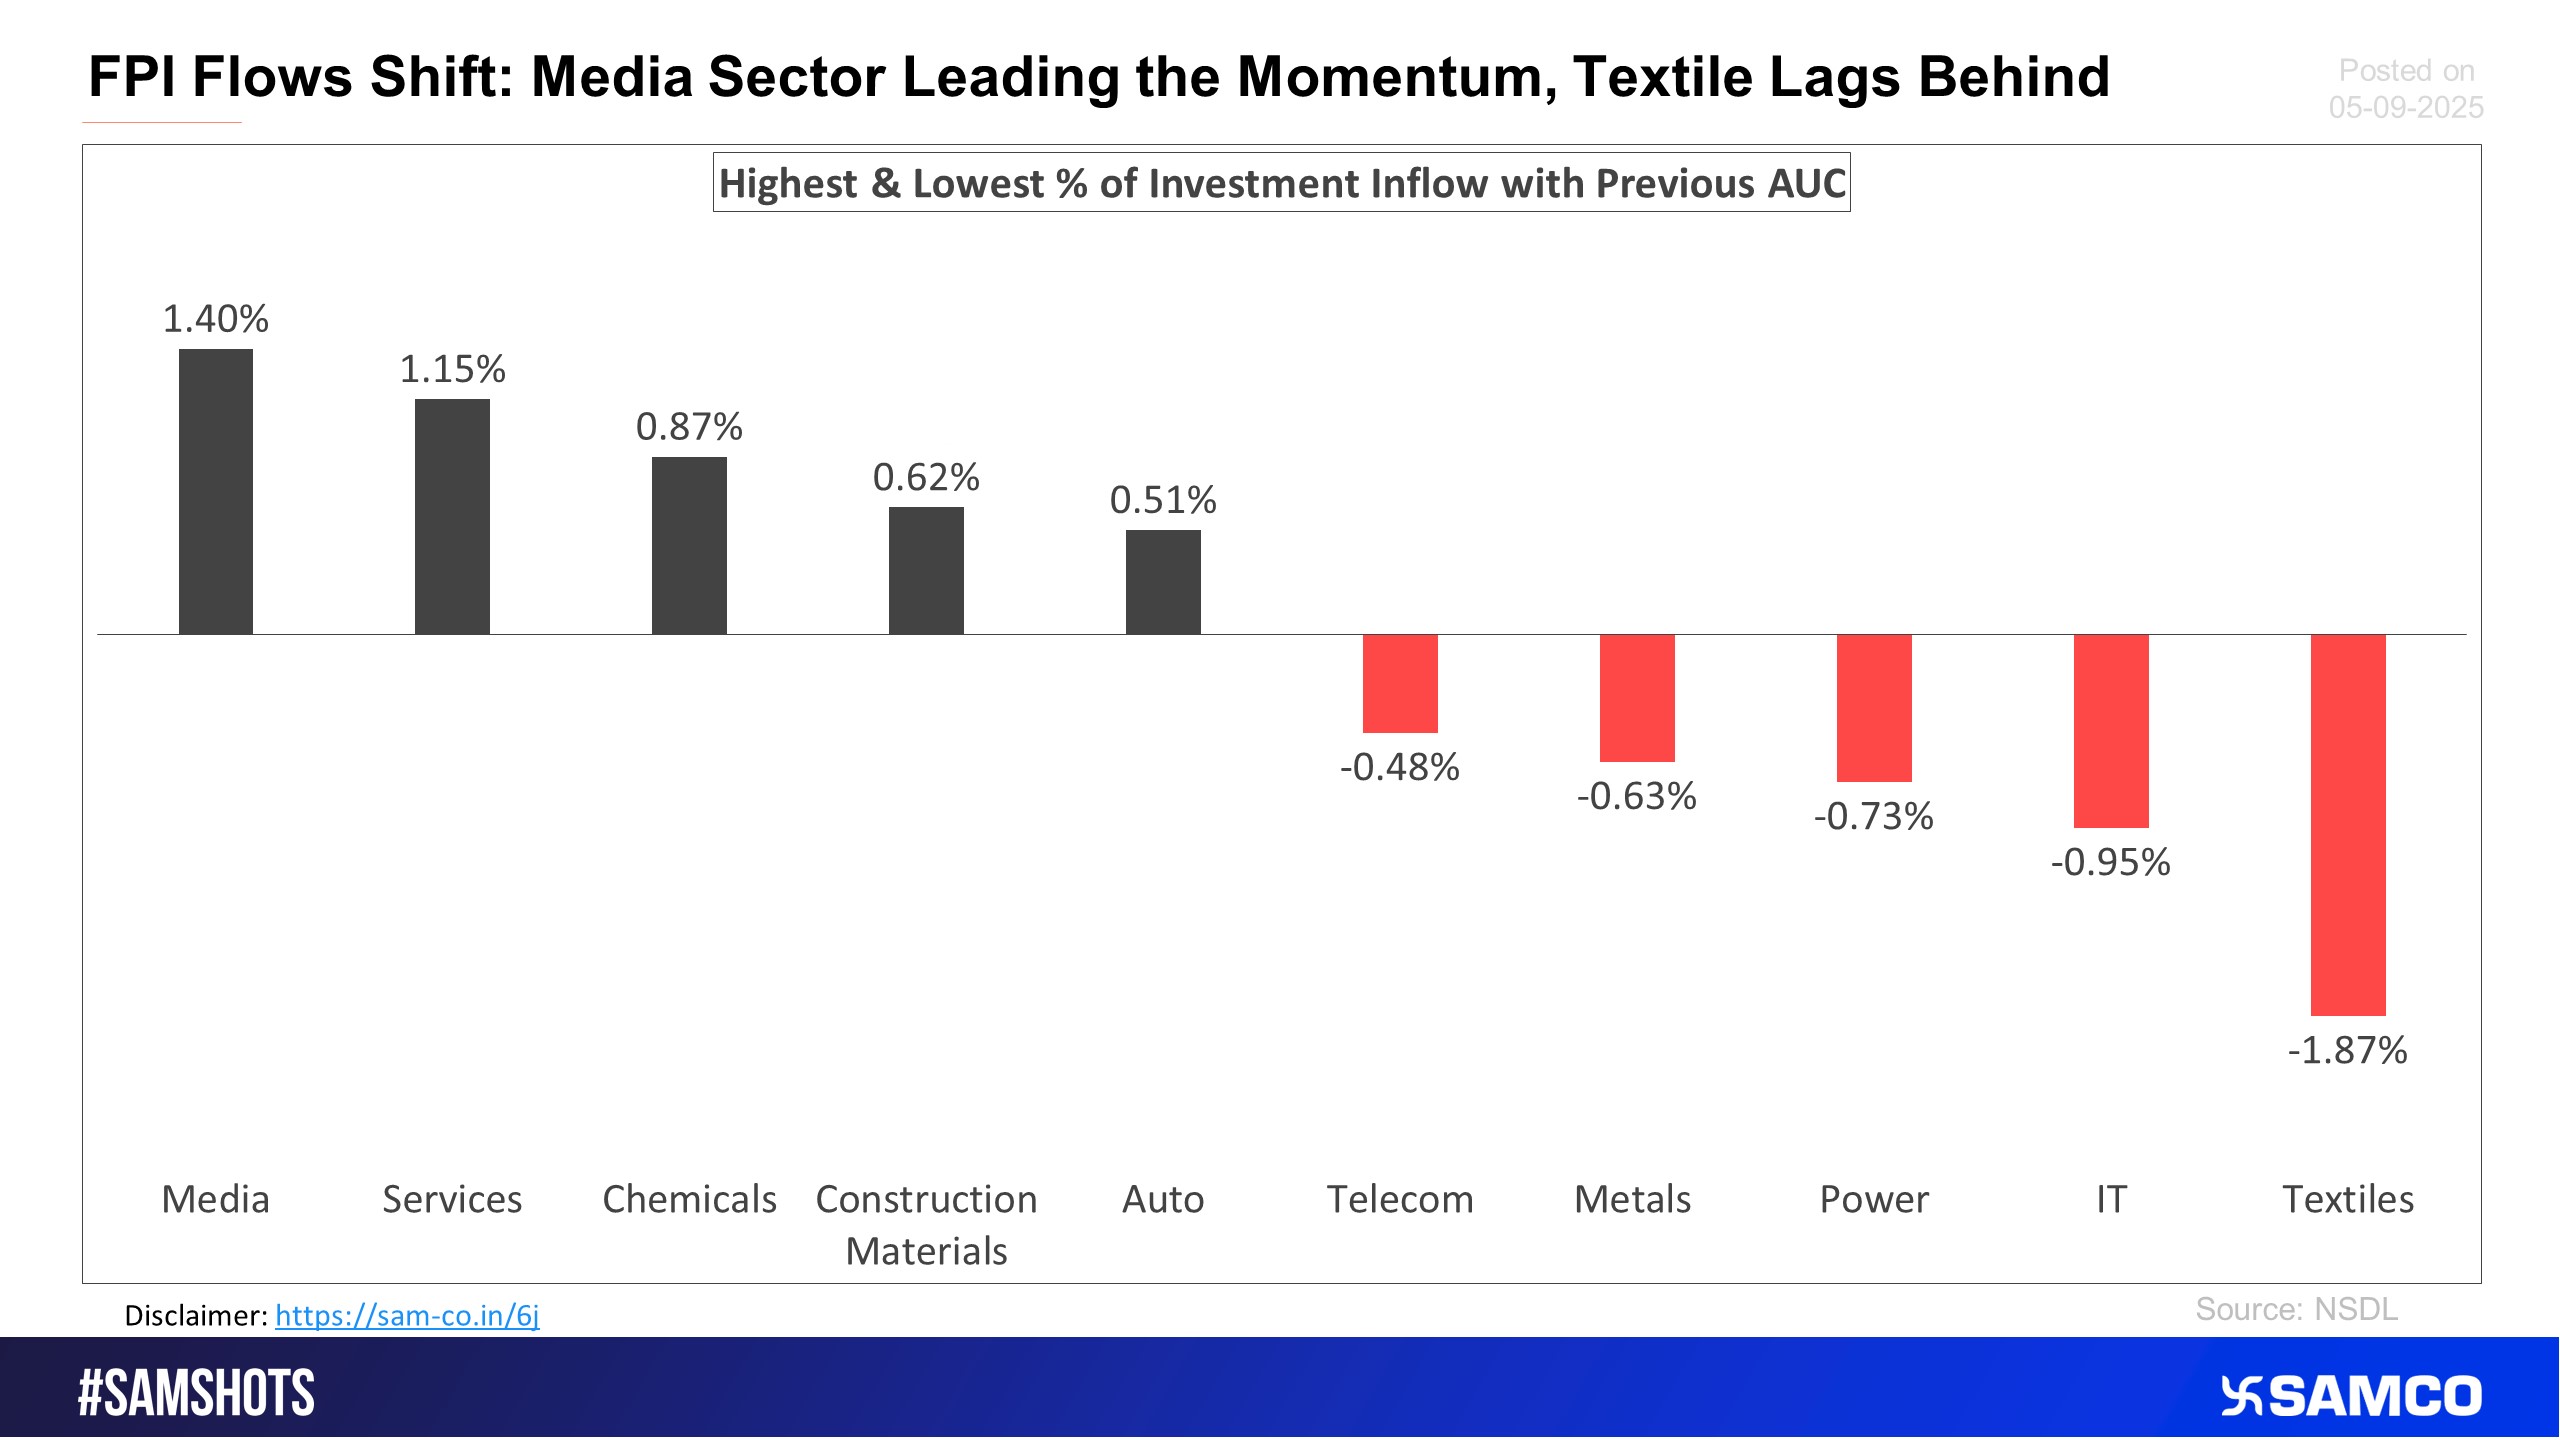
The below chart presents the highest & lowest percentage inflow of investment in the latest fortnight compared to the previous period AUC (Asset Under Custody) of FPI.
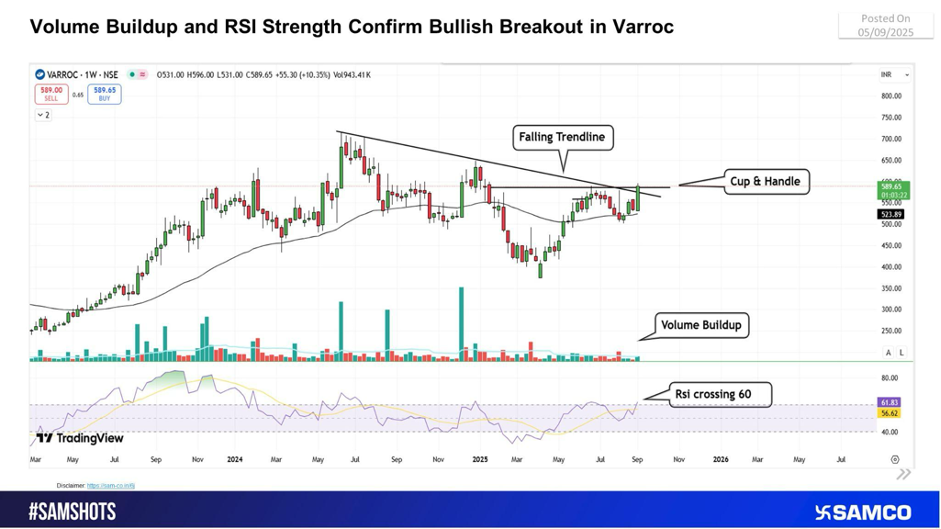
Varroc charts Cup & Handle breakout; momentum signals strong rally ahead
 Easy & quick
1. Register on SCORES portal
2. Mandatory details for filling complaints on SCORES
Name | PAN | Address | Mobile | Number | E-mail ID
3. Benefits
Effective Communication
Speedy redressal of the grievances
