This week, the Indian equity market exhibited a mild bearish undertone, with benchmark indices ending in the red. The Nifty 50 declined by 1.22%, while the broader Nifty Midcap index saw a correction of 1.74%, reflecting profit-booking in the broader market.
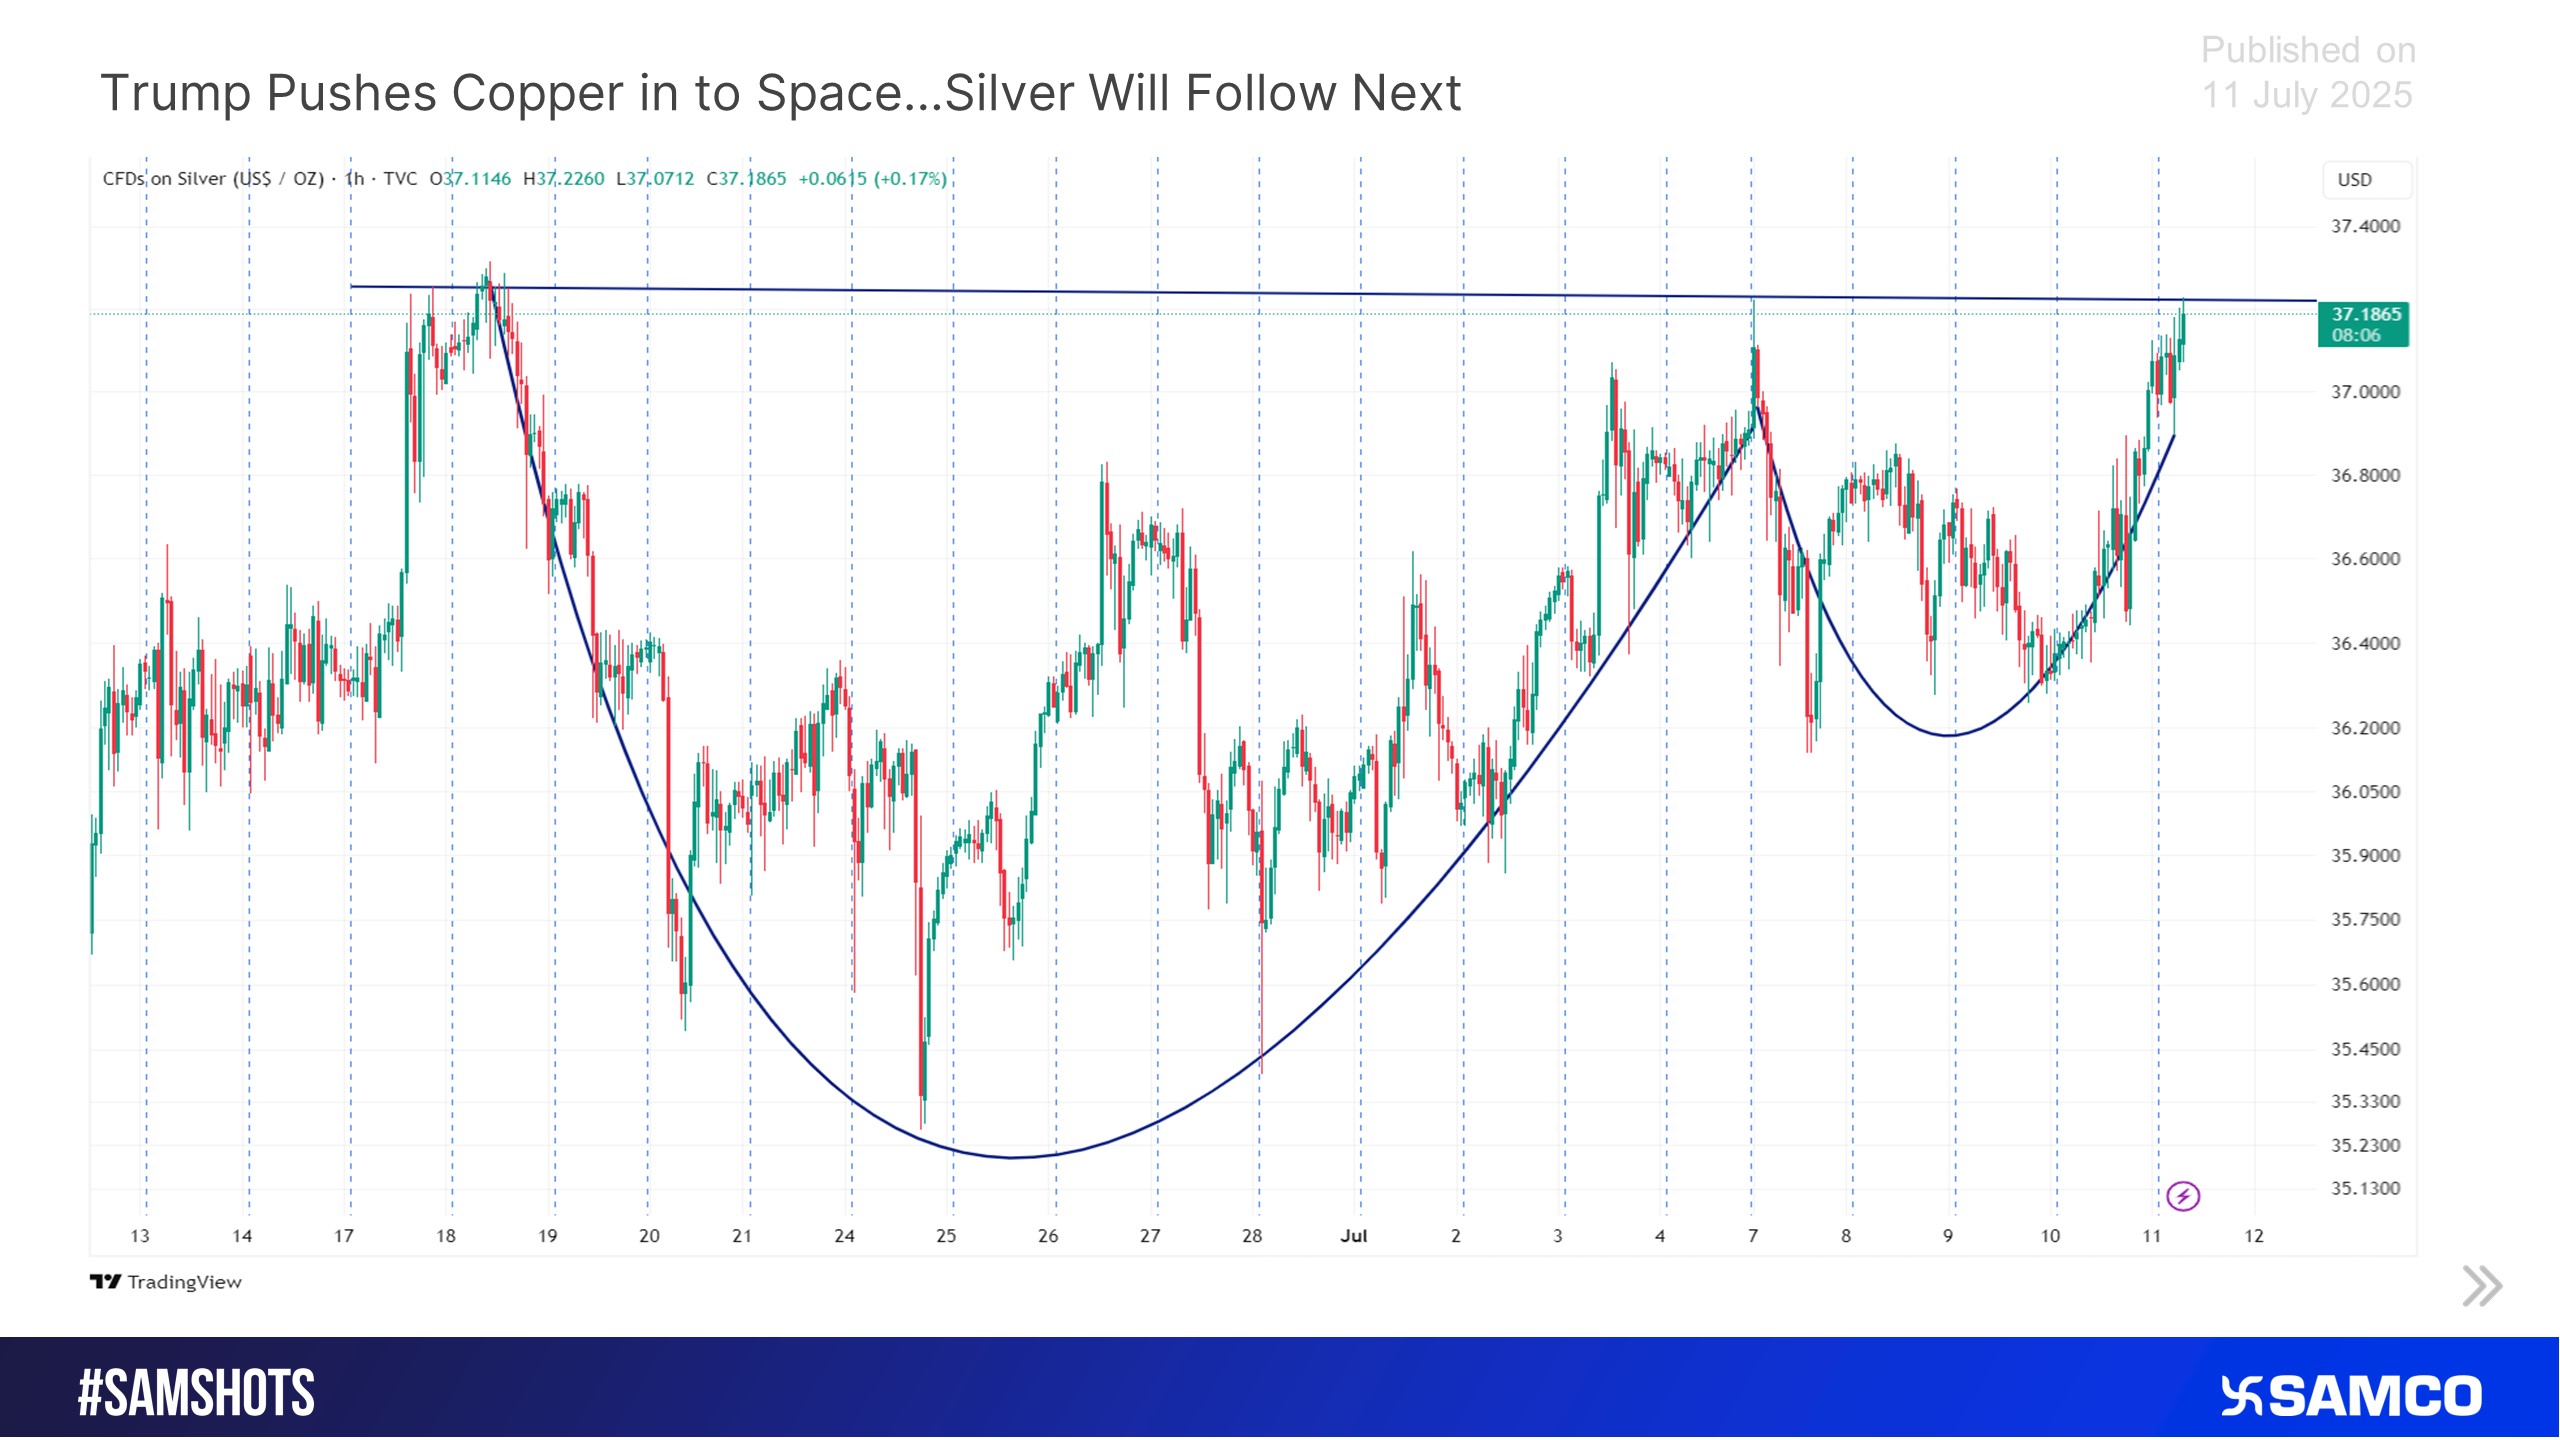
On a sectoral front performance remained divergent; Nifty FMCG emerged as the standout gainer, rising 2.15%. In contrast, Nifty IT bore the brunt of heavy selling pressure, plunging 3.76%. Commodities stole some spotlight, with silver prices surging 2.87%, driven by safe-haven demand.
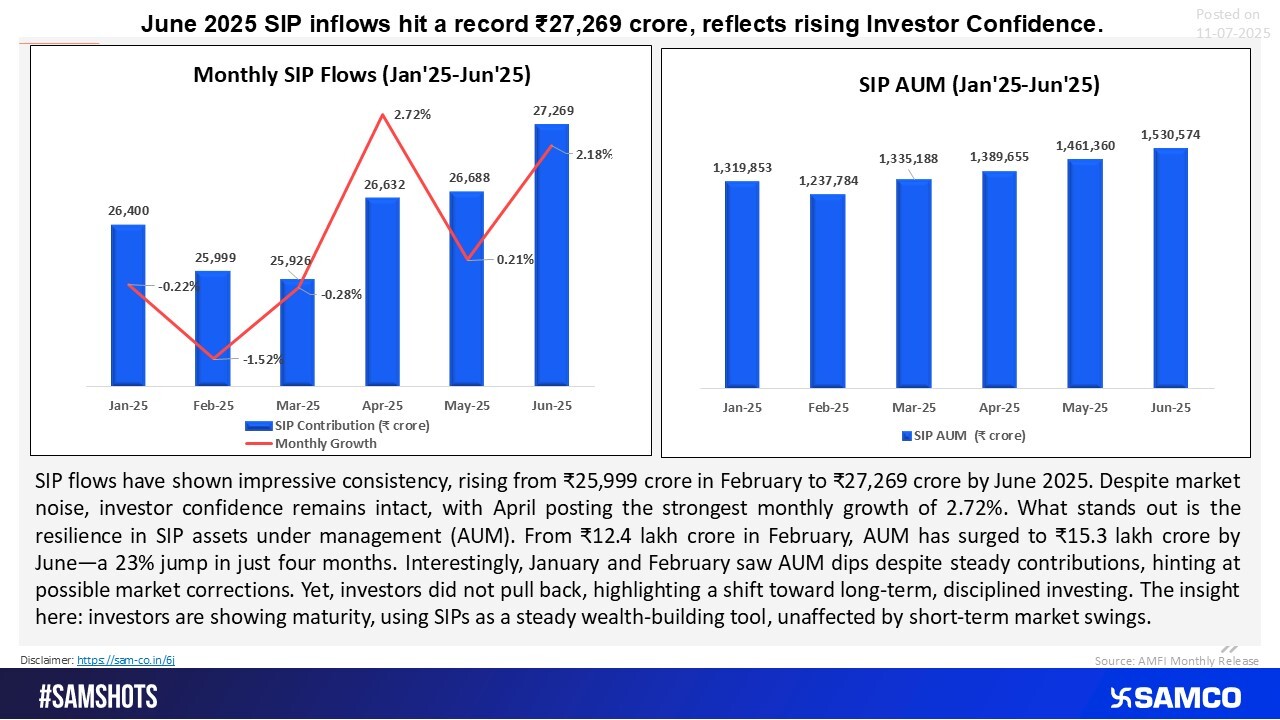
On the fund flow front, the June mutual fund data signaled robust retail participation. SIP inflows hit an all-time high, crossing ?27,000 crore for the first time, while SIP AUM surpassed ?15 lakh crore, reflecting rising investor confidence and long-term market optimism.
With the Q1FY26 earnings season underway, corporate results are expected to dictate near-term market direction. Going ahead, stock-specific action and management commentary will remain key triggers as investors assess the fundamental health of India Inc.
Scroll down to understand more of such market news and perspectives for the week gone by in easily understandable charts.
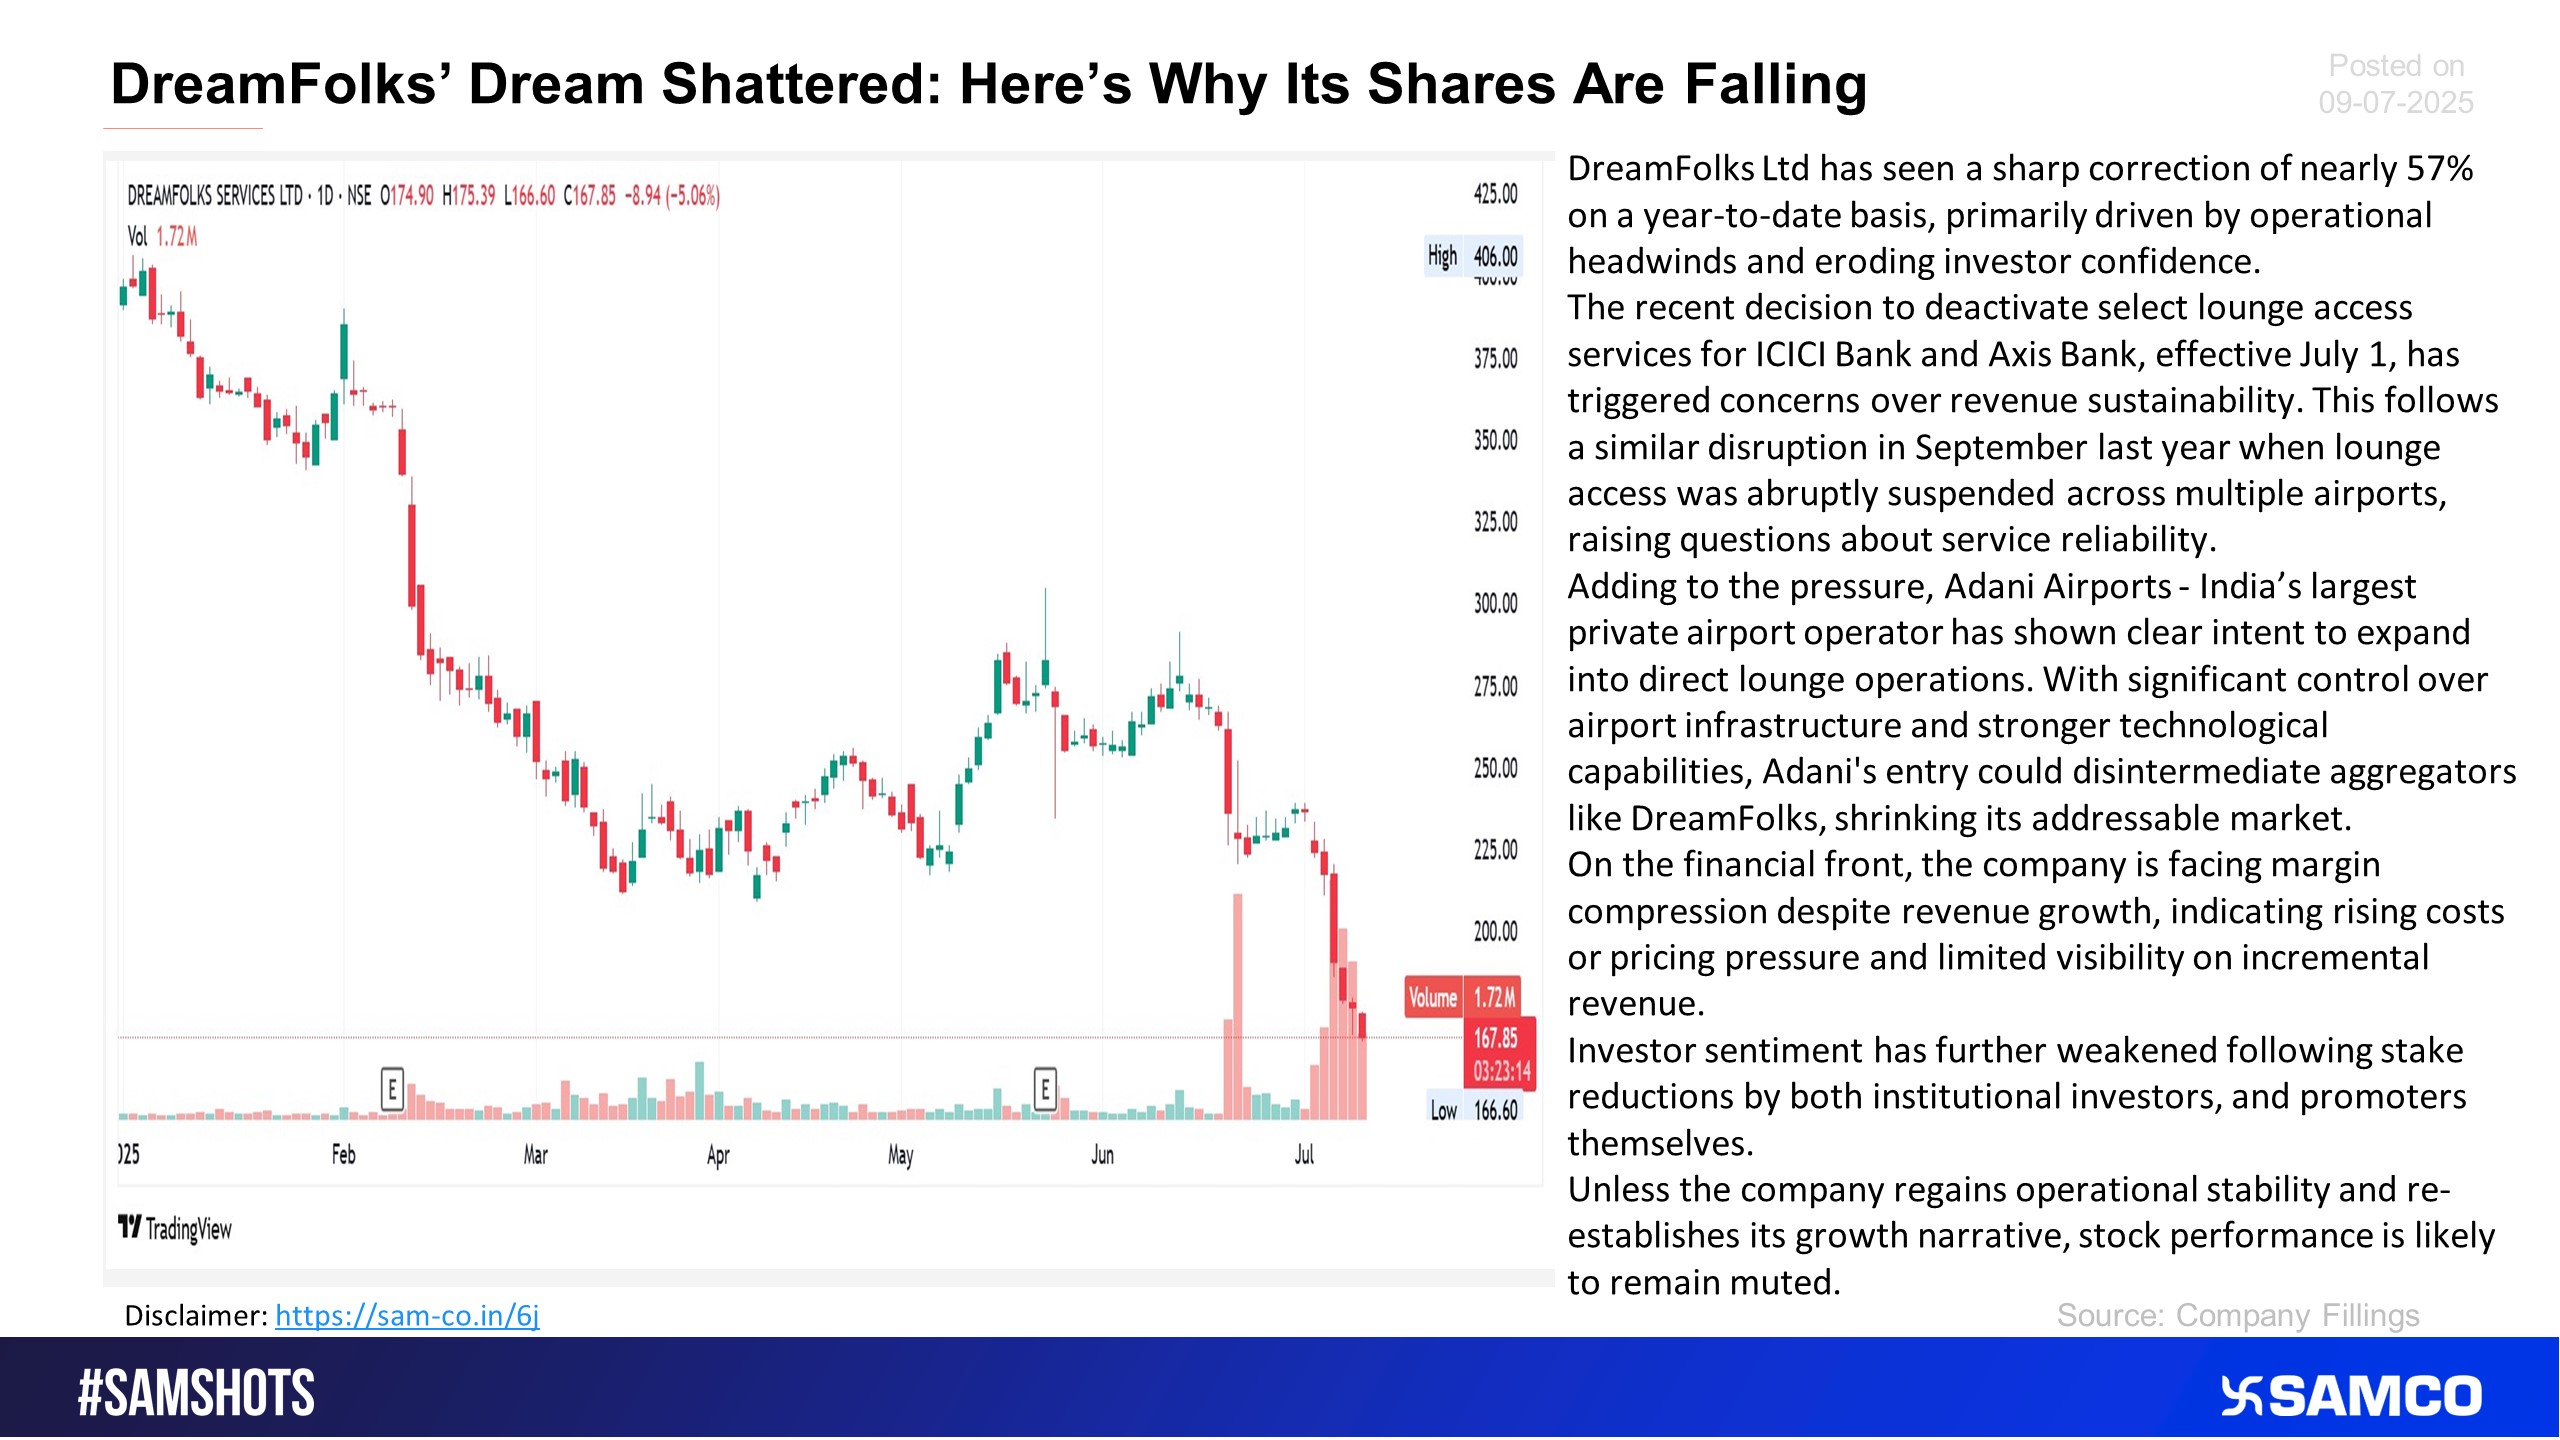
Here’s why DreamFolks share are falling.


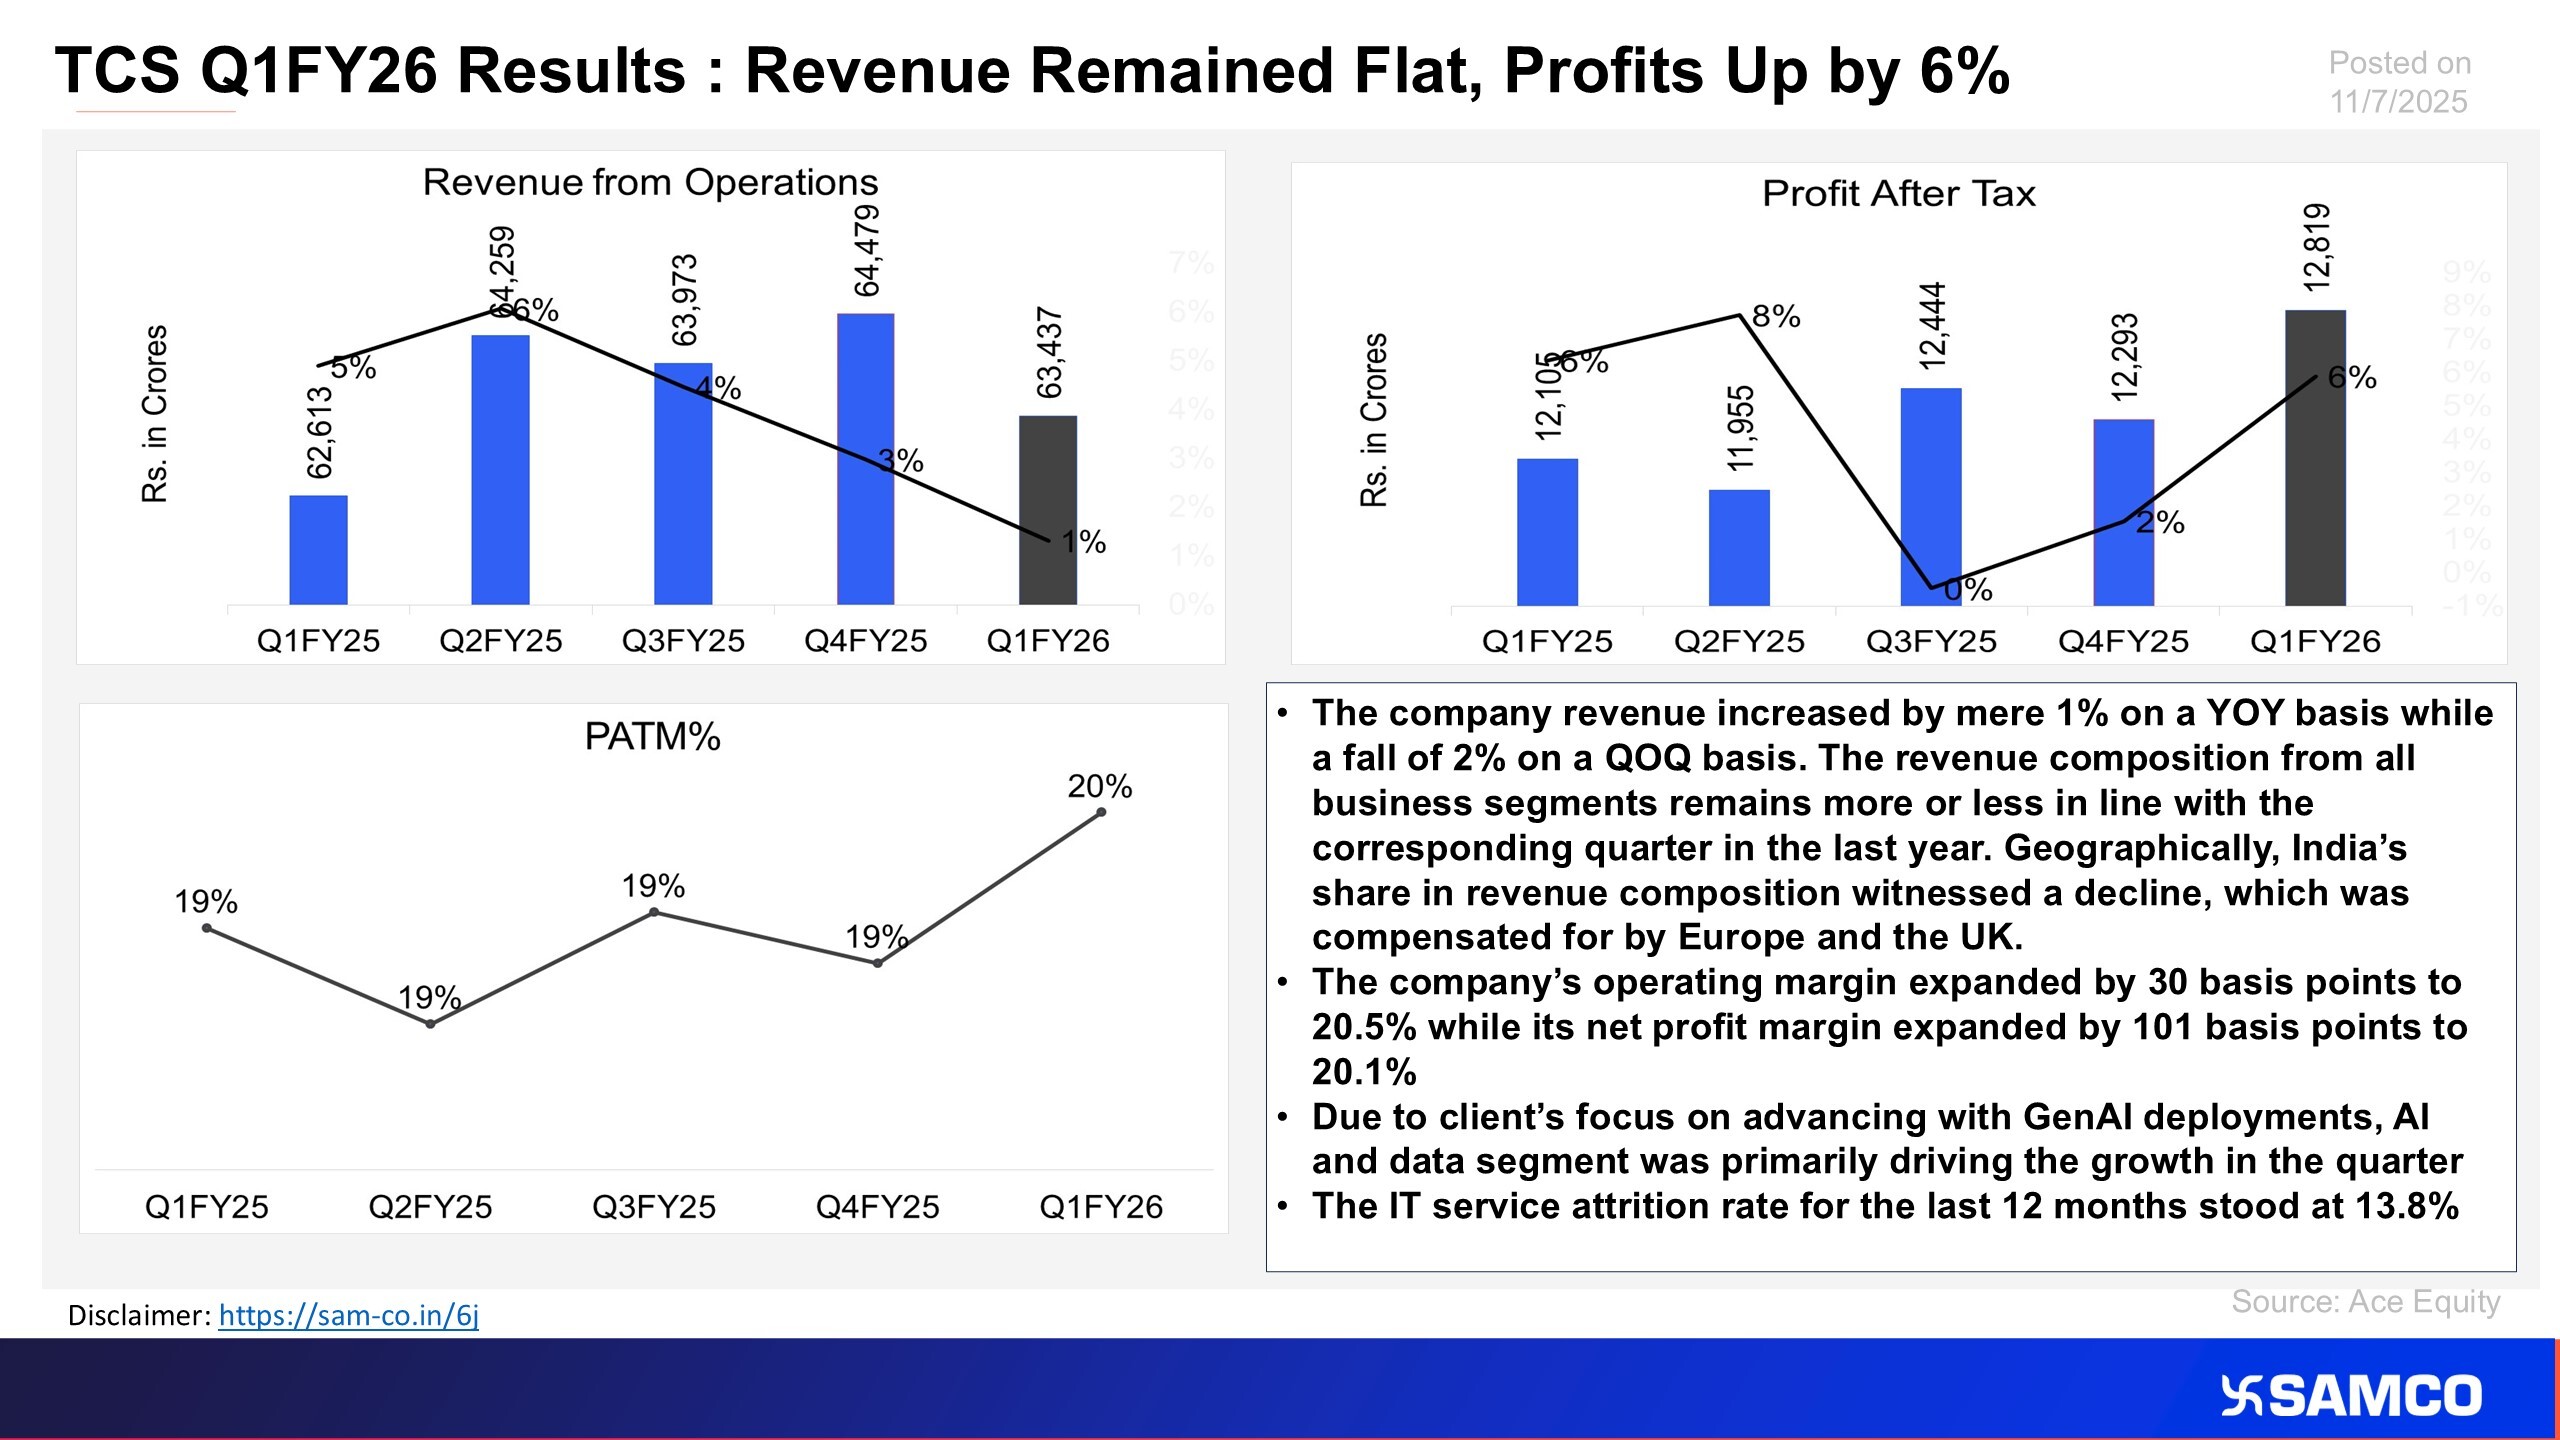
The chart displays the financial performance of TCS for Q1FY26
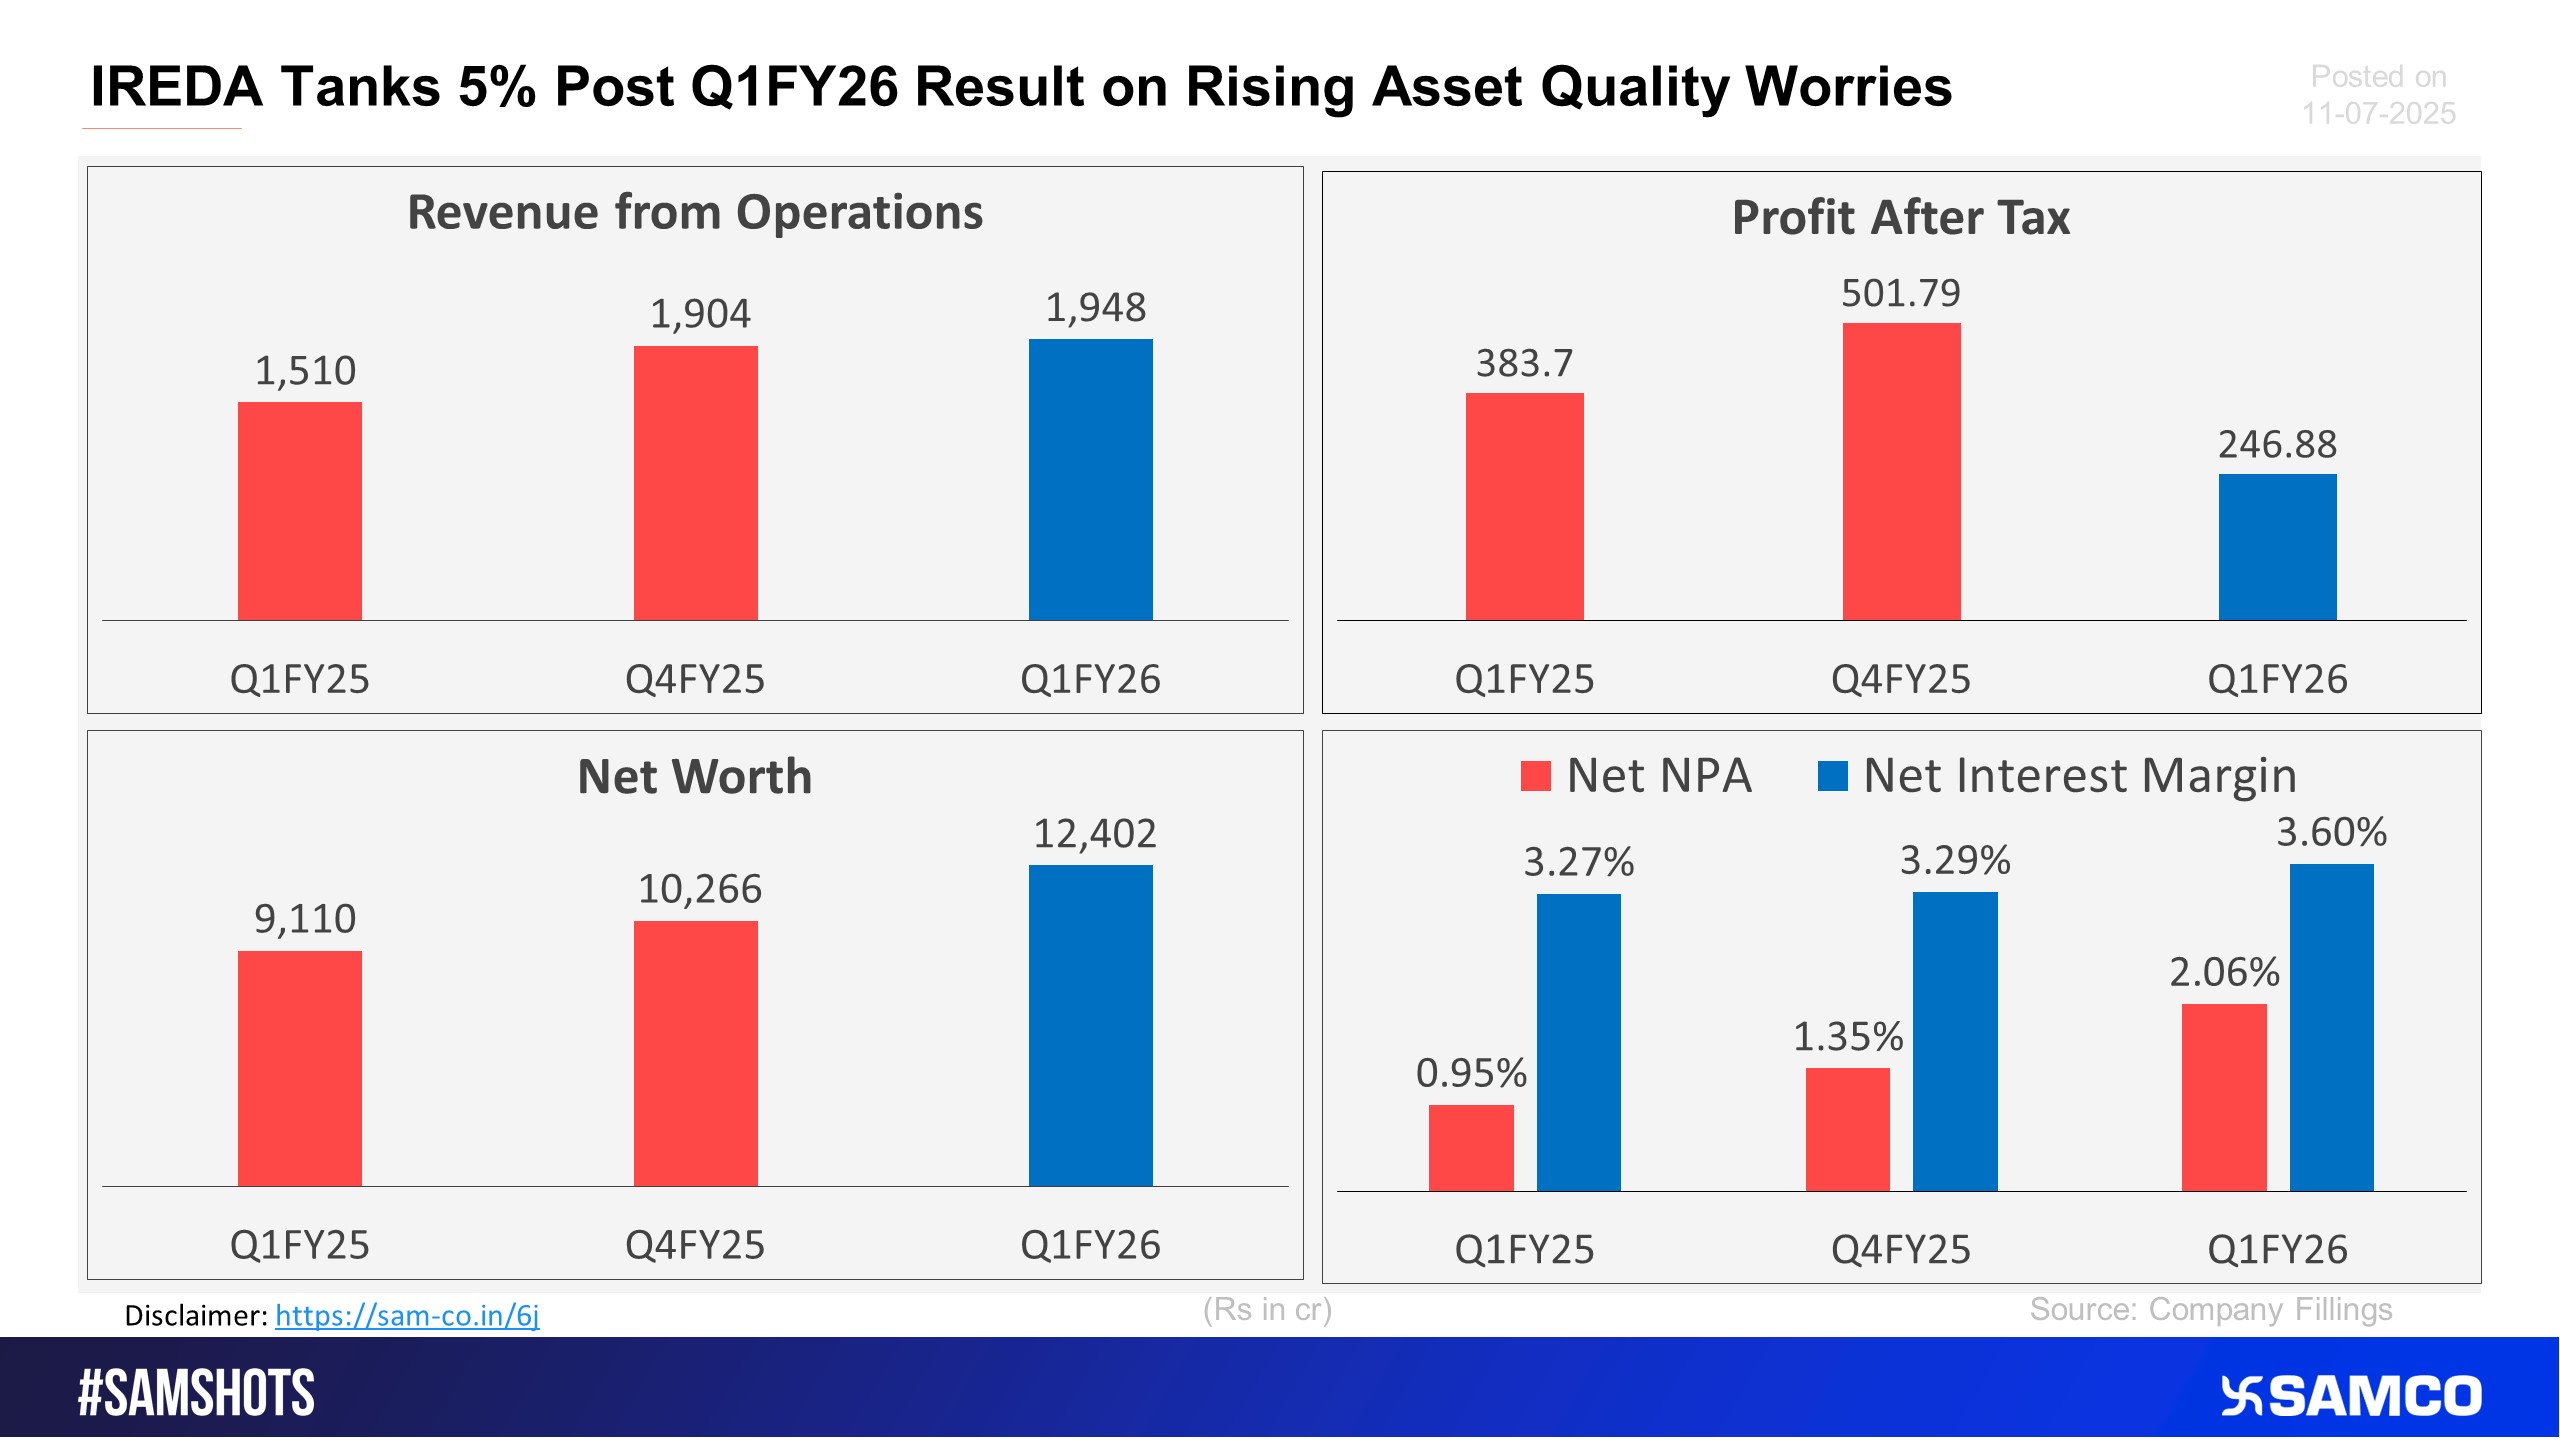
Here’s the IREDA’s Q1FY26 performance.
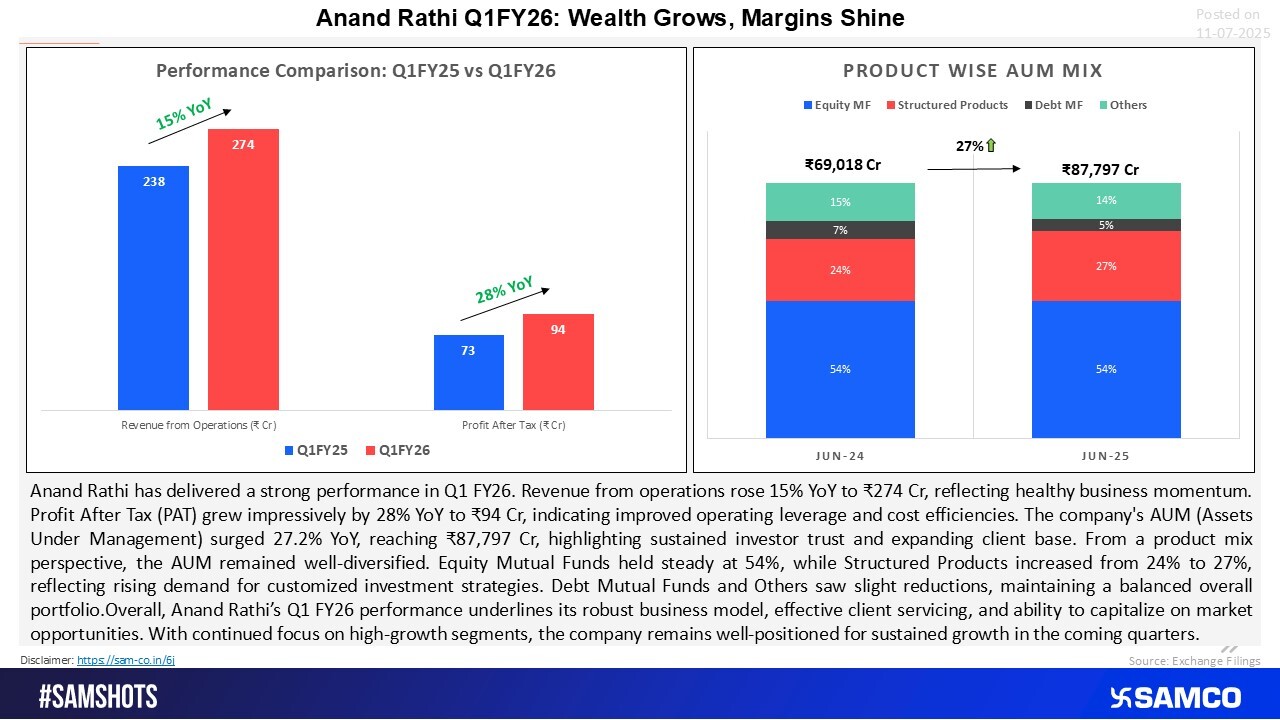
Q1FY26 Snapshot: Steady Growth, Solid Margins at Anand Rathi
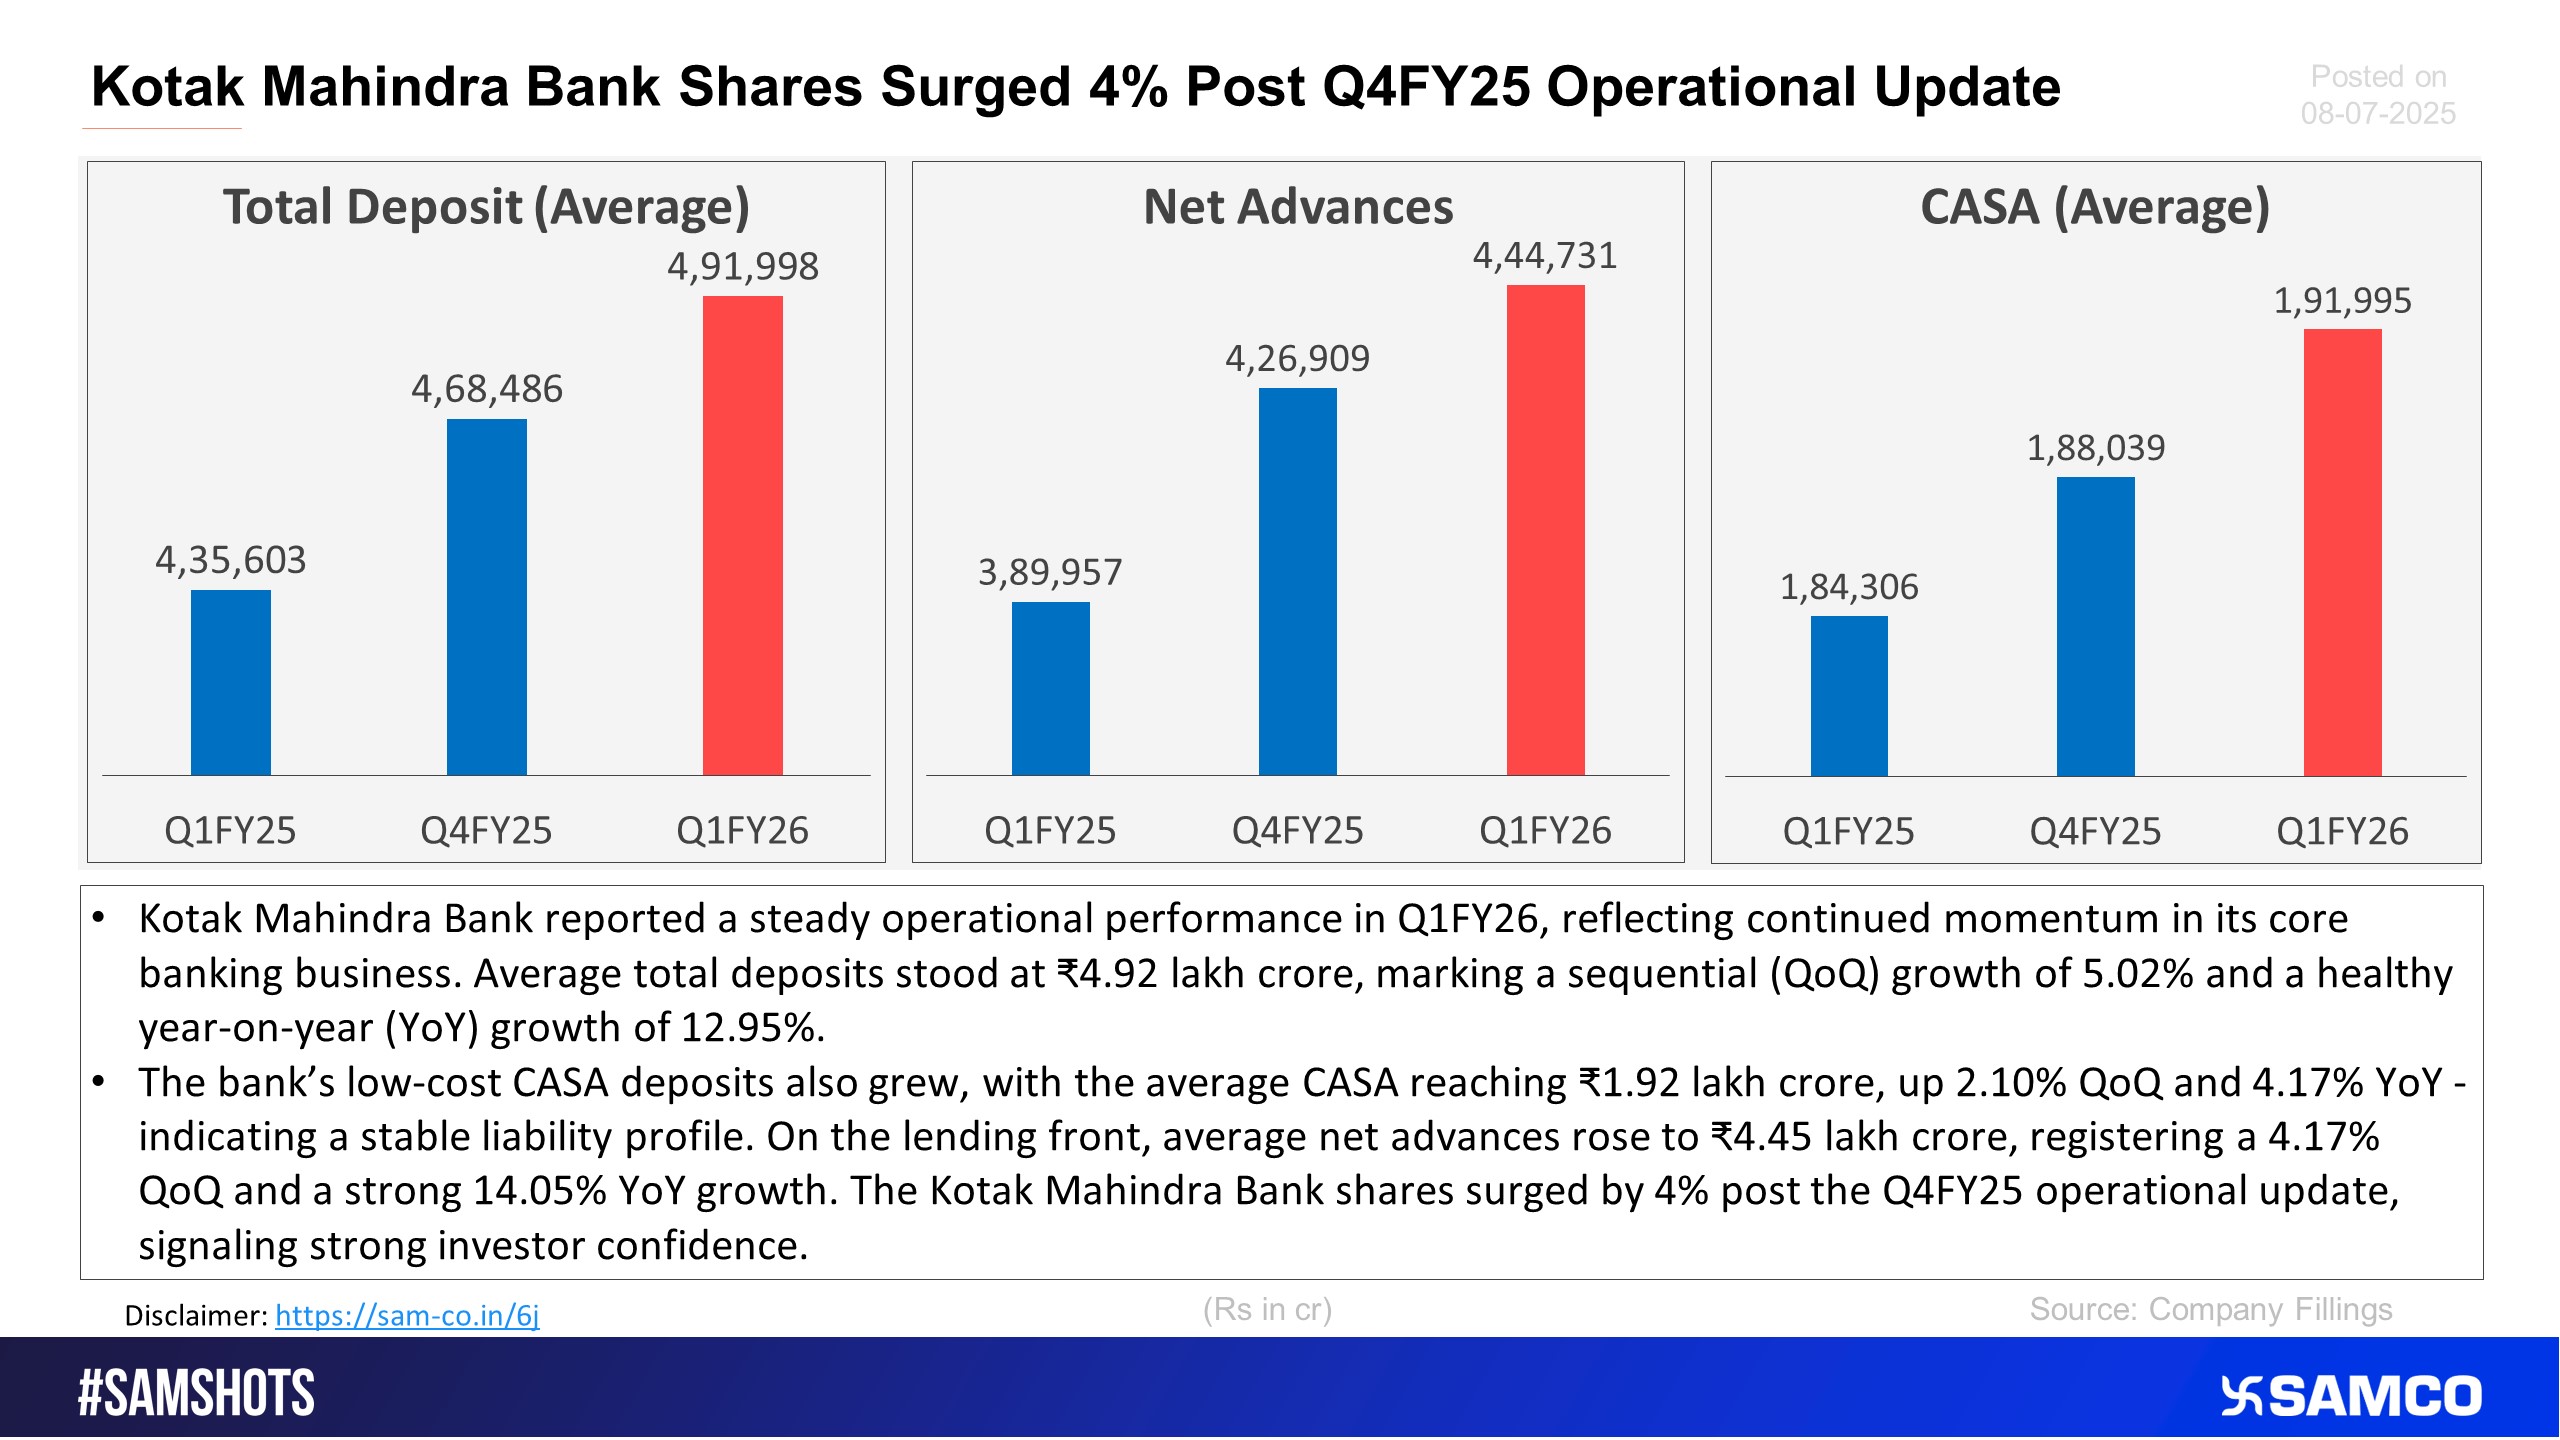
The below chart shows the operational update of Kotak Mahindra Bank for Q1FY26.
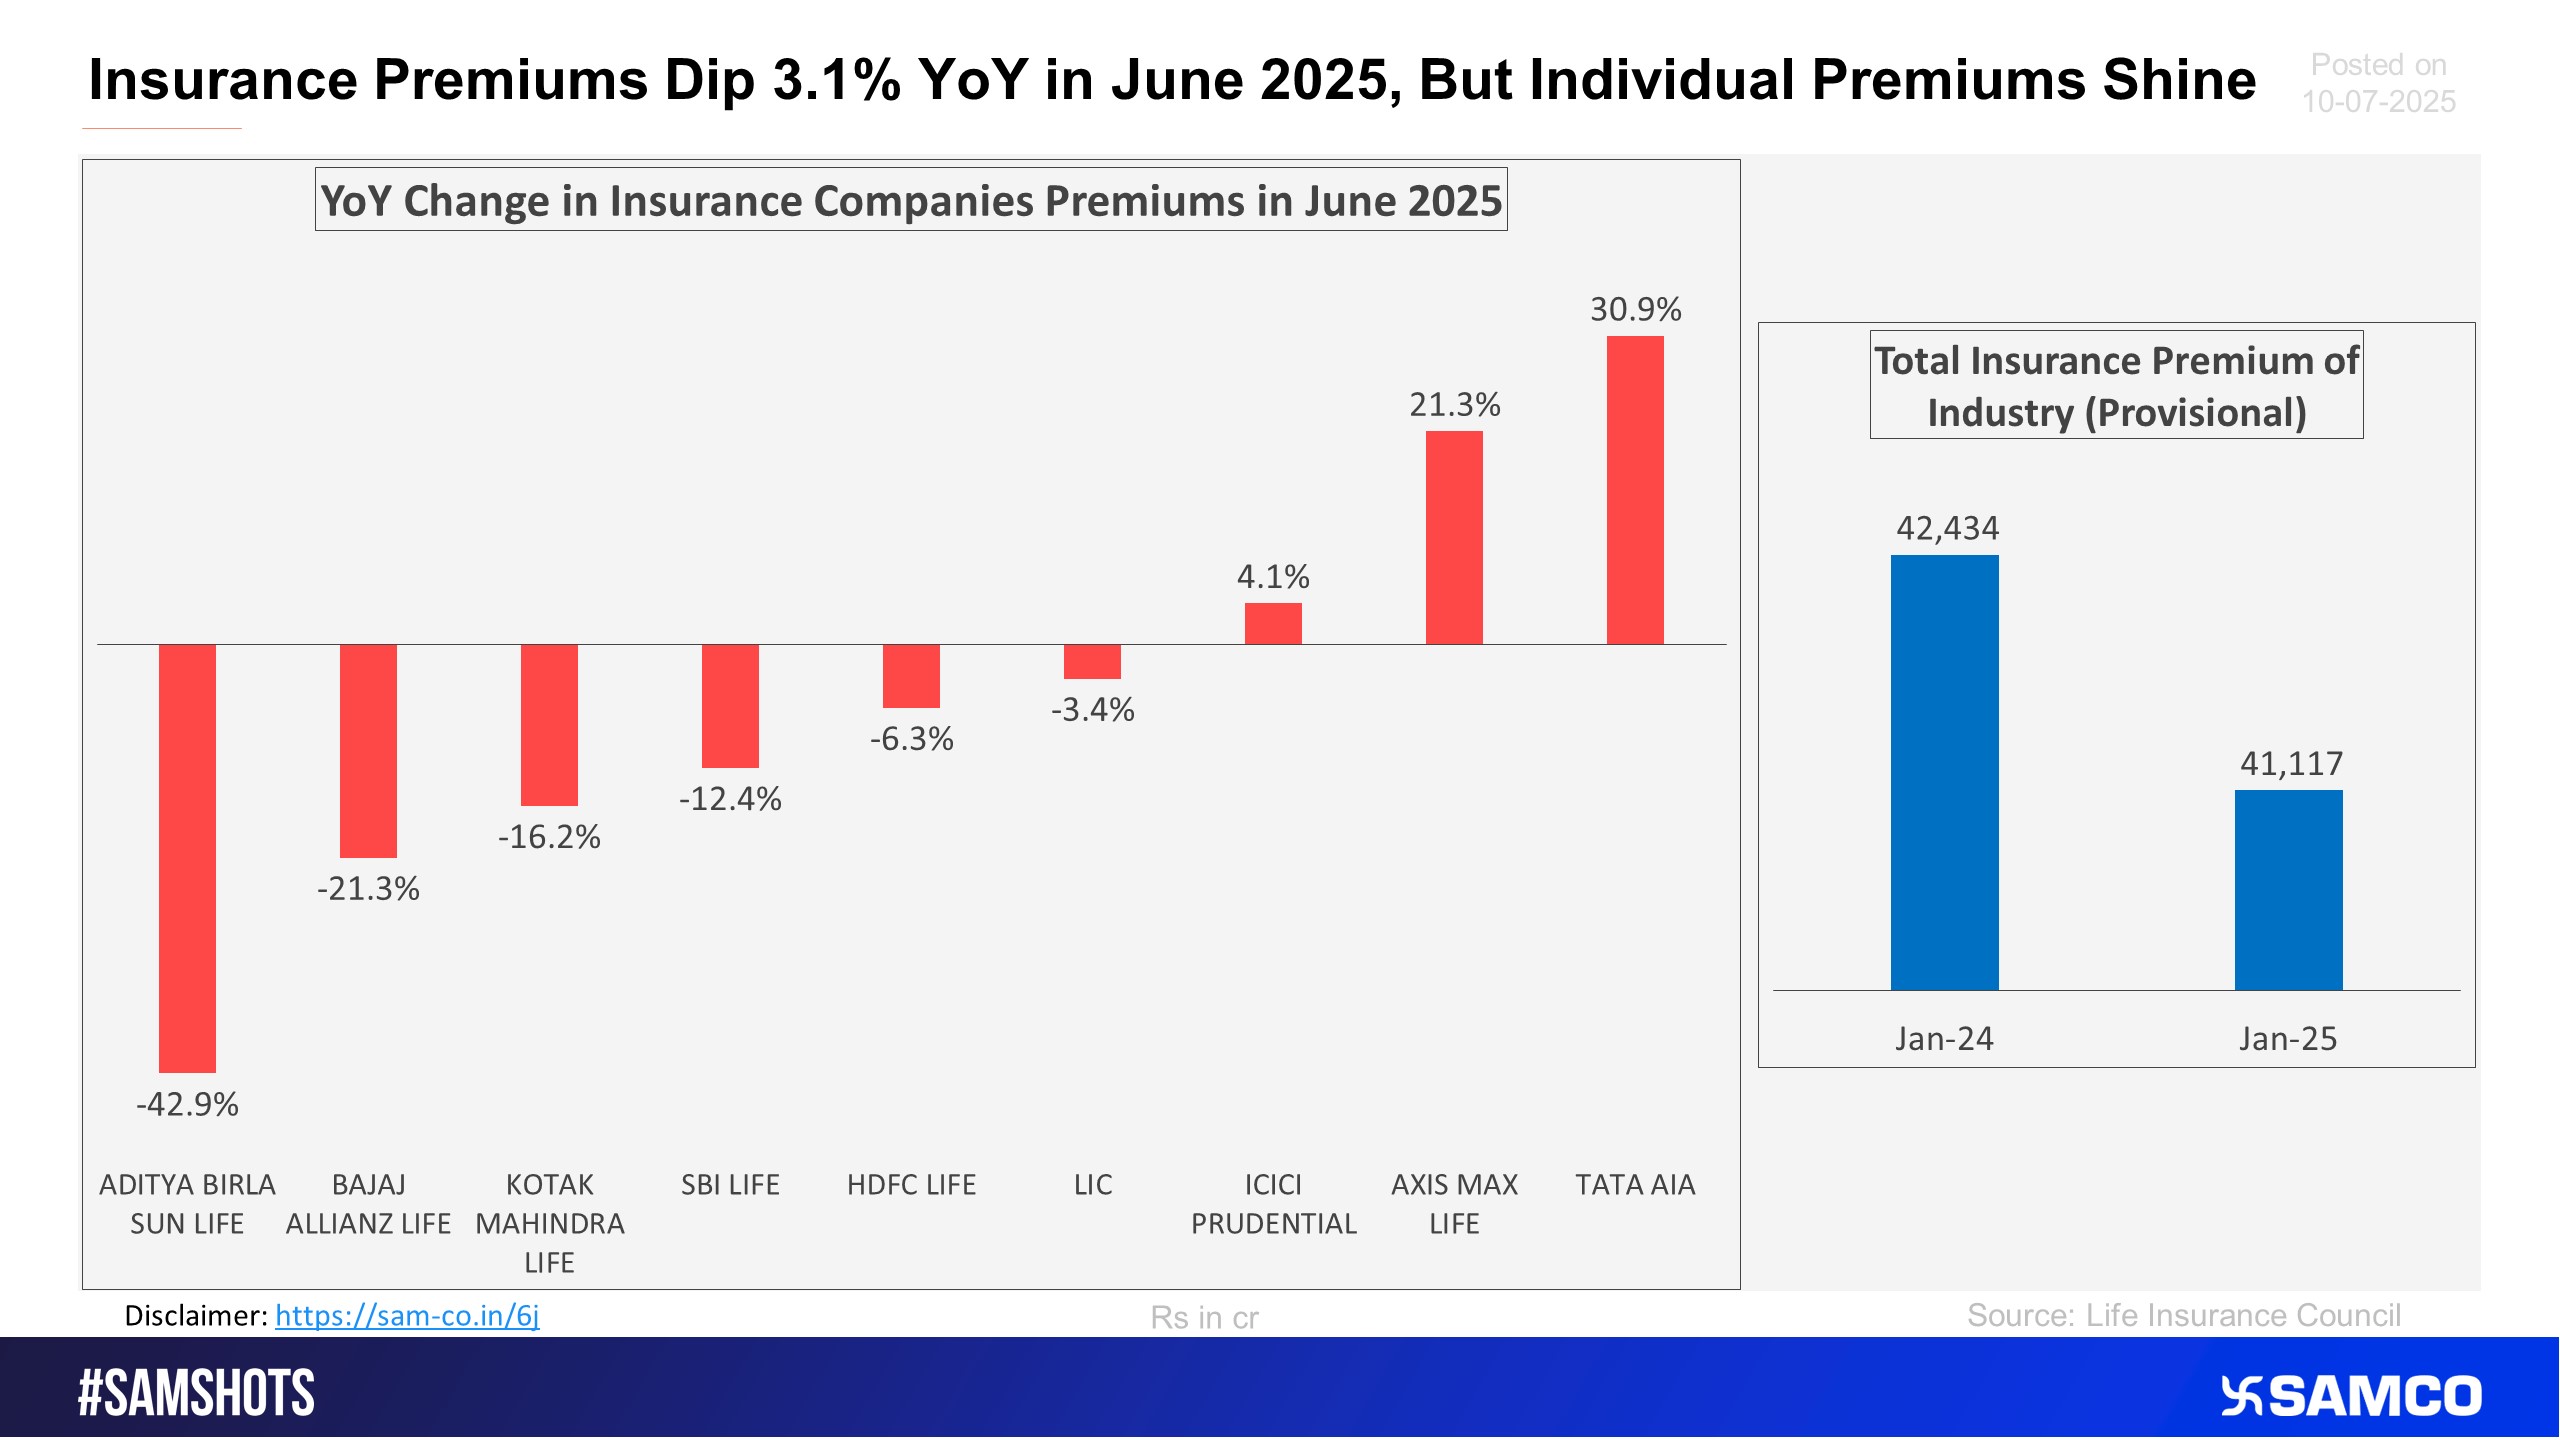
The below chart shows the provisional business update of the Major Insurance Players in India.
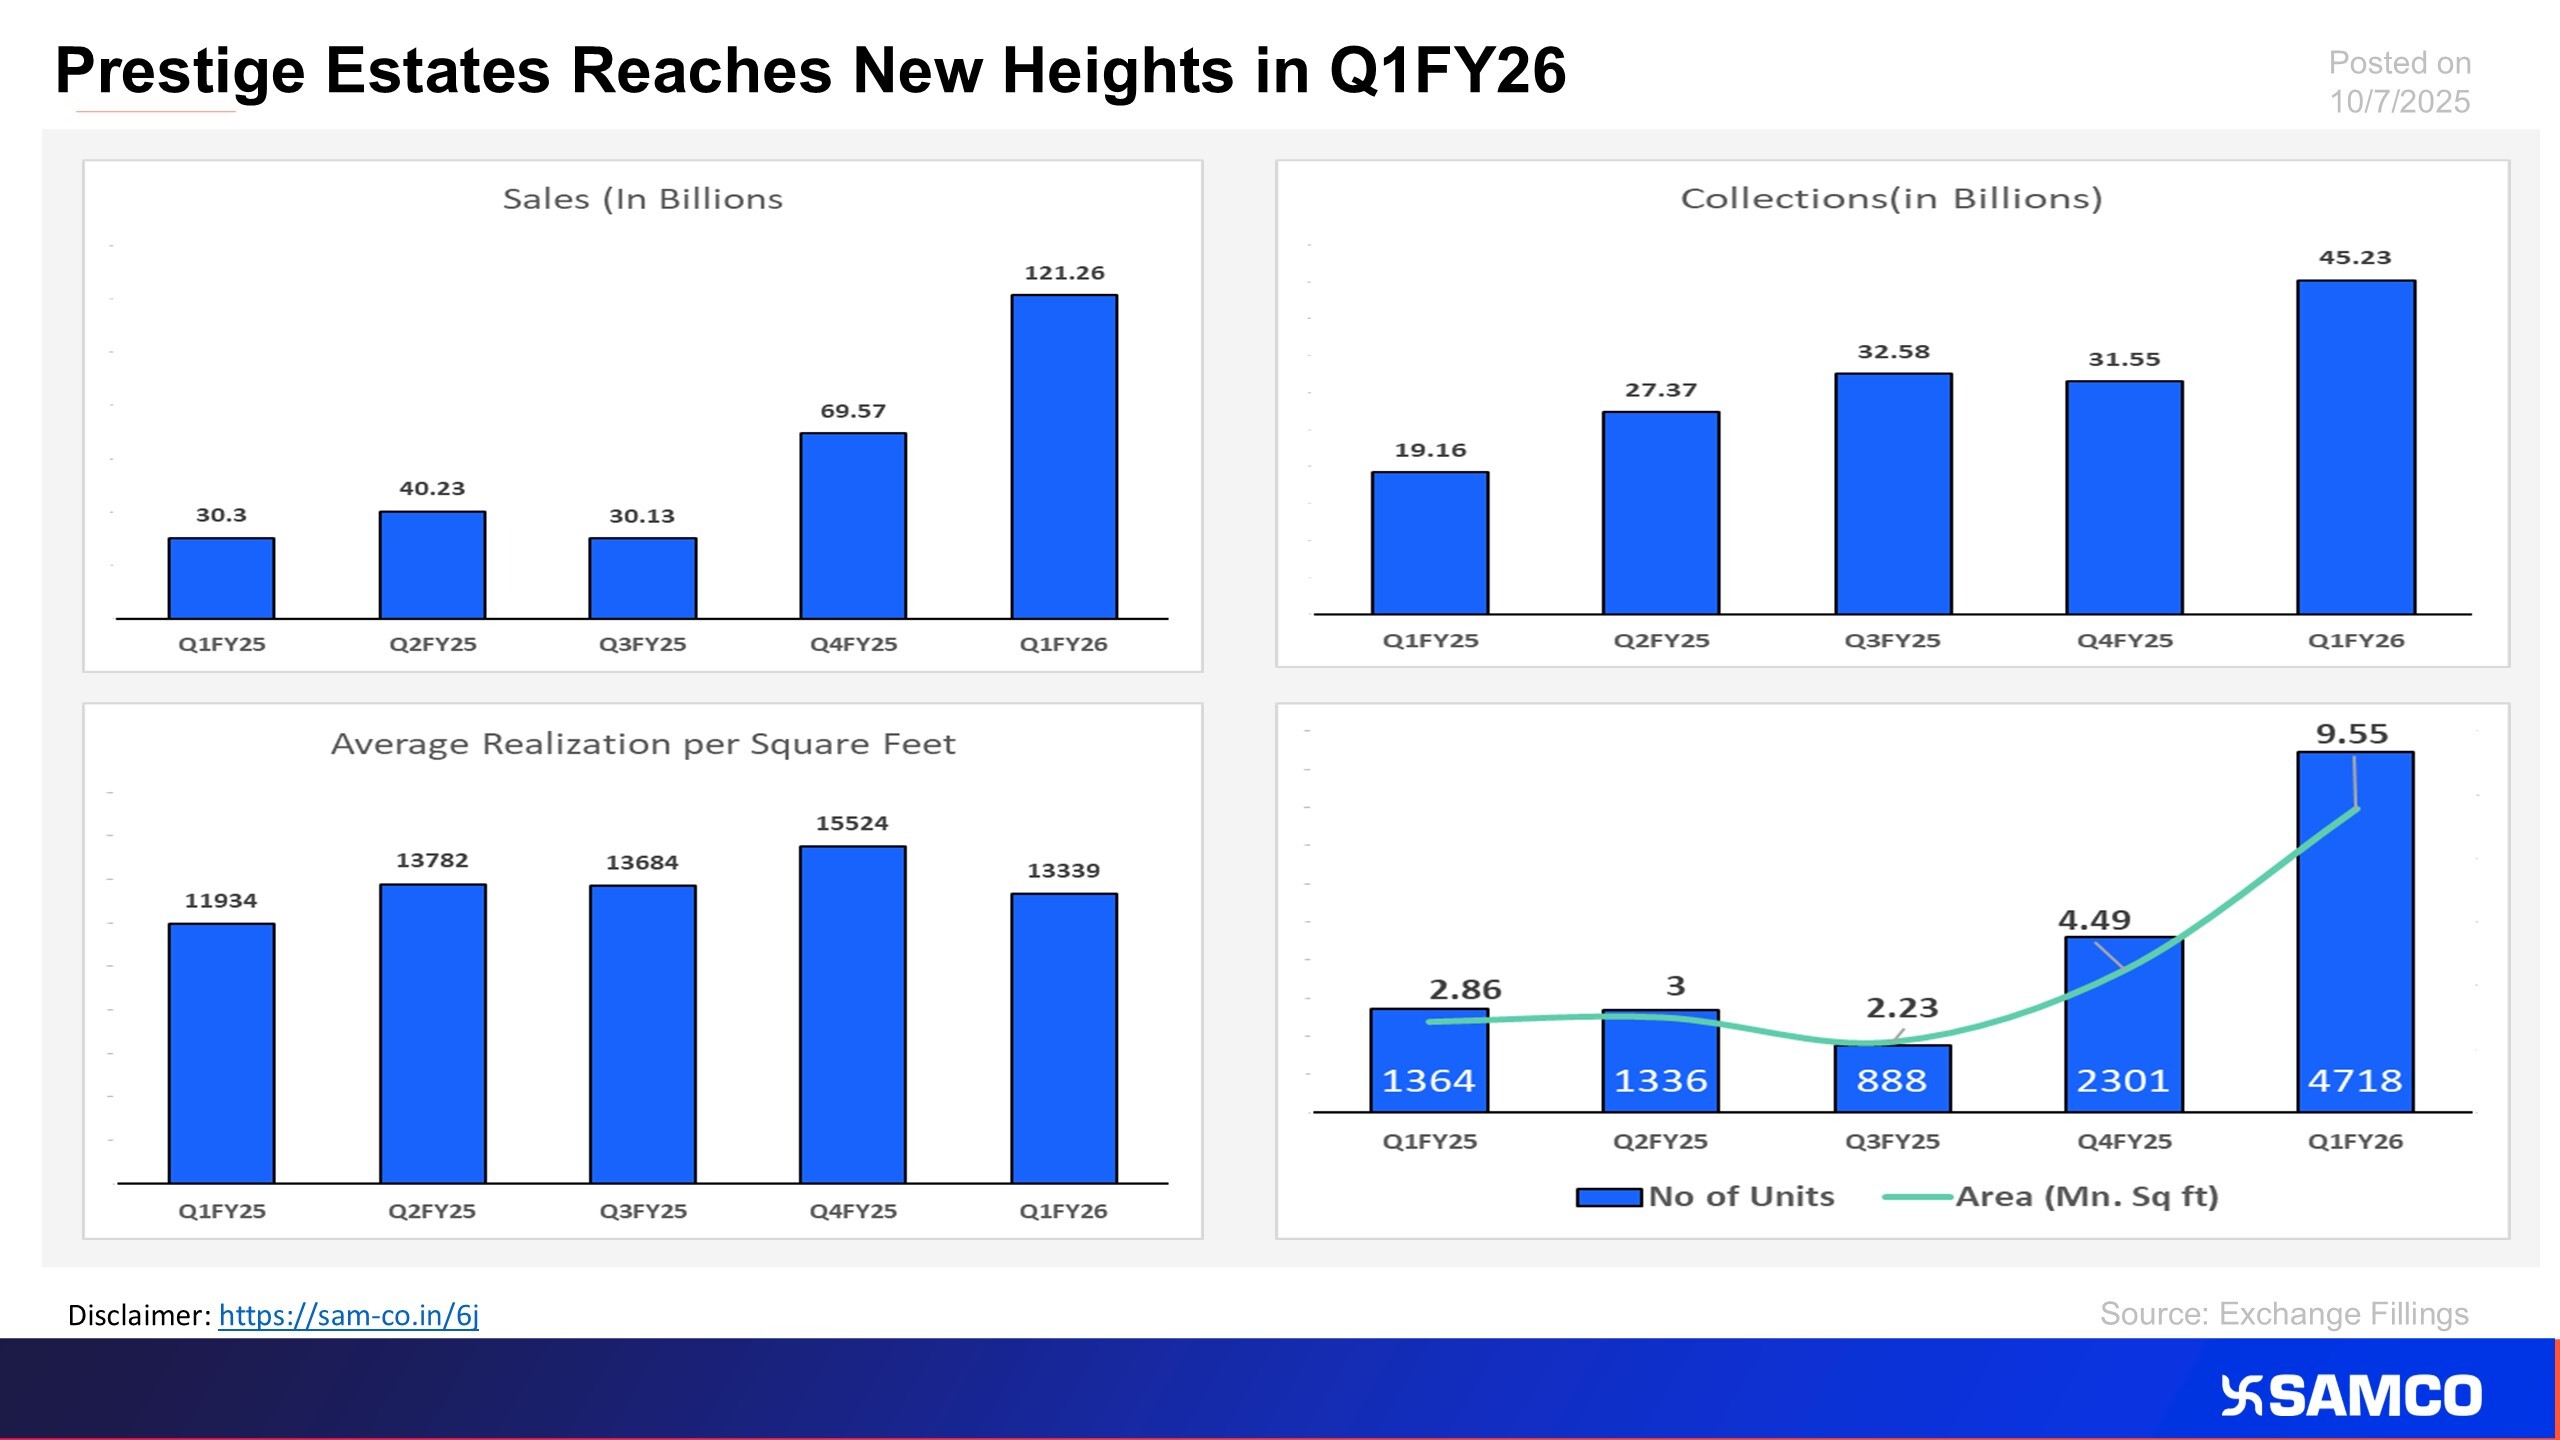
Q1FY26 seeing multifold increase in area sold For Prestige estates
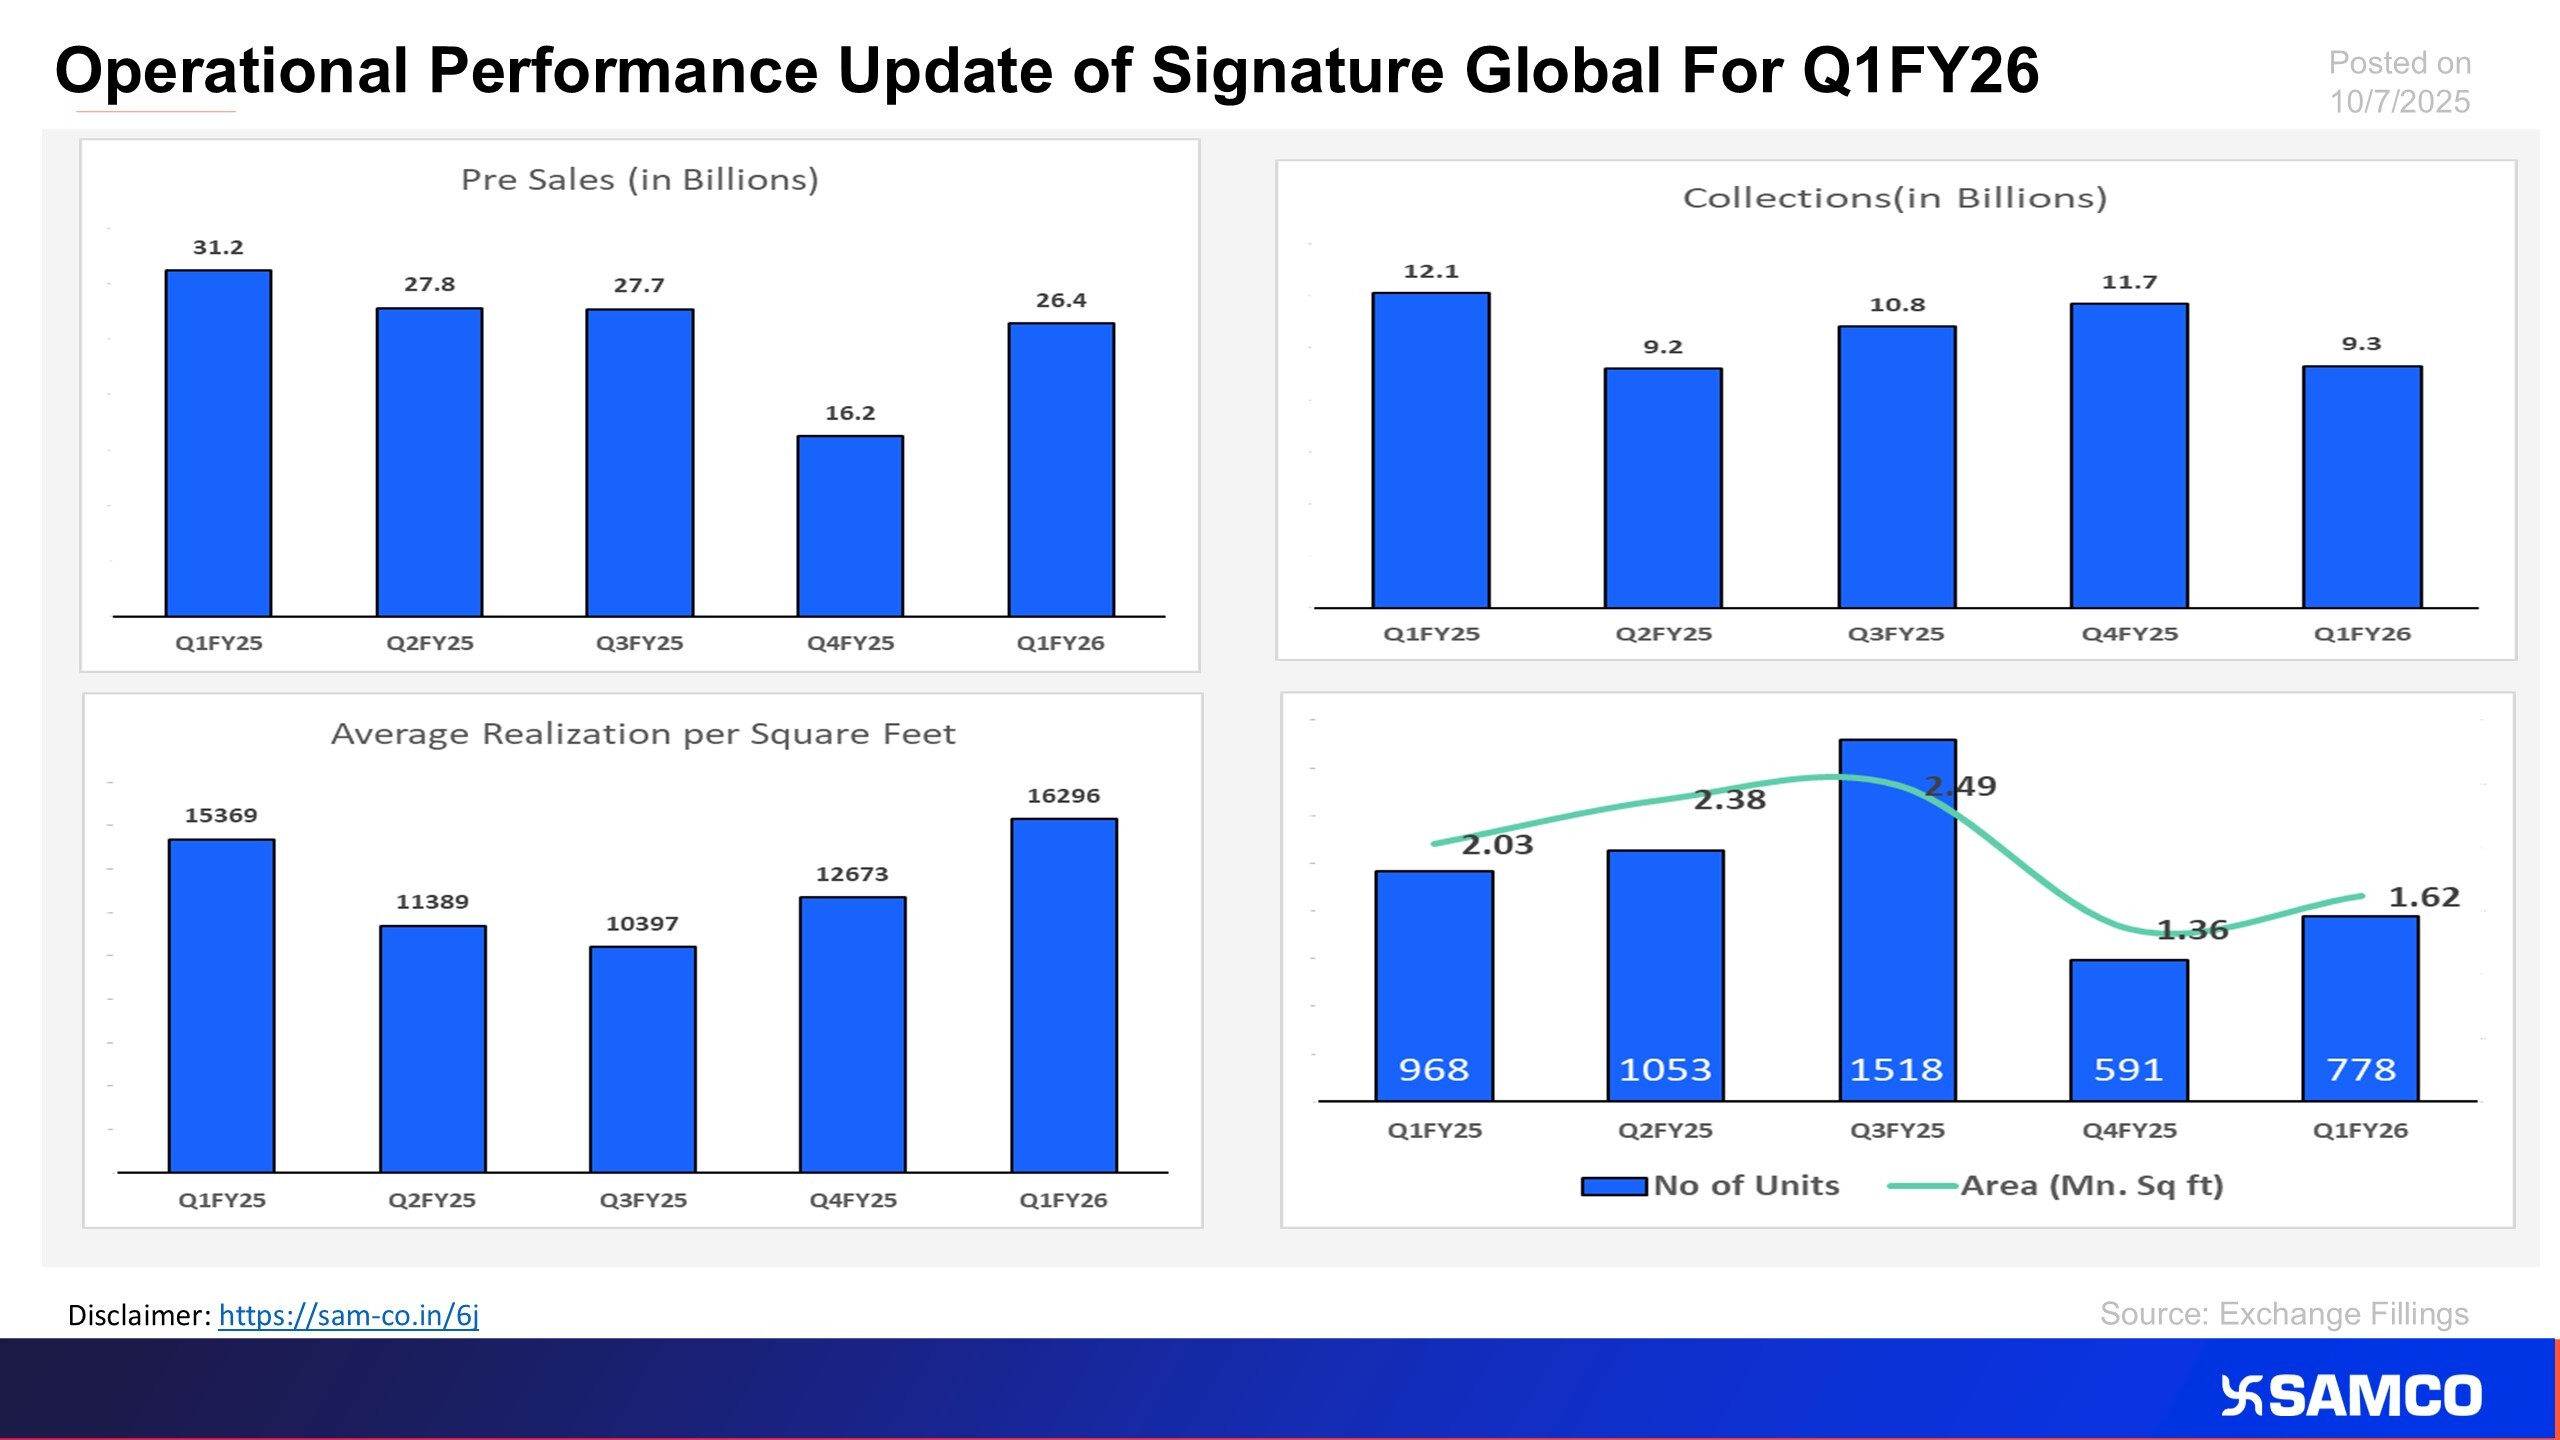
The chart displays the operational performance of Signature Global for Q1FY26
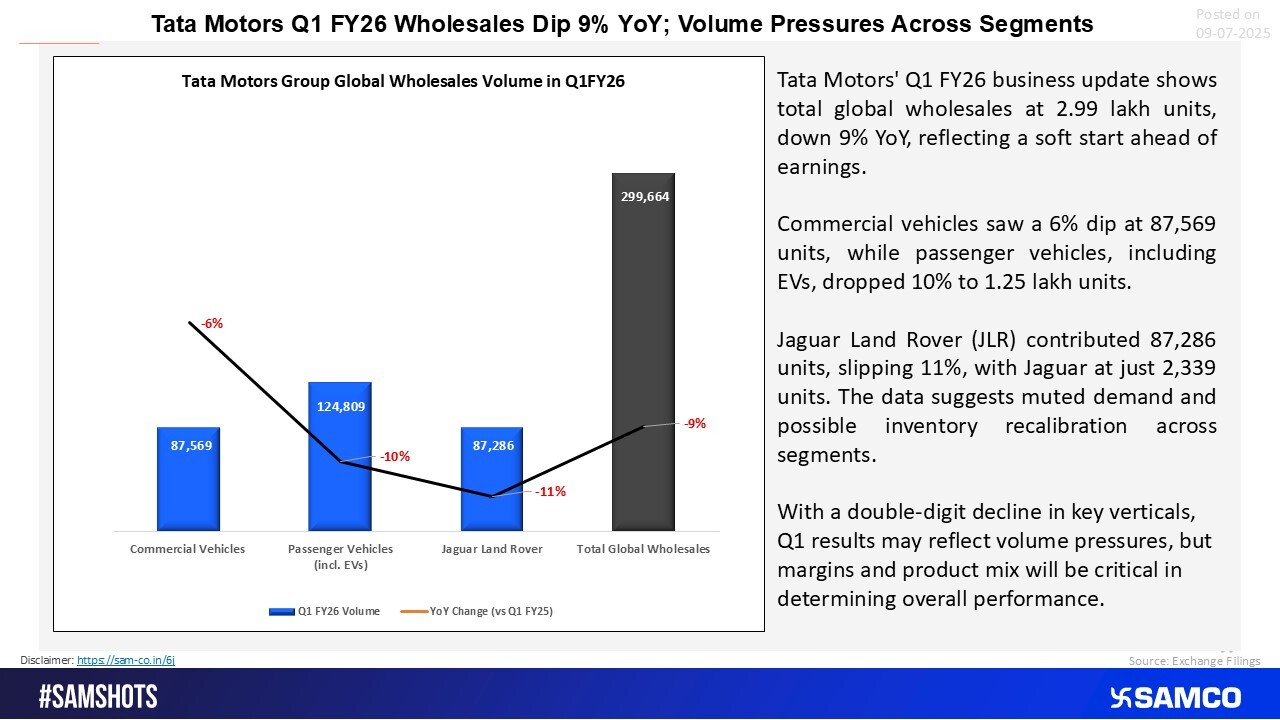
Tata Motors Q1 FY 2026 Business Update.
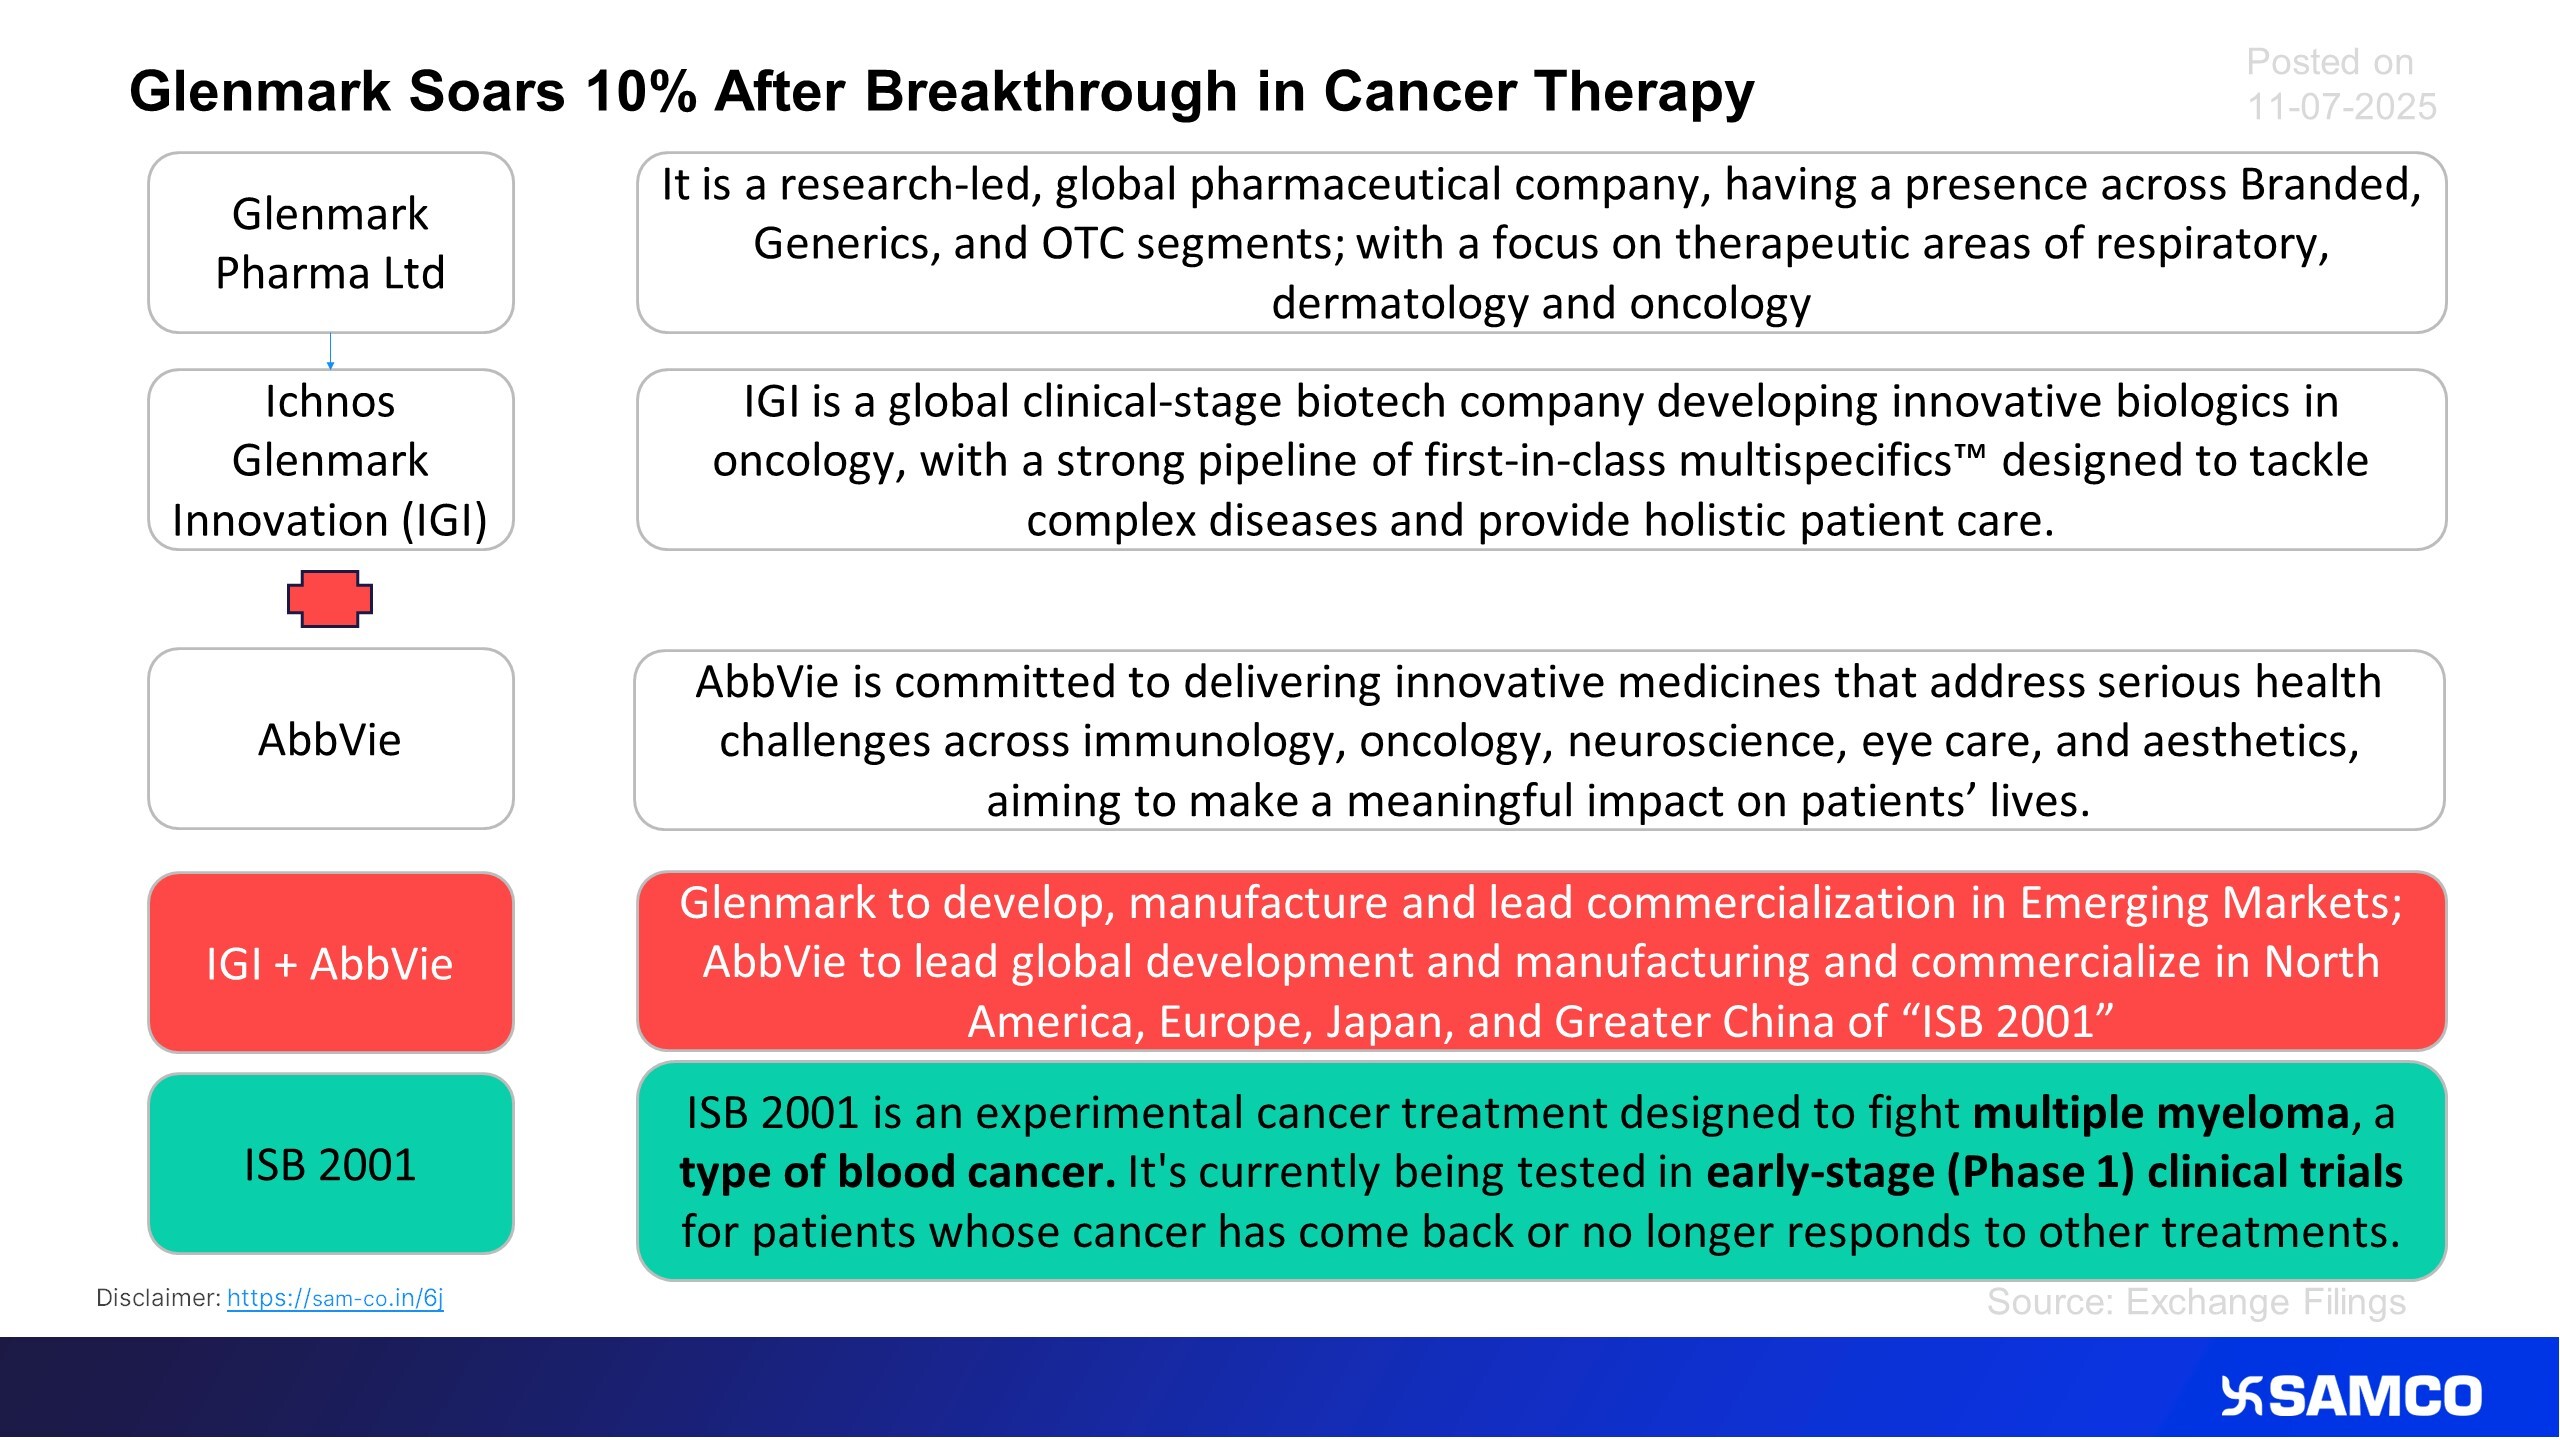
This is why Glenmark’s shares shot up 10% today.
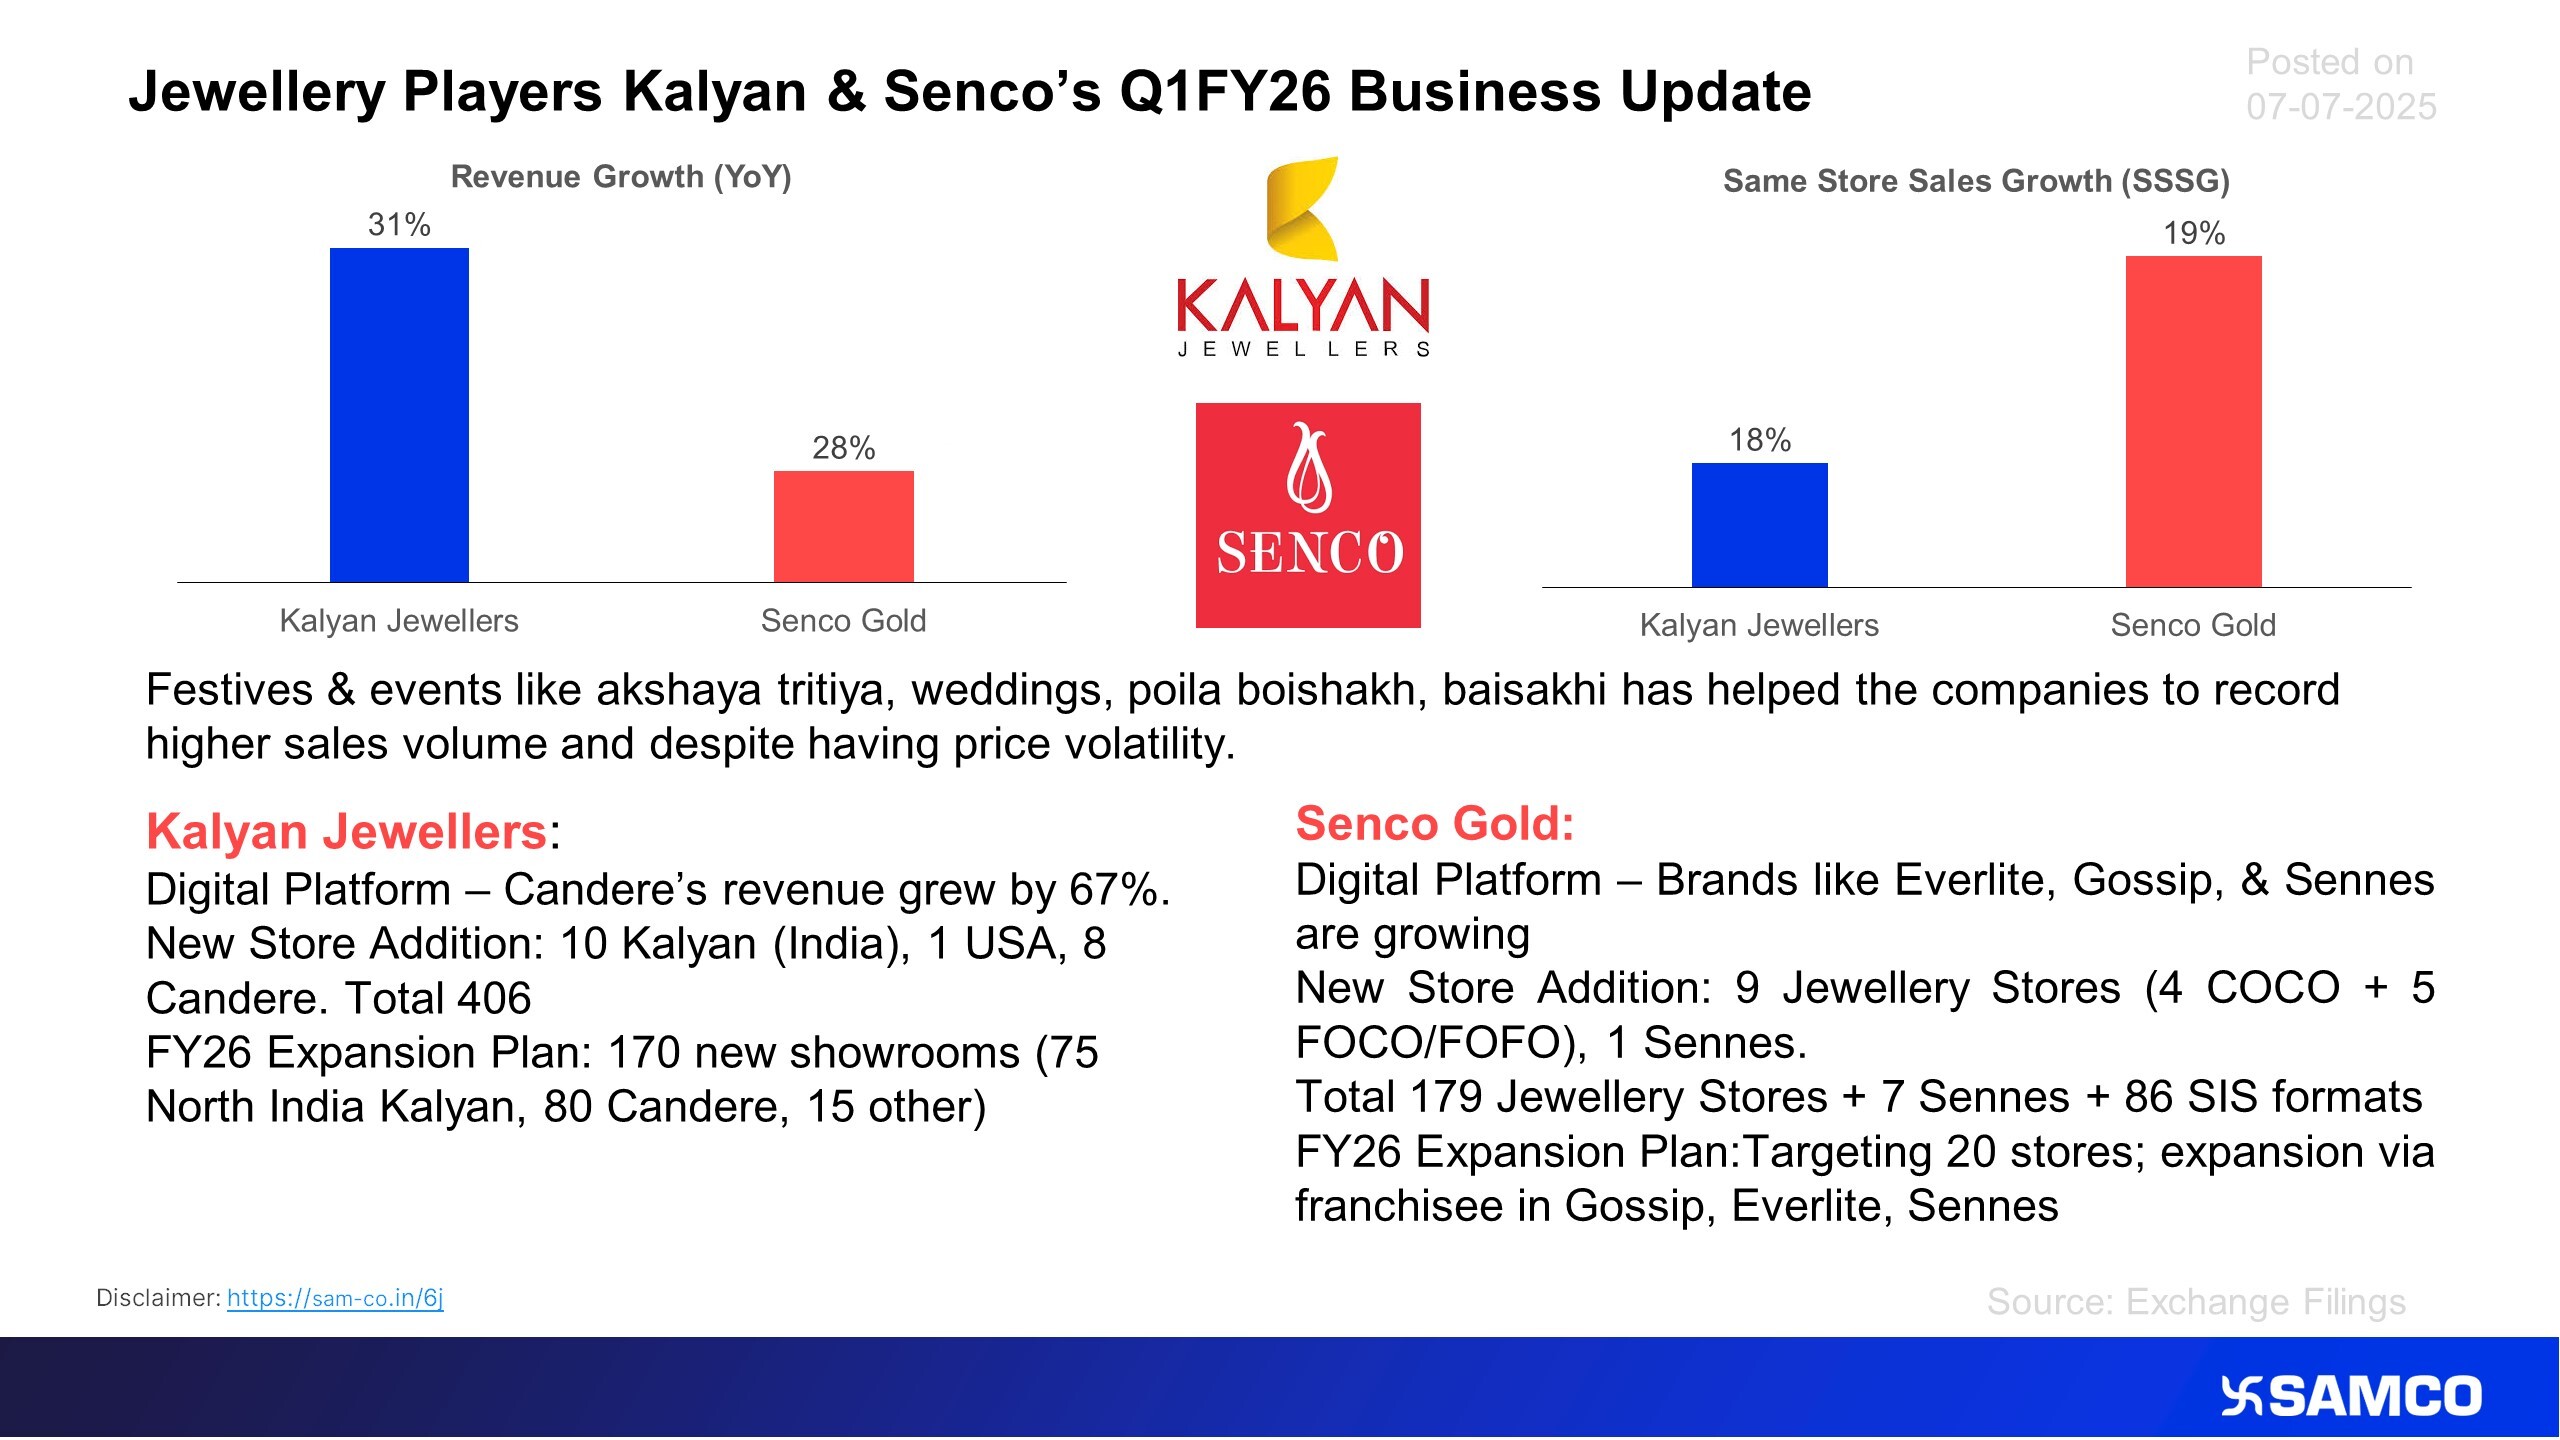
Here’s the business update of Kalyan Jewellers & Senco Gold in Q1FY26.
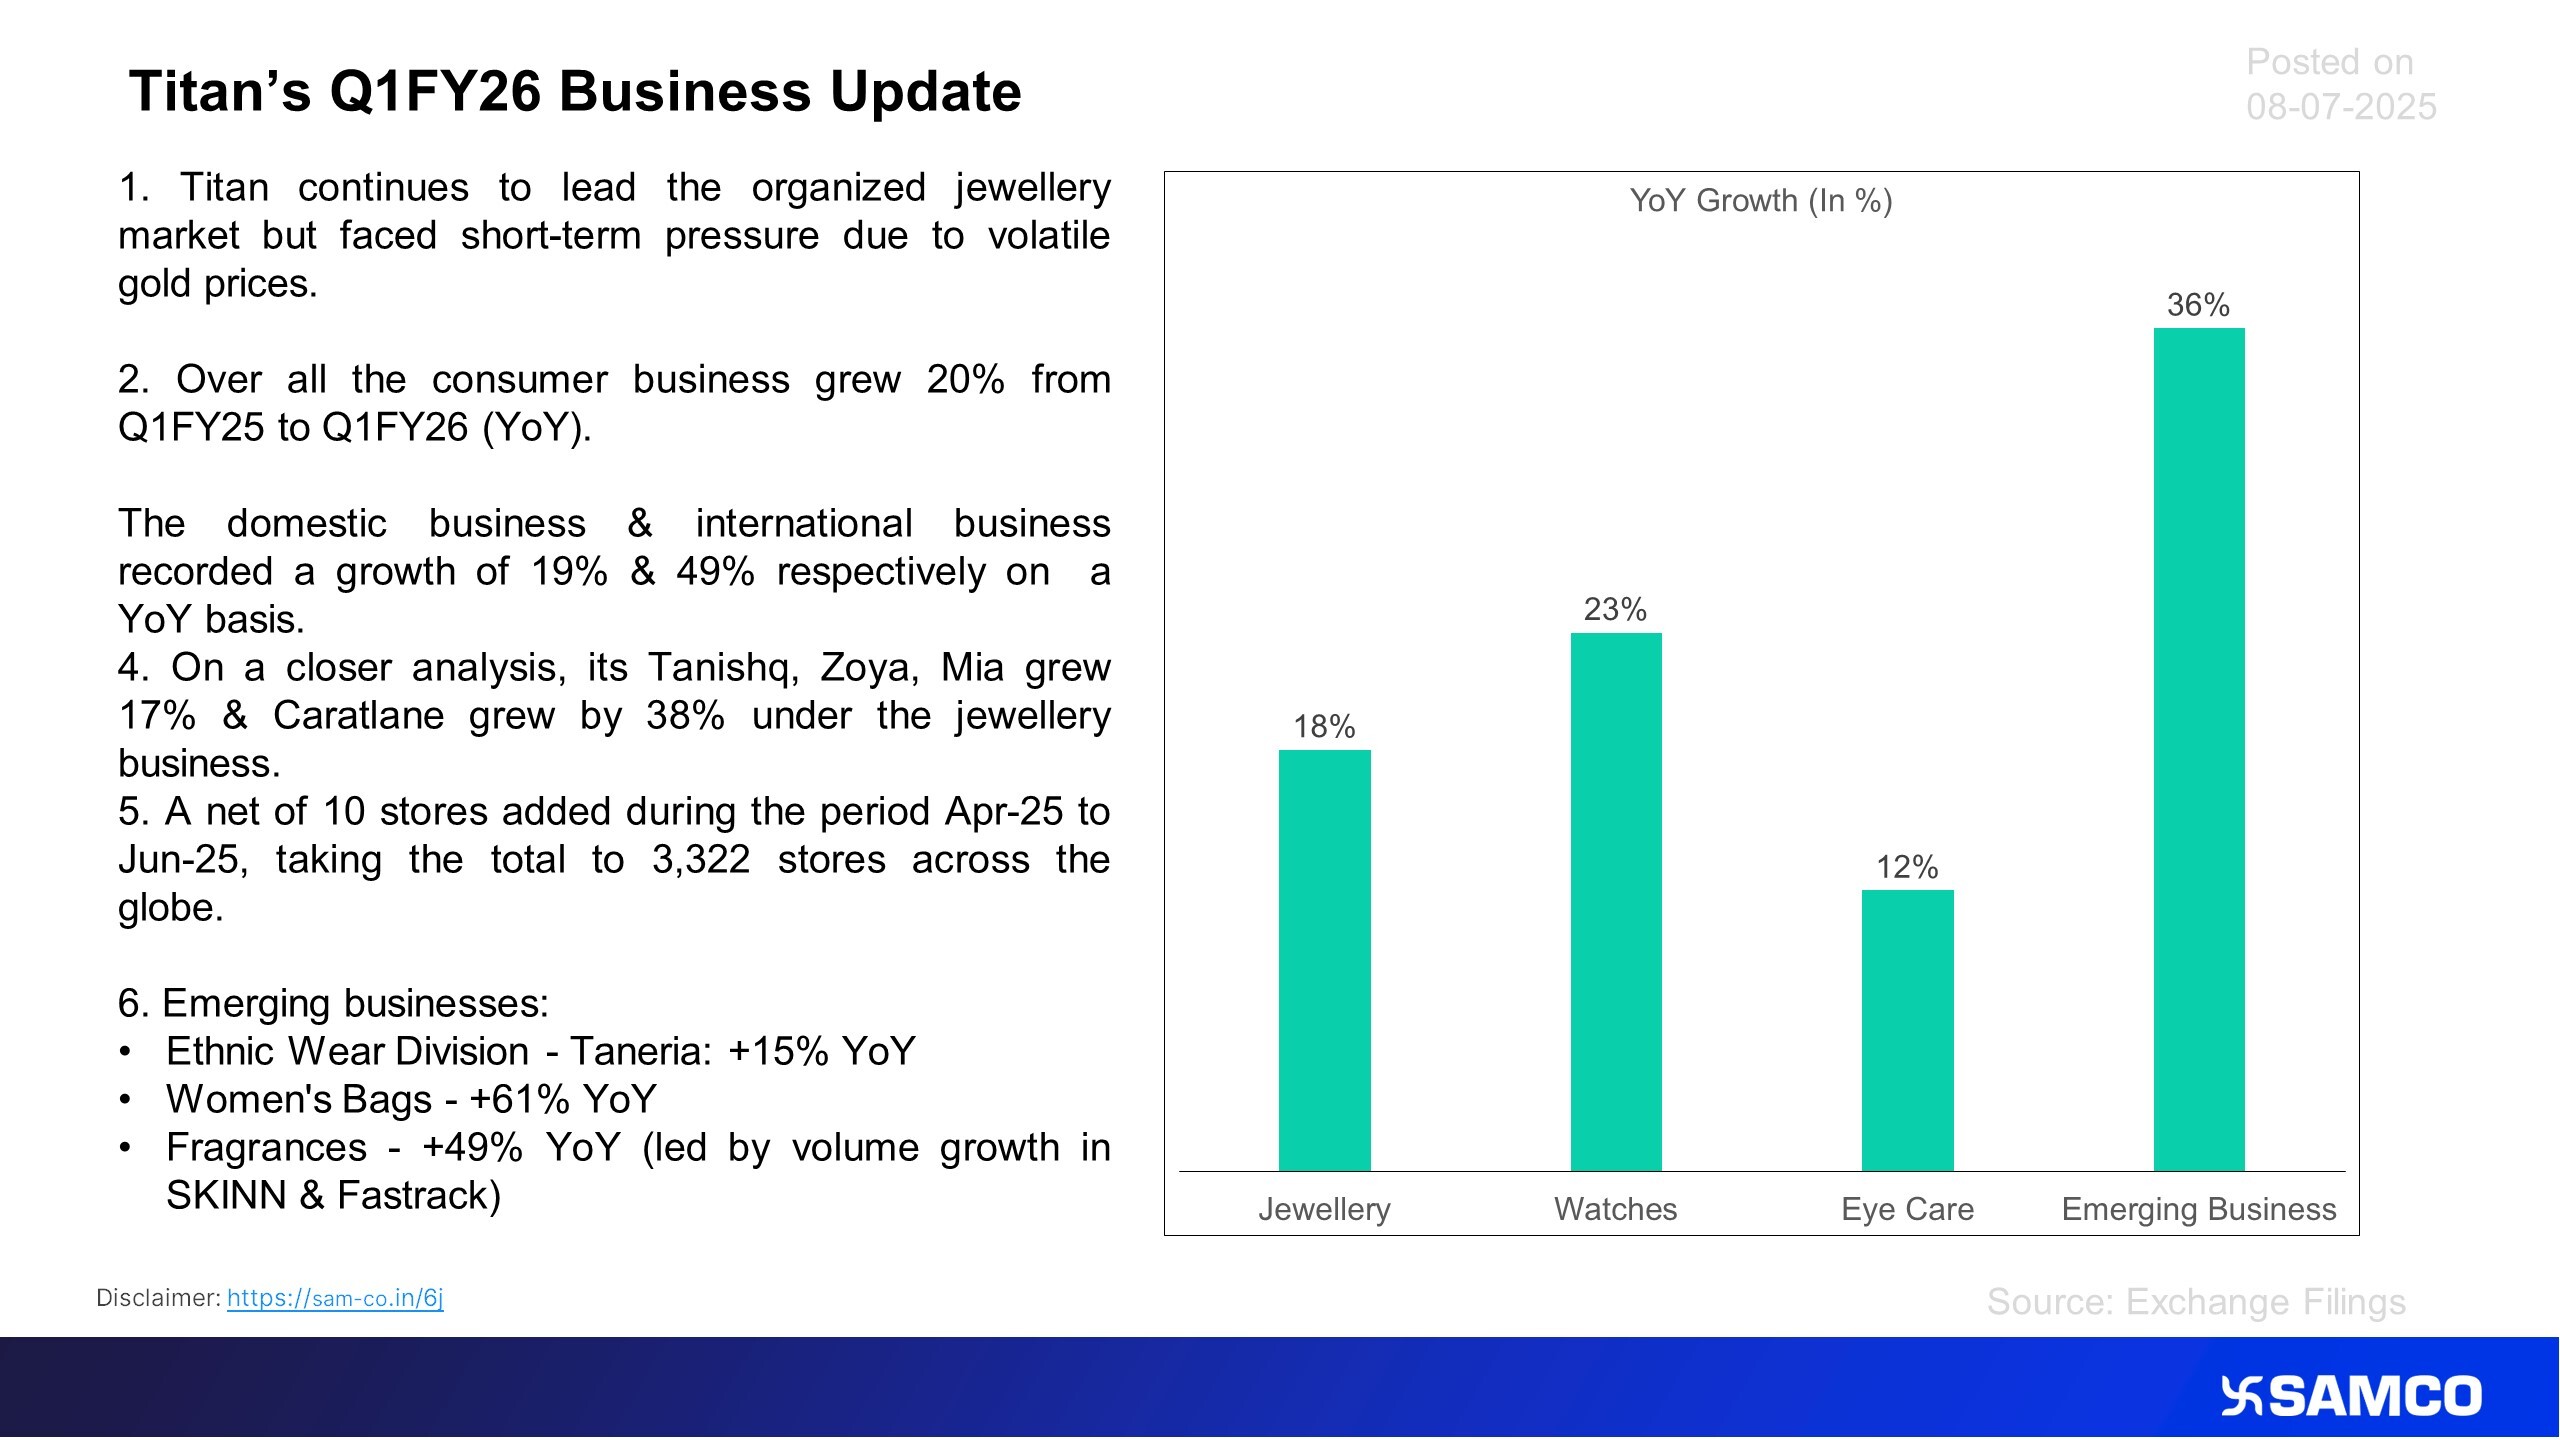
The accompanying presents the quarterly performance of Titan for the quarter ending Jun-25.
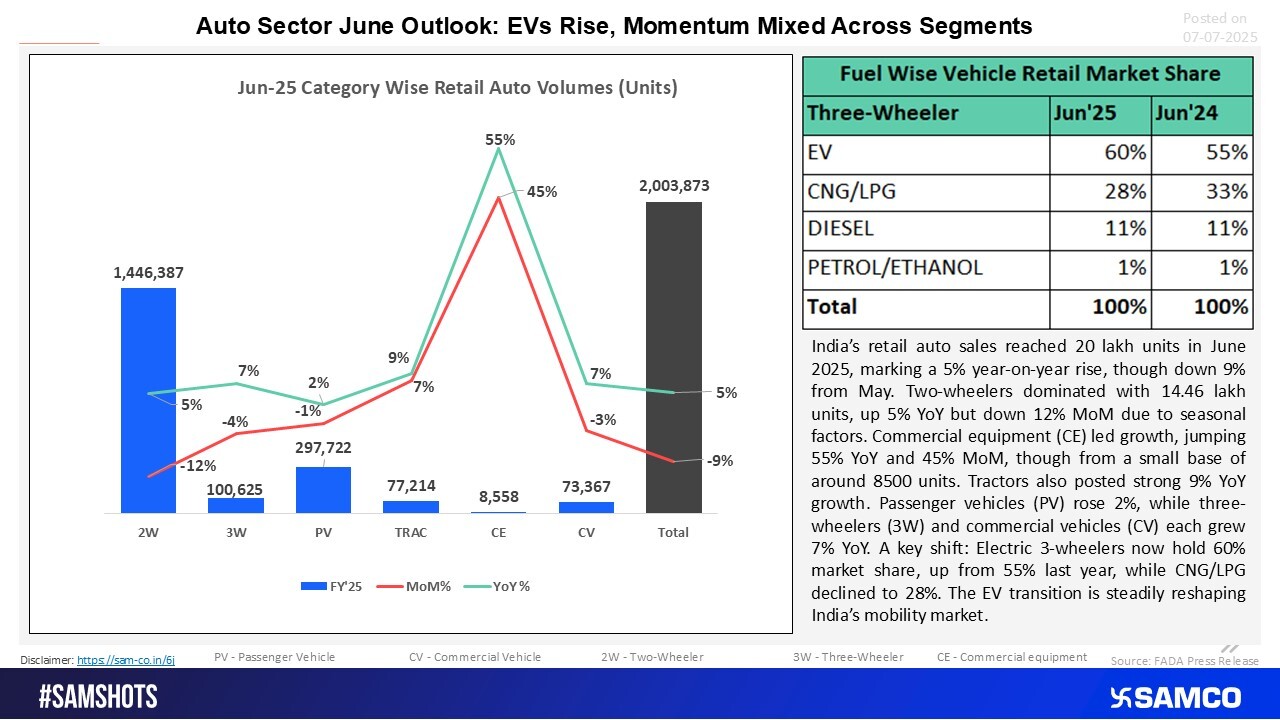
Snapshot of June 2025 auto sales data highlighting segment-wise growth, EV adoption trends
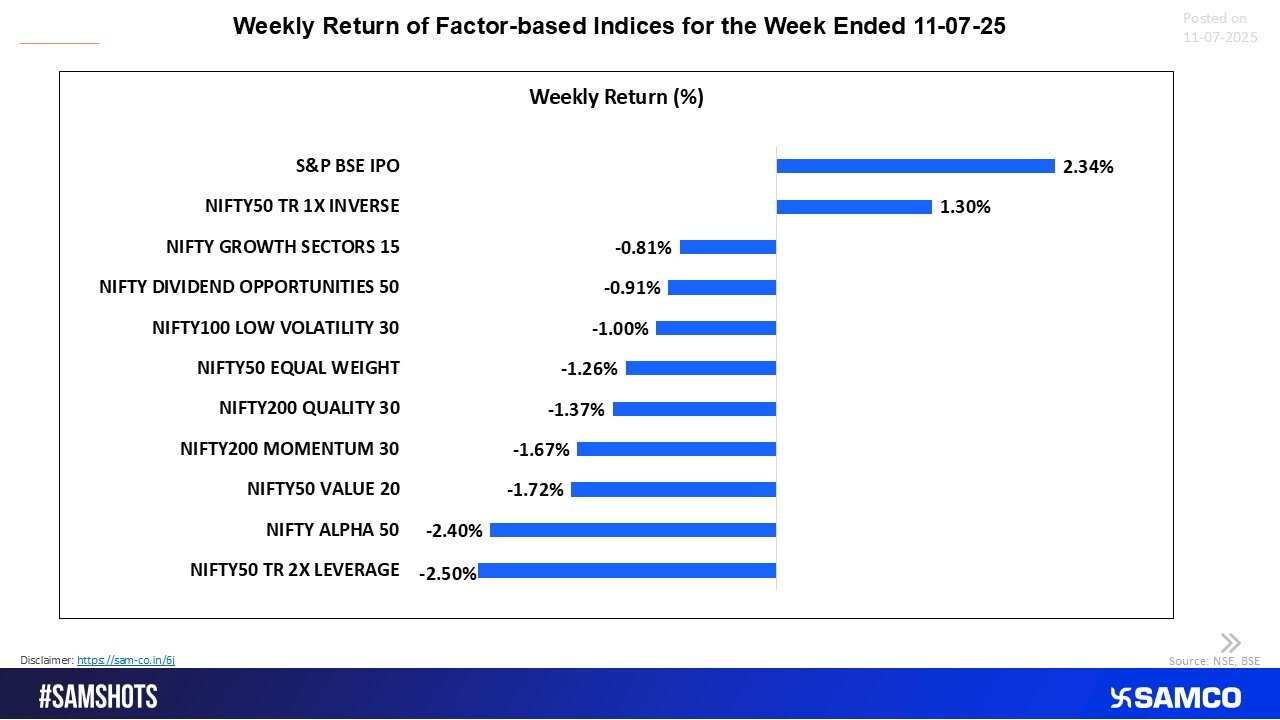
IPO Index Leads as Alpha and Momentum Strategies Face Heat
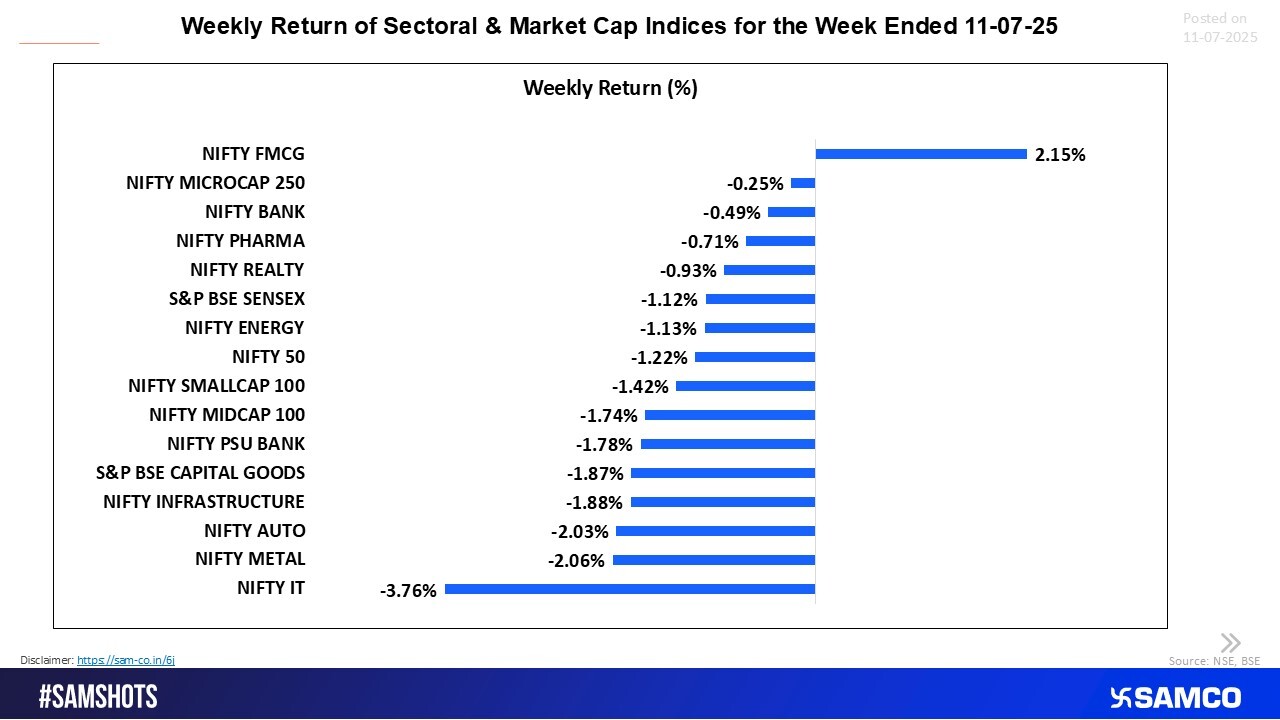
FMCG Shines Amid Broad Market Sell-Off; IT Drags the Most
Trump Pushes Copper in to Space…Silver Will Follow Next
Retail investors are showing growing maturity as steady SIP inflows and rising AUM signal long-term commitment despite market volatility.
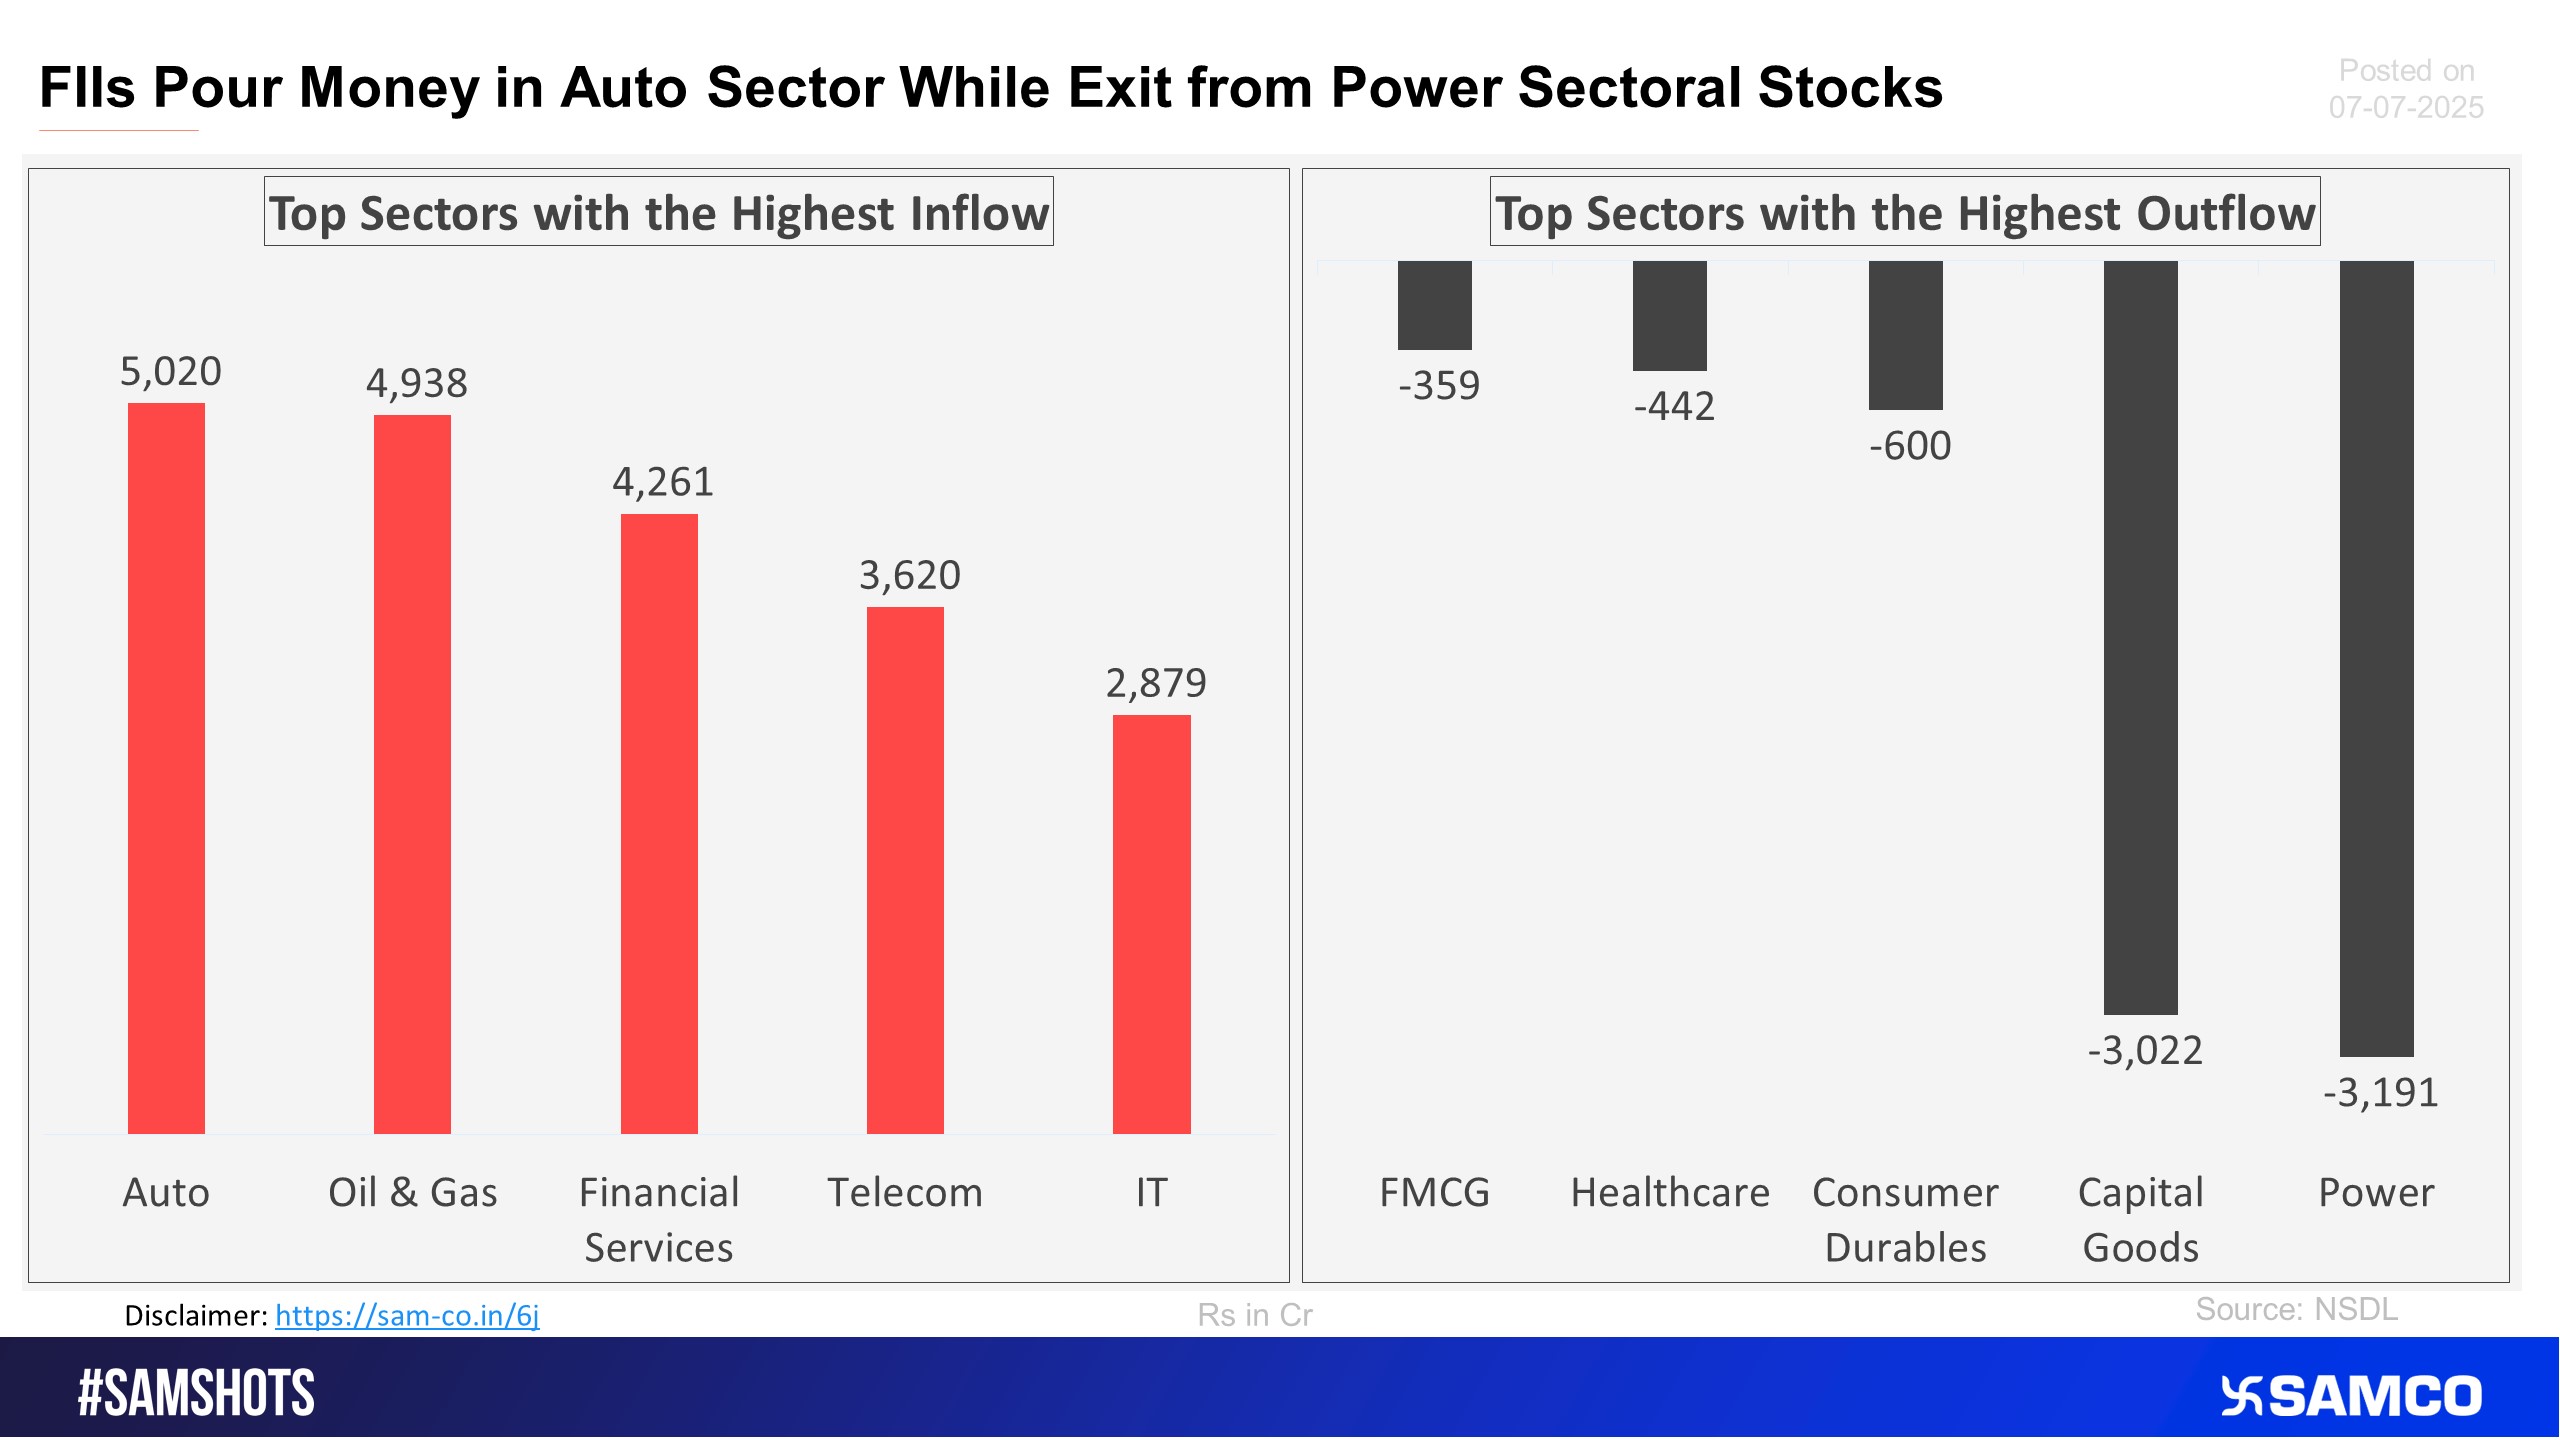
The accompanying chart shows the top 5 sectors that witnessed FPI’s highest inflow and outflow in the latest quarter.
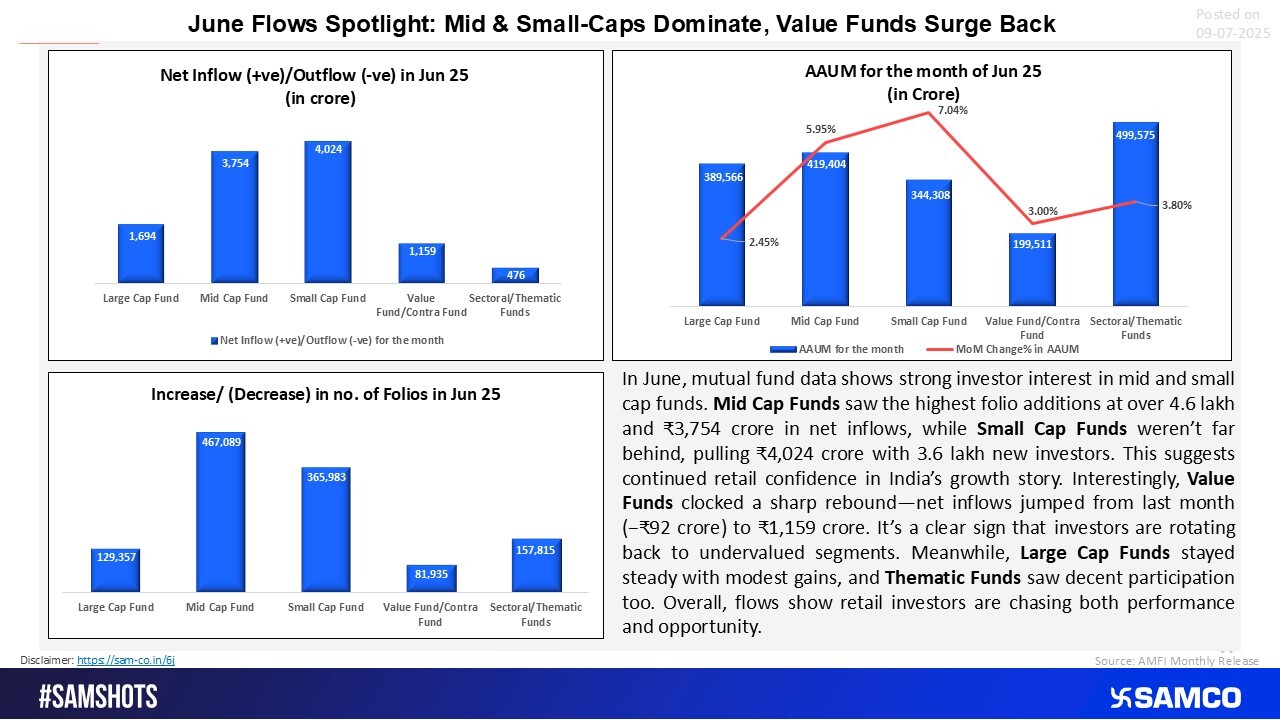
Retail Focus Shifts: Mid–Small Cap and Value Funds Attract Strong Inflows.
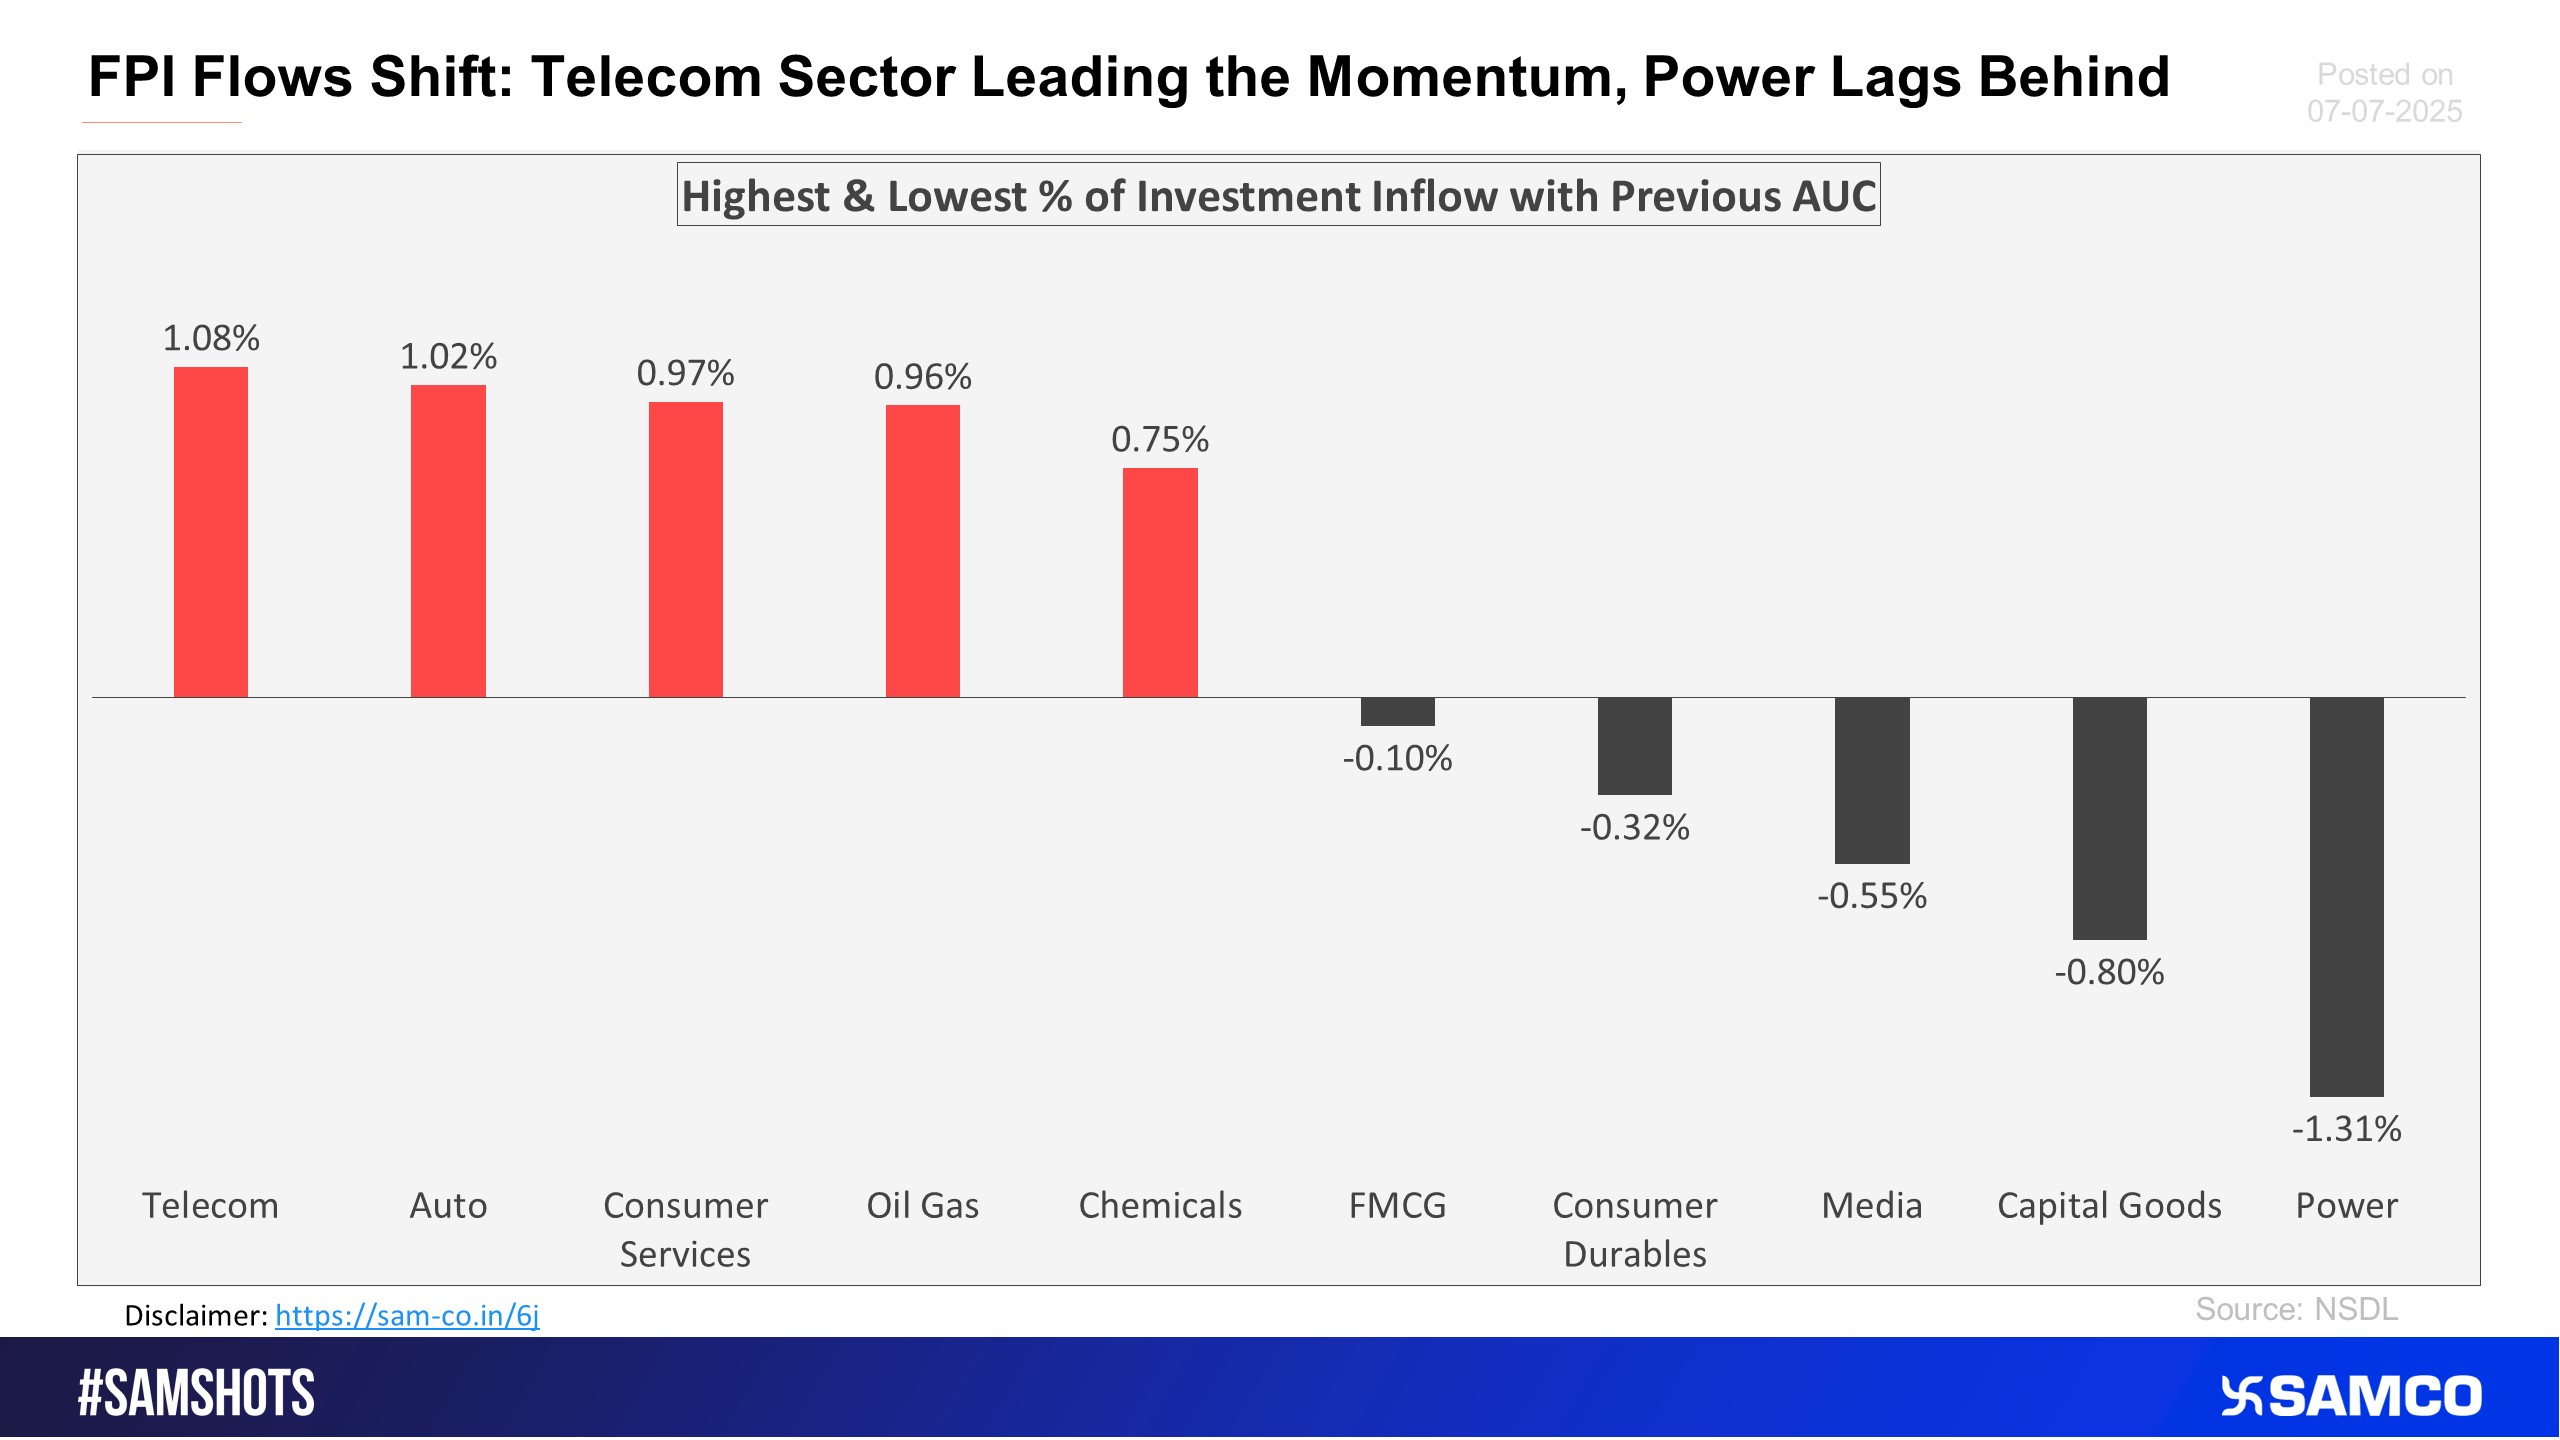
The chart below displays sectors that witnessed the highest and lowest change in the weightage of sectoral FPI holdings to the total FPI holdings compared to the previous fortnight.
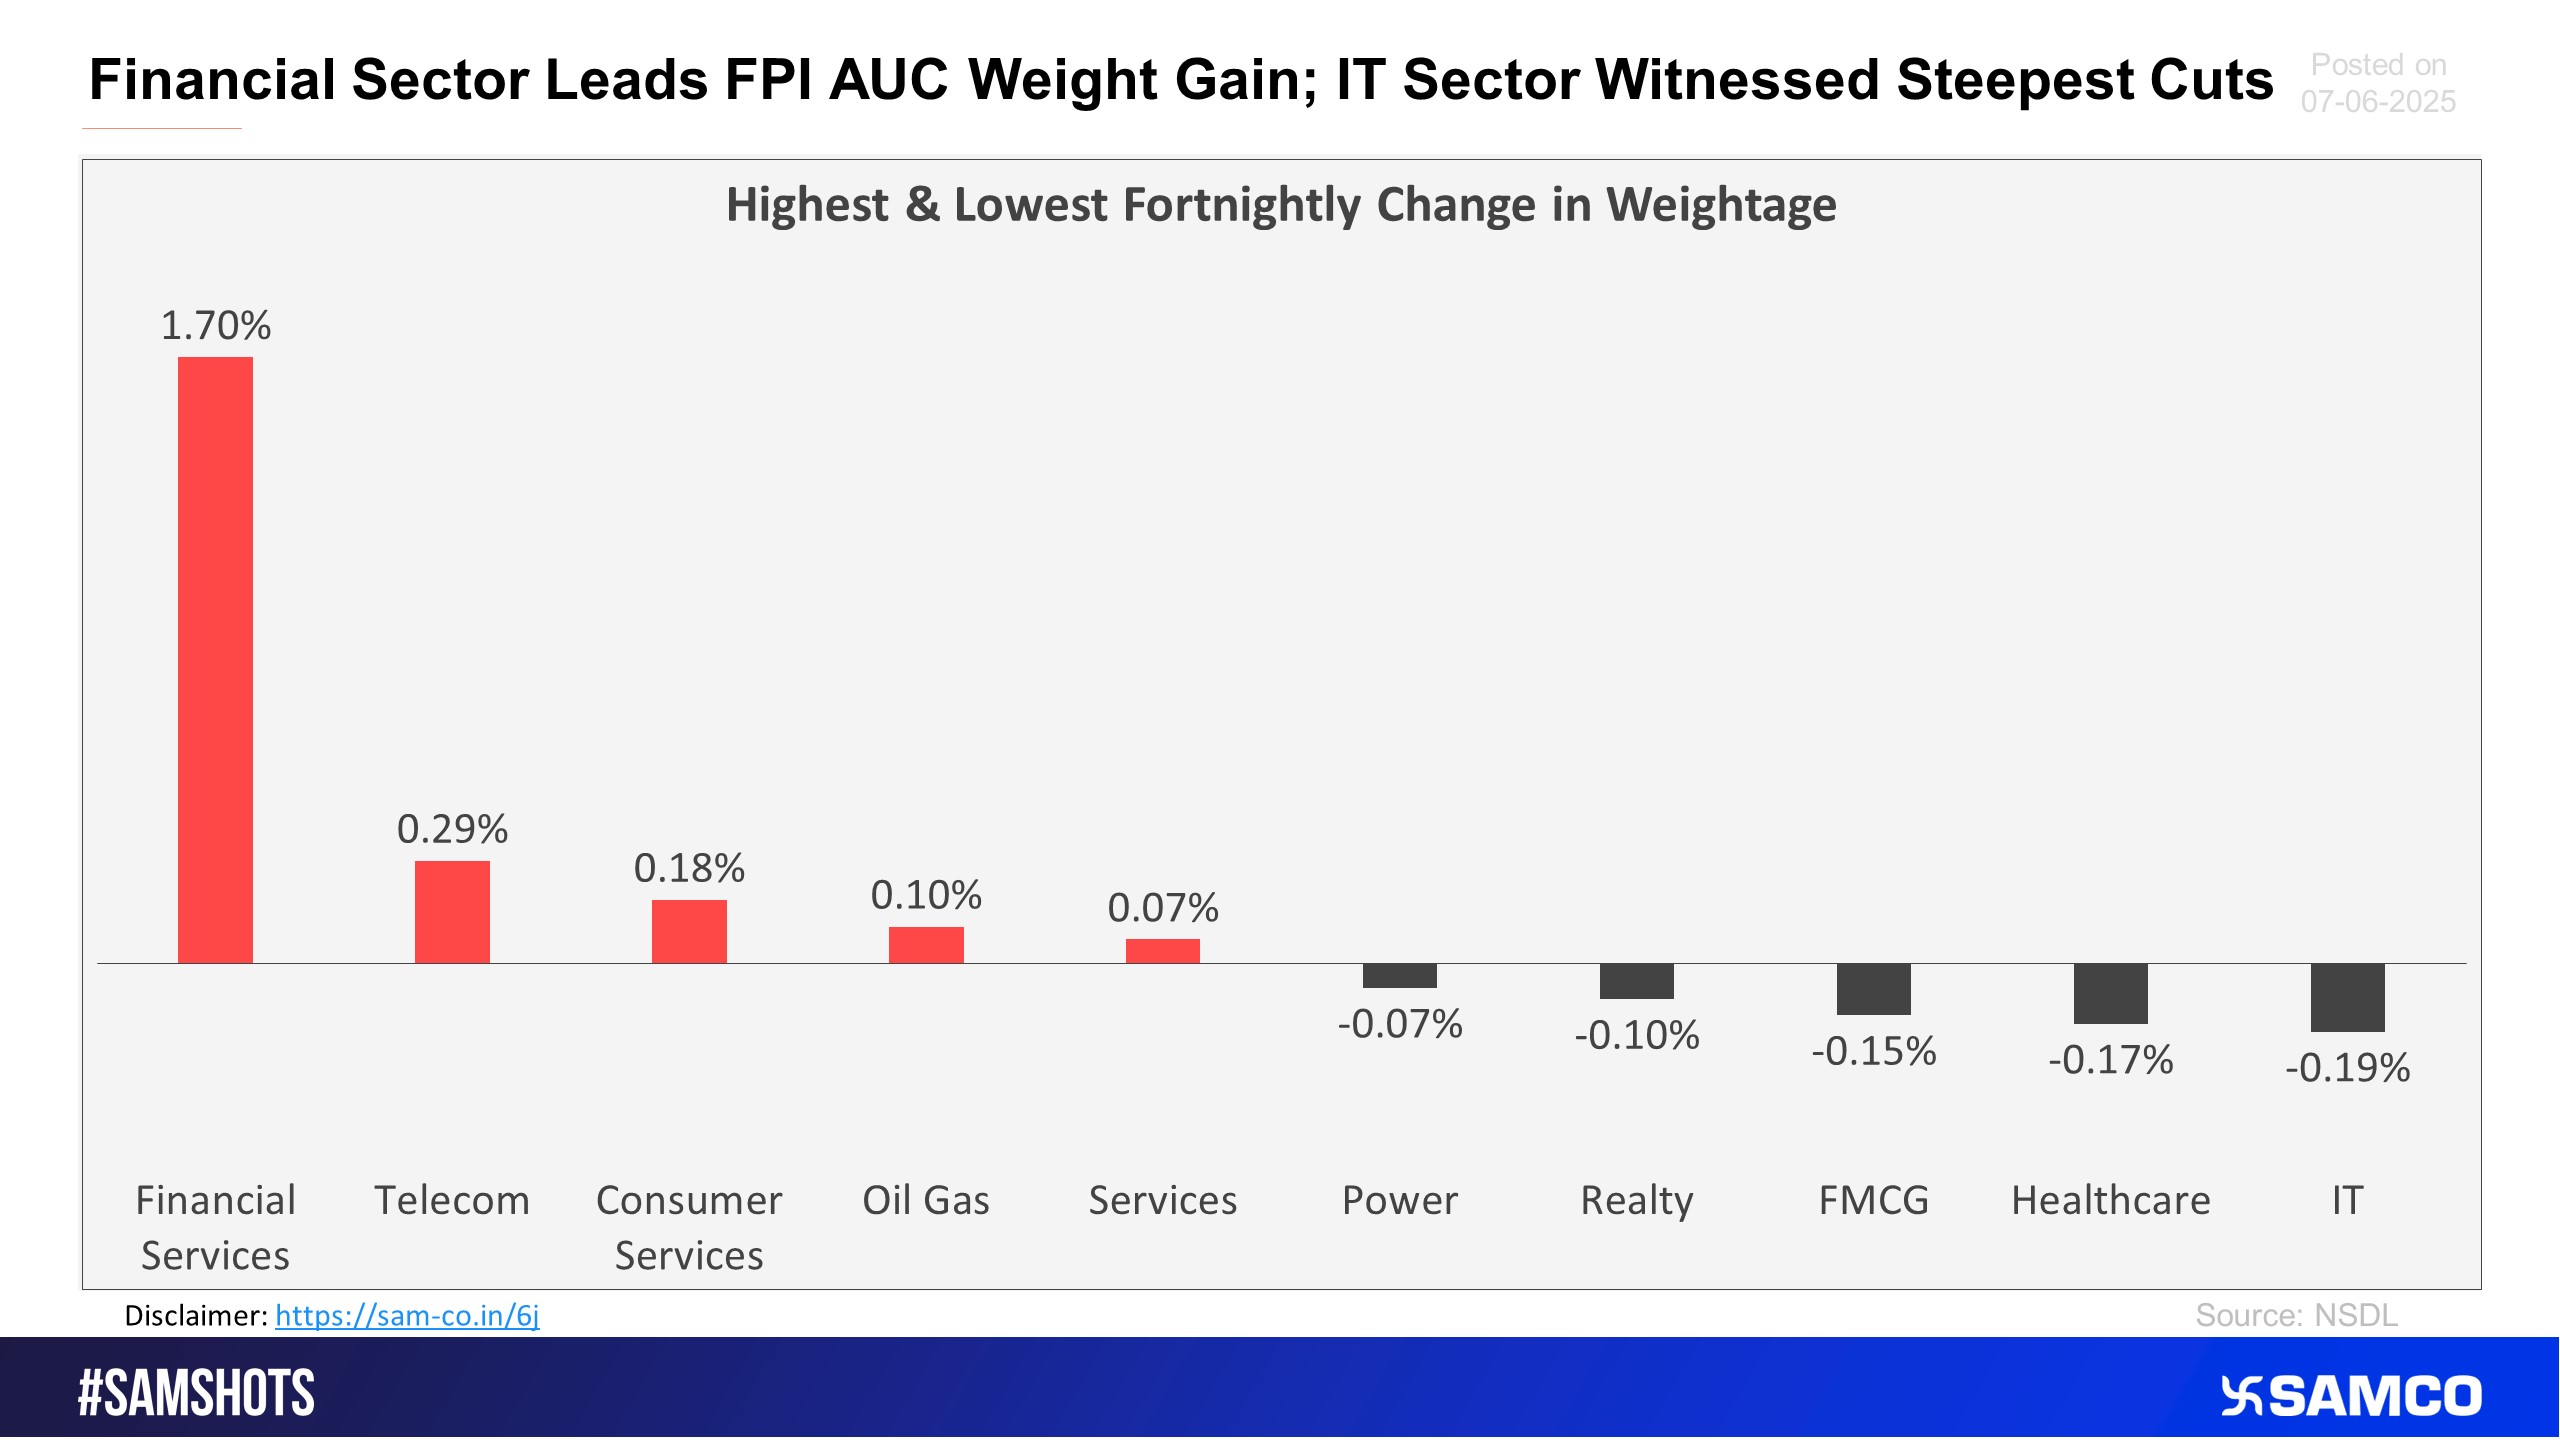
The below chart presents the highest & lowest percentage inflow of investment in the latest fortnight compared to the previous period AUC (Asset Under Custody) of FPI.
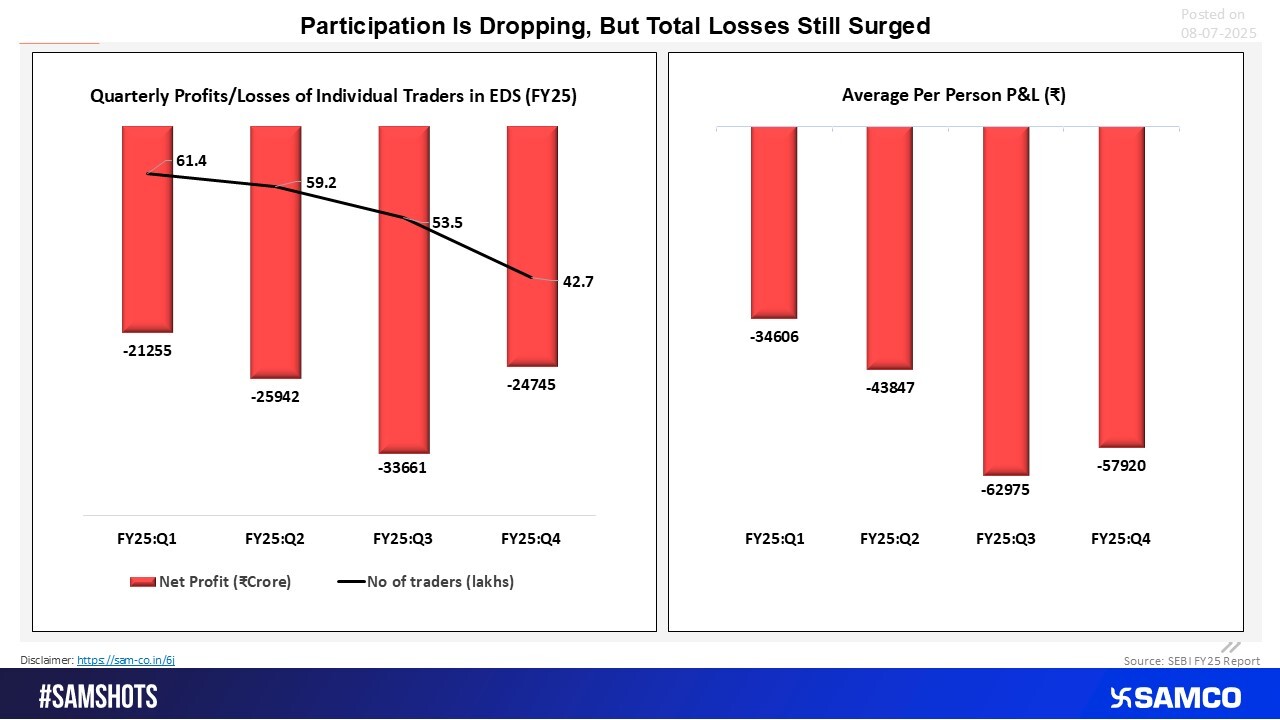
Retail Traders Drop, But Losses Peak in FY25
INDIGO outpaces broader market, sets stage for new highs
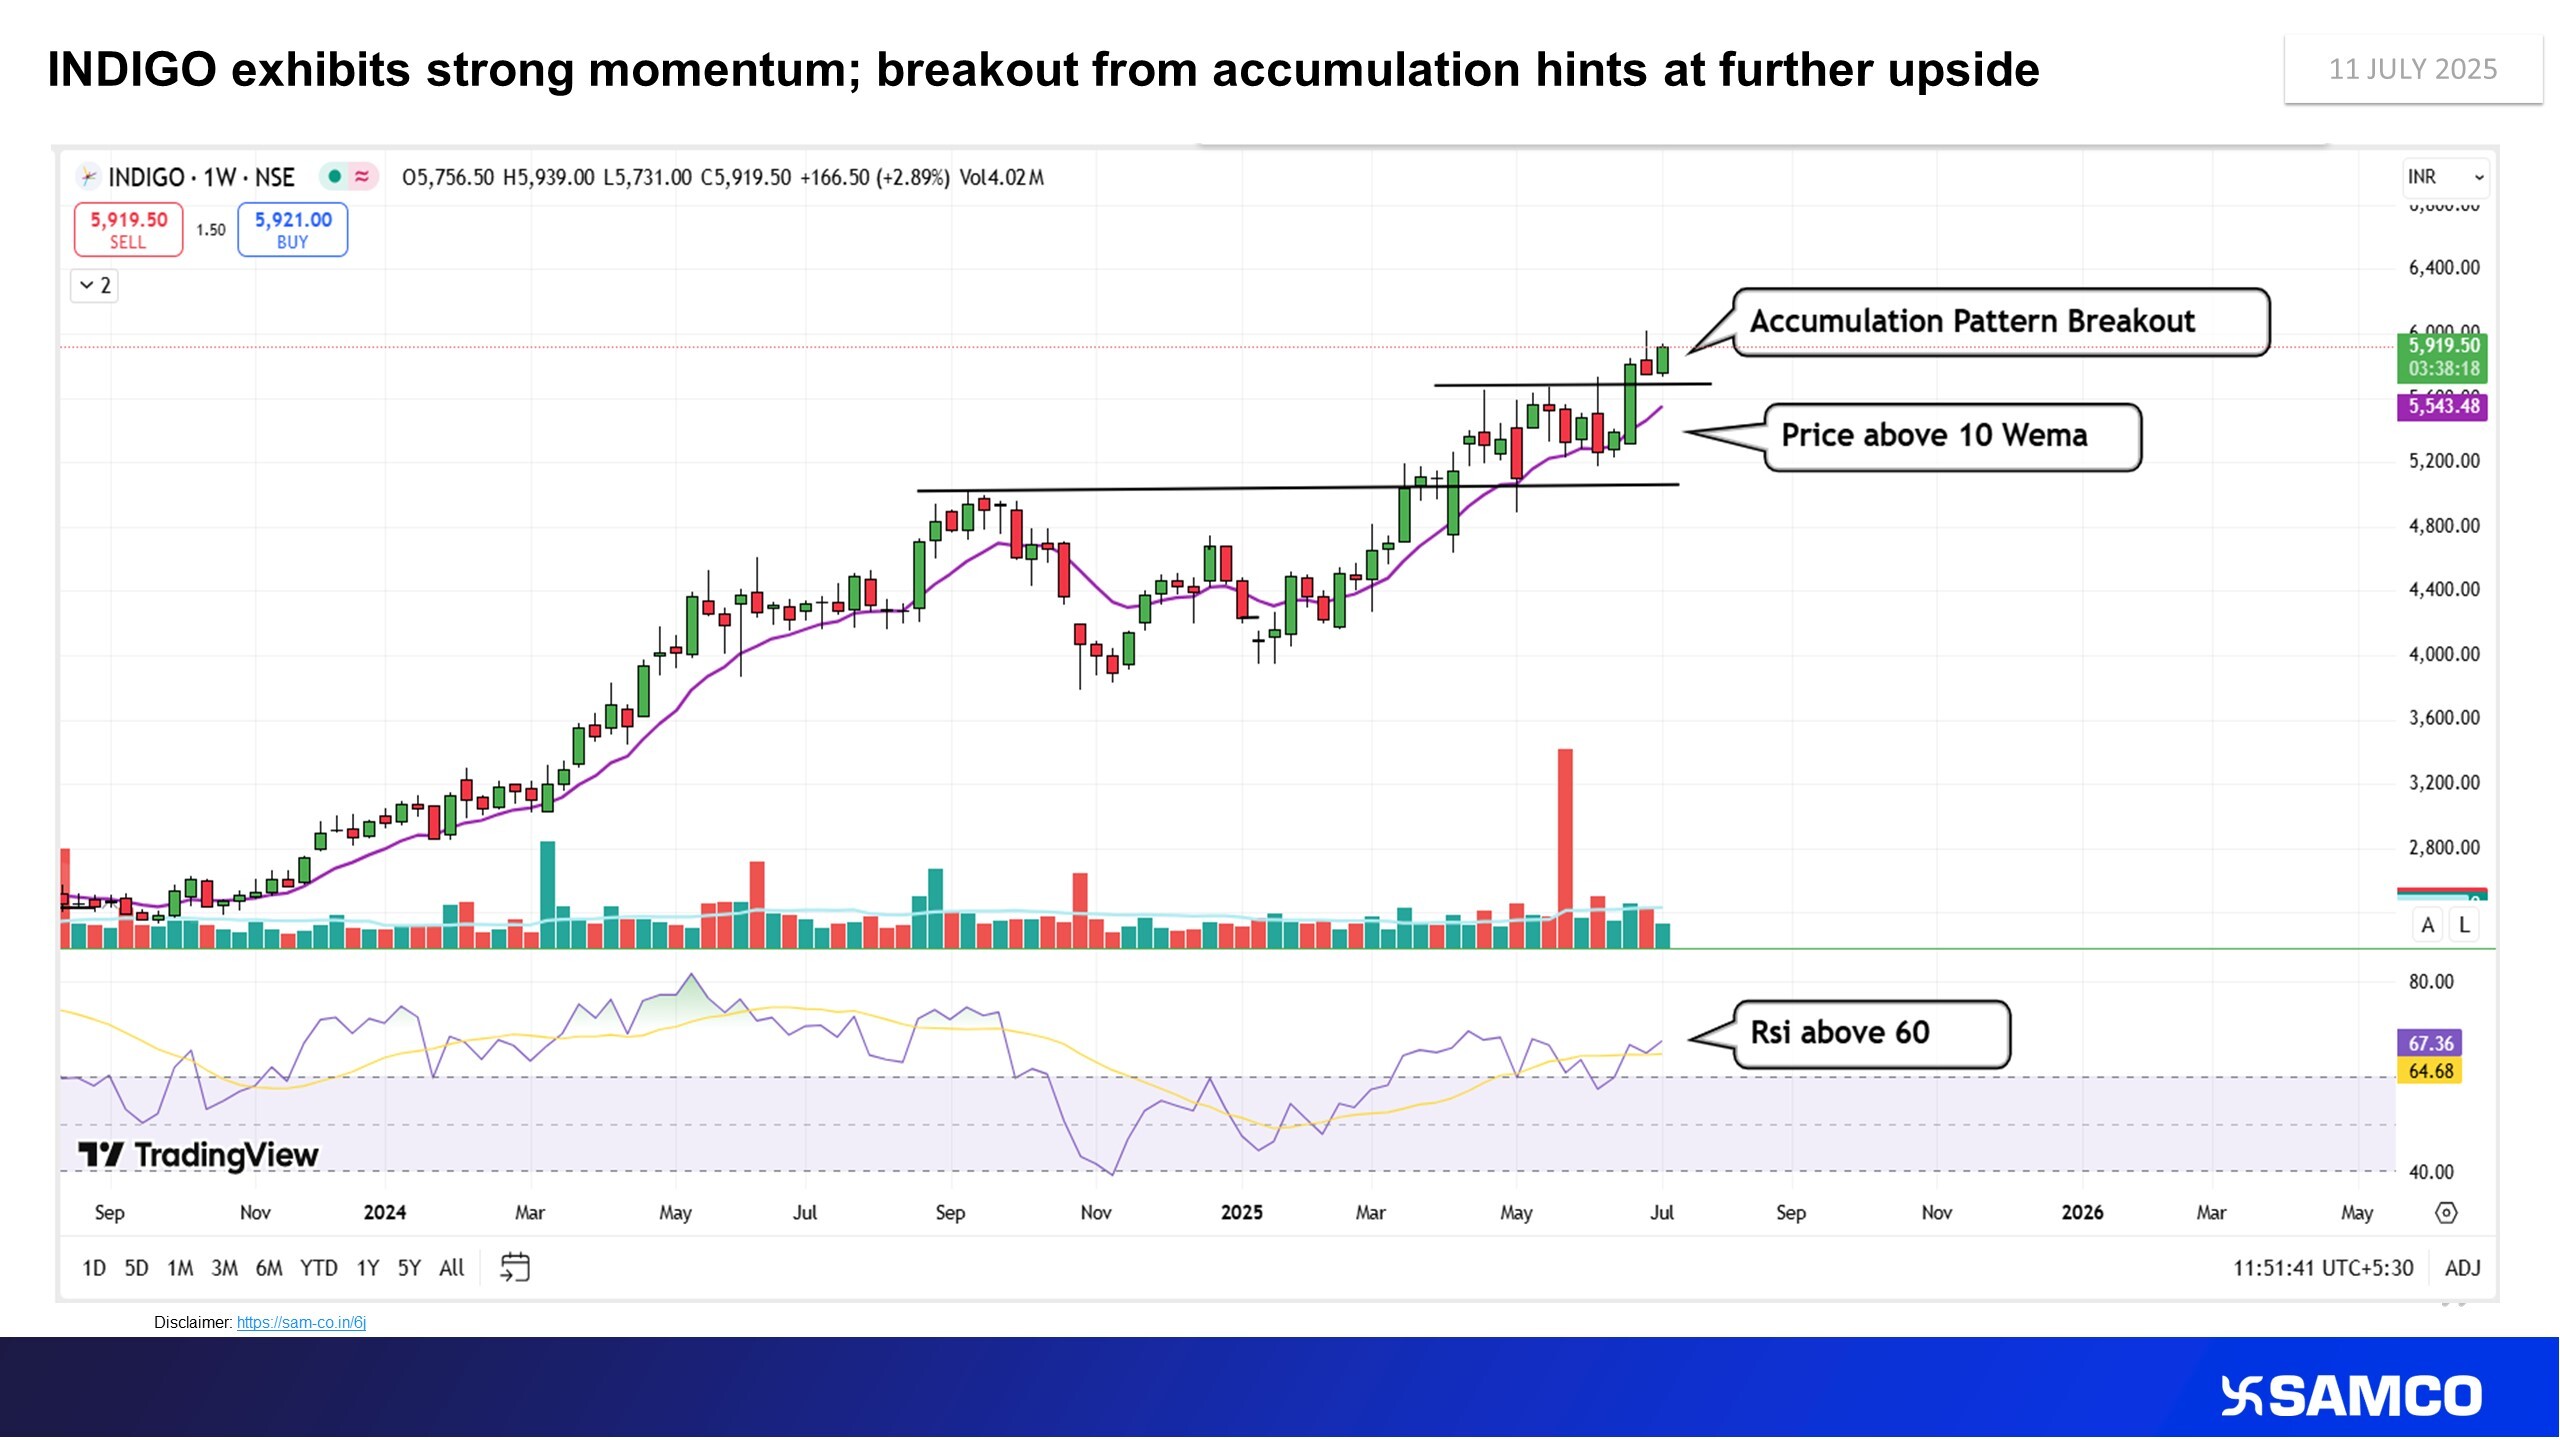
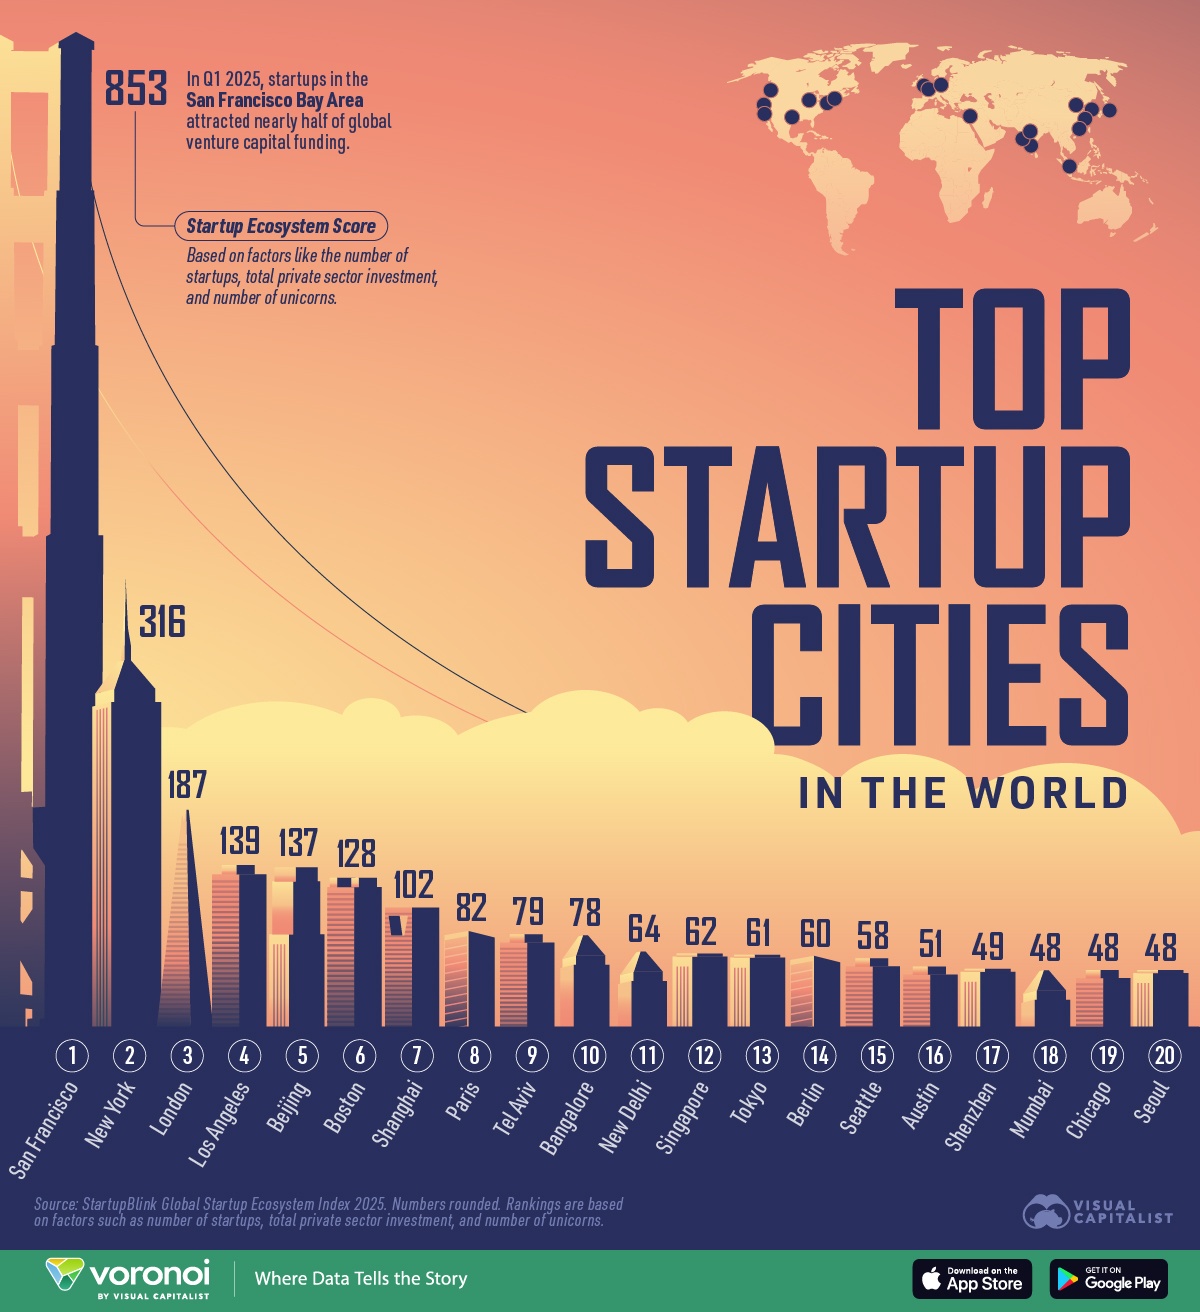
Image Source: @ VisualCap (Twitter)
 Easy & quick
1. Register on SCORES portal
2. Mandatory details for filling complaints on SCORES
Name | PAN | Address | Mobile | Number | E-mail ID
3. Benefits
Effective Communication
Speedy redressal of the grievances
