The market experienced a stormy week, with its robust bull run abruptly halting on Wednesday, 20th December 2023. On this day, benchmark indices recorded their most significant single-session decline in over nine months. Specifically, the Nifty 50, which had soared to an all-time pinnacle of 21,593 points, retreated by 1.4%. Nonetheless, the subsequent two trading days showcased a recovery, as the market rebounded, mitigating some of its previous losses. By week's end, the Nifty 50 registered a modest decline of 0.5%. Notably, this downturn marked the first instance of a weekly decline in the past seven weeks, signifying a noteworthy shift in the recent bullish trajectory.
Scroll down to understand more of such market news and perspectives for the week gone by in easily understandable charts.
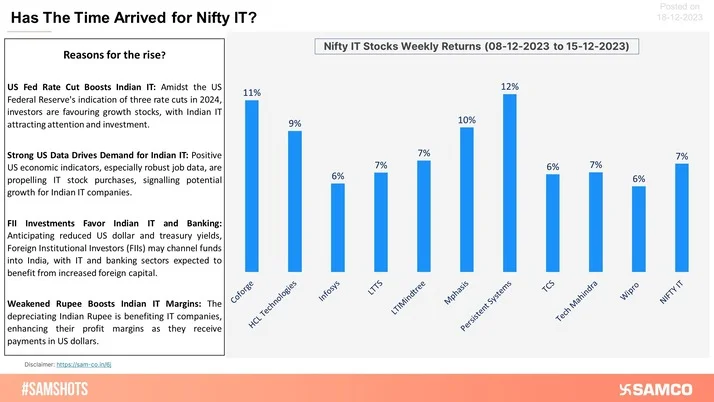
Here's Why NIFTY IT Has The Market's Attention!


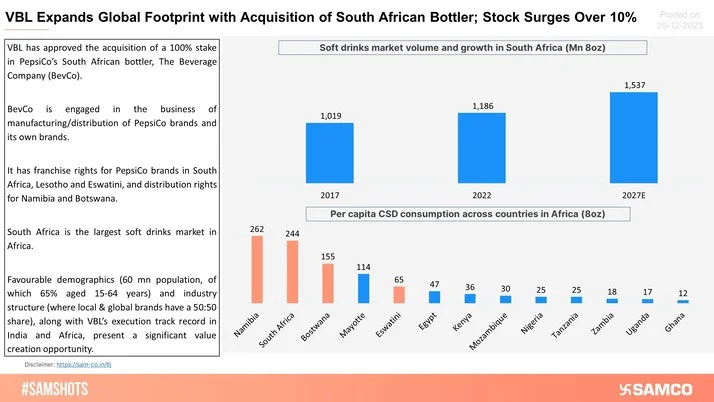
Fizzing Forward: Varun Beverages Pours Into South African Market With Its New Acquisition!
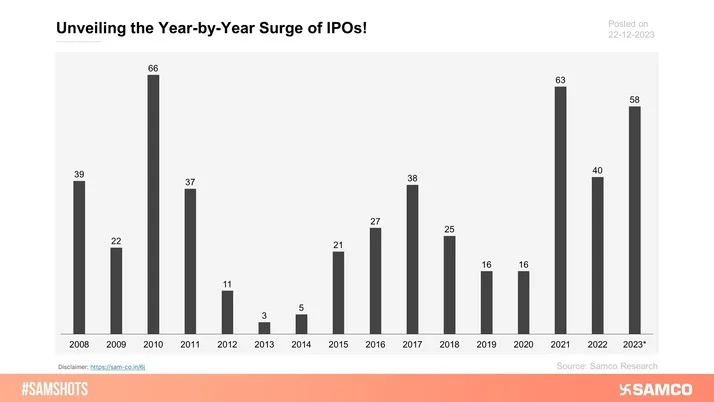
Here’s the number of companies that went public.
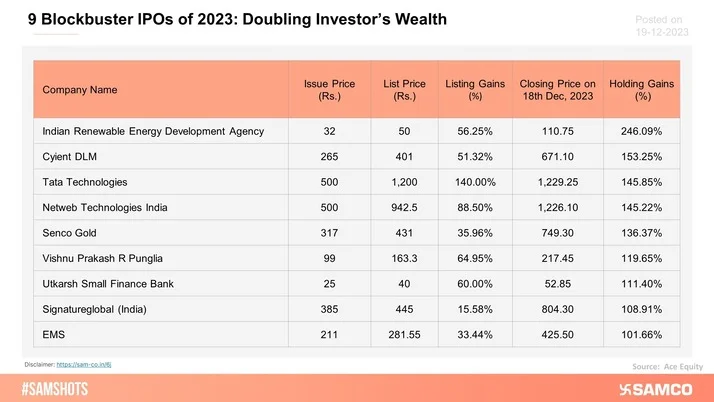
The table below shows a list of 9 IPOs that doubled investors wealth in 2023.
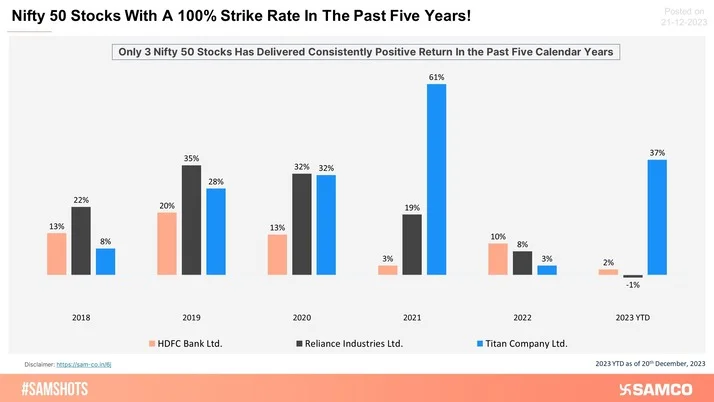
Nifty 50 Stocks Which Has A 100% Strike Rate In the Past Five Years!
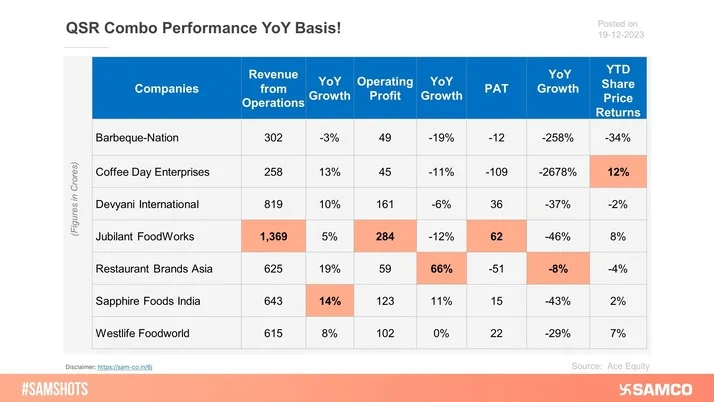
Here’s how Quick Service Restaurants performed on a YoY basis
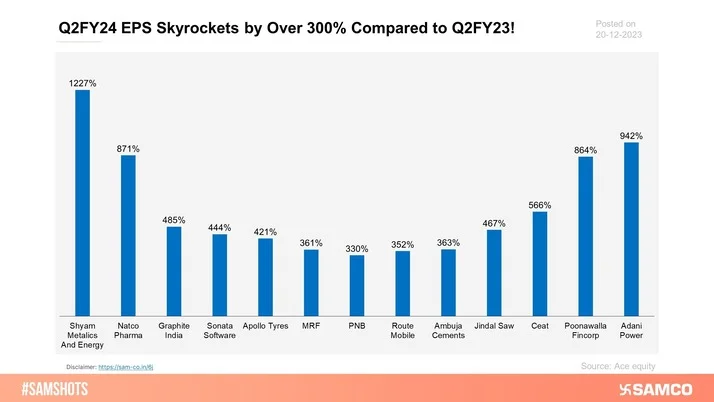
Below chart showcases the list of companies whose EPS zoomed by more than 300%.
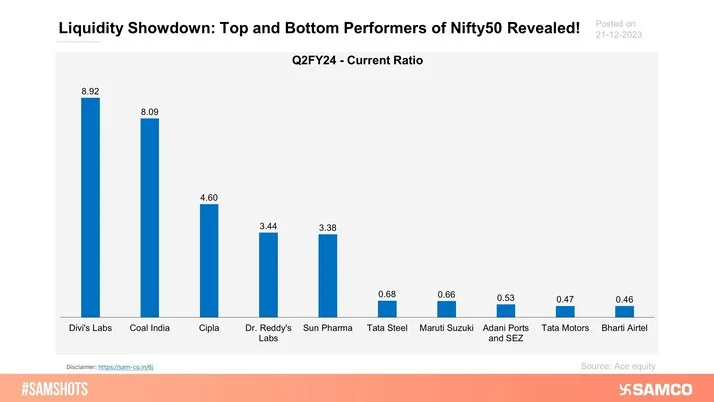
The underlying infographic represents the Nifty50 companies’ liquidity ratio.
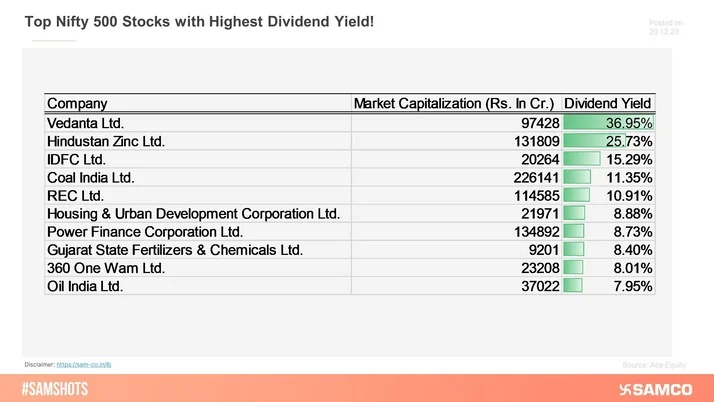
Top Nifty 500 Stocks with Highest Dividend Yield!
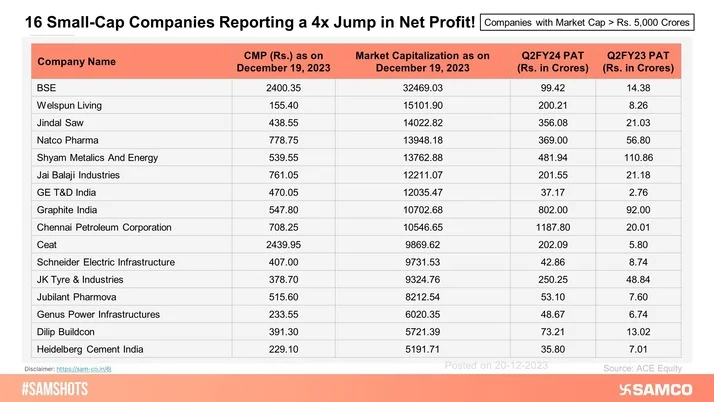
These 16 small-cap companies have reported a minimum 4x jump in PAT during Q2FY24 compared to Q2FY23.
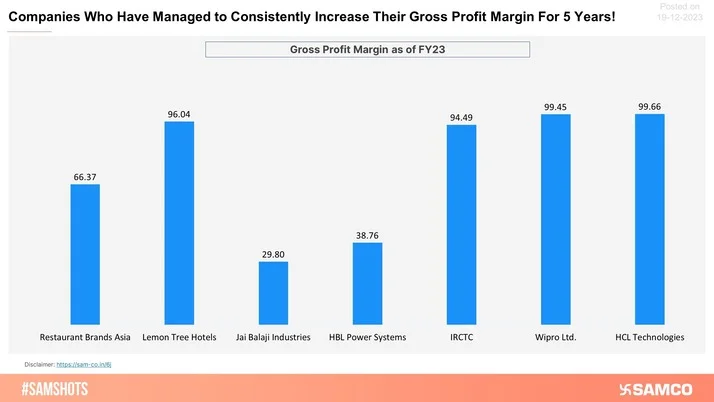
These Companies have Consistently Reported An Increase In Their Gross Profit Margin!
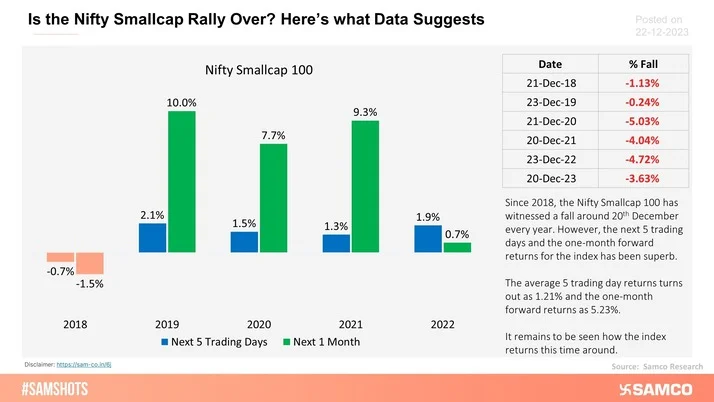
The chart below shows the returns by Nifty Smallcap 100 after a steep 1 day fall around 20th Dec each year.
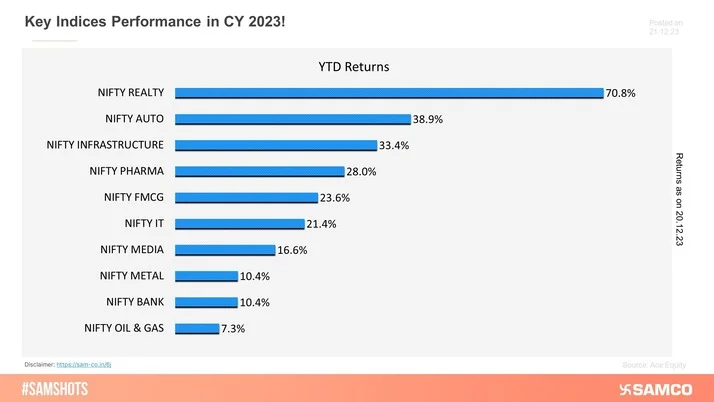
Market Watch 2023: A Look at Key Indices Performance!
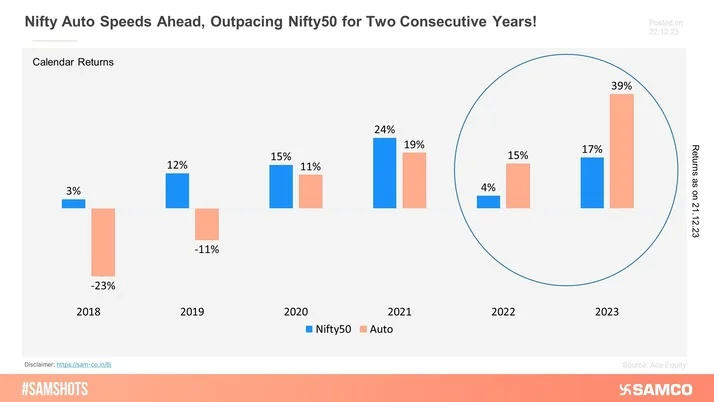
Nifty Auto's Double Victory!

Nifty 50 enjoyed a seven-week winning streak until the last week where it ended the week on a negative note.
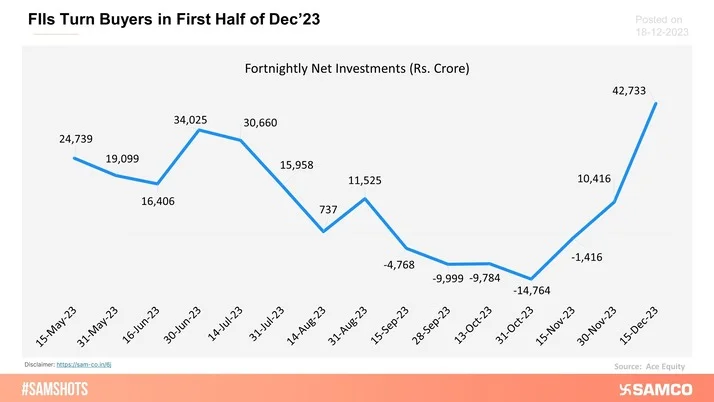
Foreign Institutional Investors (FIIs) turned net buyers to the tune of more than 40,000 crores in the first half of December 23.
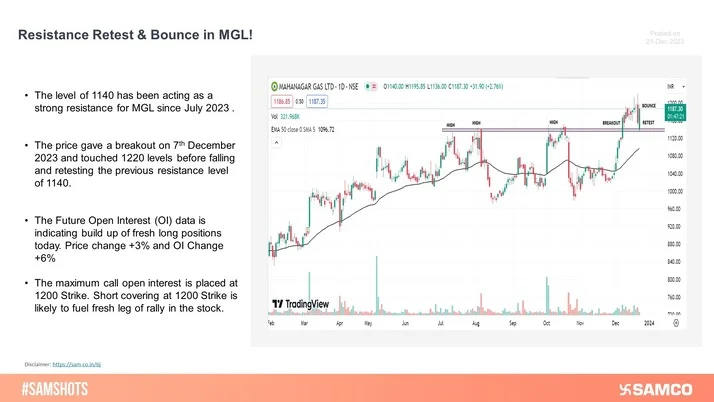
MGL retested the previous resistance level of 1140 on the daily chart and gave a bounce with the Future Open Interest indicating Long Buildup
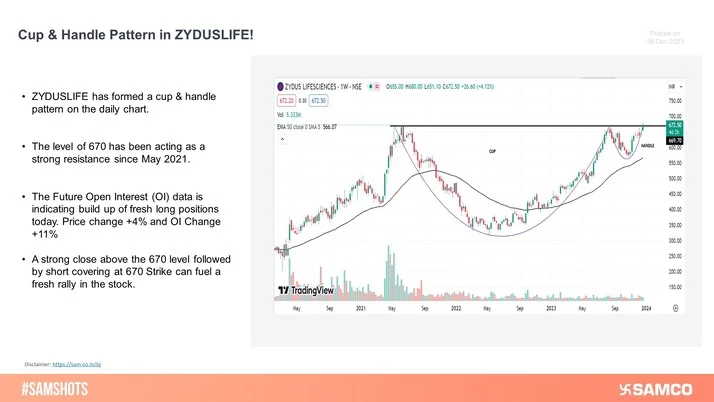
A cup & handle pattern is visible on the daily chart of ZYDUSLIFE. A strong close above 670 followed by short covering at 670 Strike is likely to fuel a fresh rally in the stock.
NESTLEIND has formed a breakout and retest structure on the daily chart. The sharp rise in the price was supported by a spike in volumes.

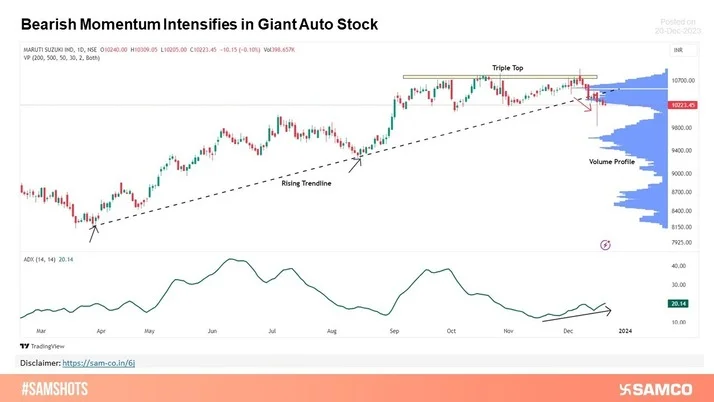
Bearish Momentum Intensifies in Giant Auto Stock
Nifty Journey Unravelled with Fibonacci Lines and Moon Cycle
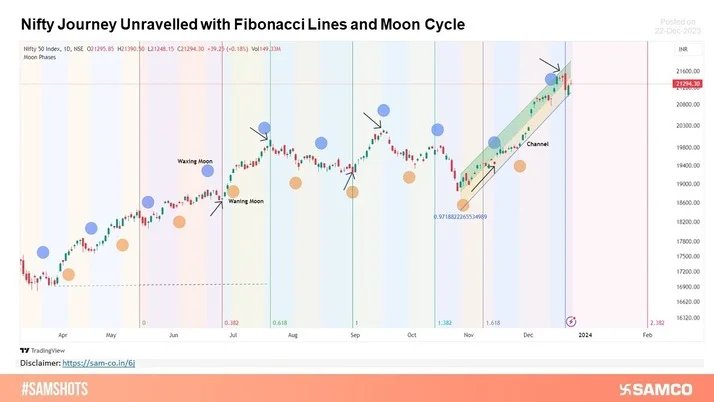
Image Source: Statista


 Easy & quick
1. Register on SCORES portal
2. Mandatory details for filling complaints on SCORES
Name | PAN | Address | Mobile | Number | E-mail ID
3. Benefits
Effective Communication
Speedy redressal of the grievances
