Equity markets witnessed mild turbulence during the week, largely driven by mixed corporate earnings and global sentiment. The benchmark Nifty 50 declined for the fourth consecutive week, closing lower by 0.53%. Investor sentiment remained cautious as several frontline companies underperformed relative to street expectations during the ongoing result season.
Sectoral performance was uneven, with Nifty Realty leading the laggards, dropping 4.93% amid weak guidance and demand-side pressures. On the other hand, Nifty Bank and Nifty Pharma provided some support to the broader market, Nifty bank ended the week in the green with gains of 0.44%.
Global cues remained neutral despite the announcement of the India–UK Free Trade Agreement on July 24, 2025, aimed at enhancing bilateral trade and investment flows. While long-term implications of the FTA are positive, near-term market sentiment remains tied to earnings surprises and sector-specific developments.
Scroll down to understand more of such market news and perspectives for the week gone by in easily understandable charts.
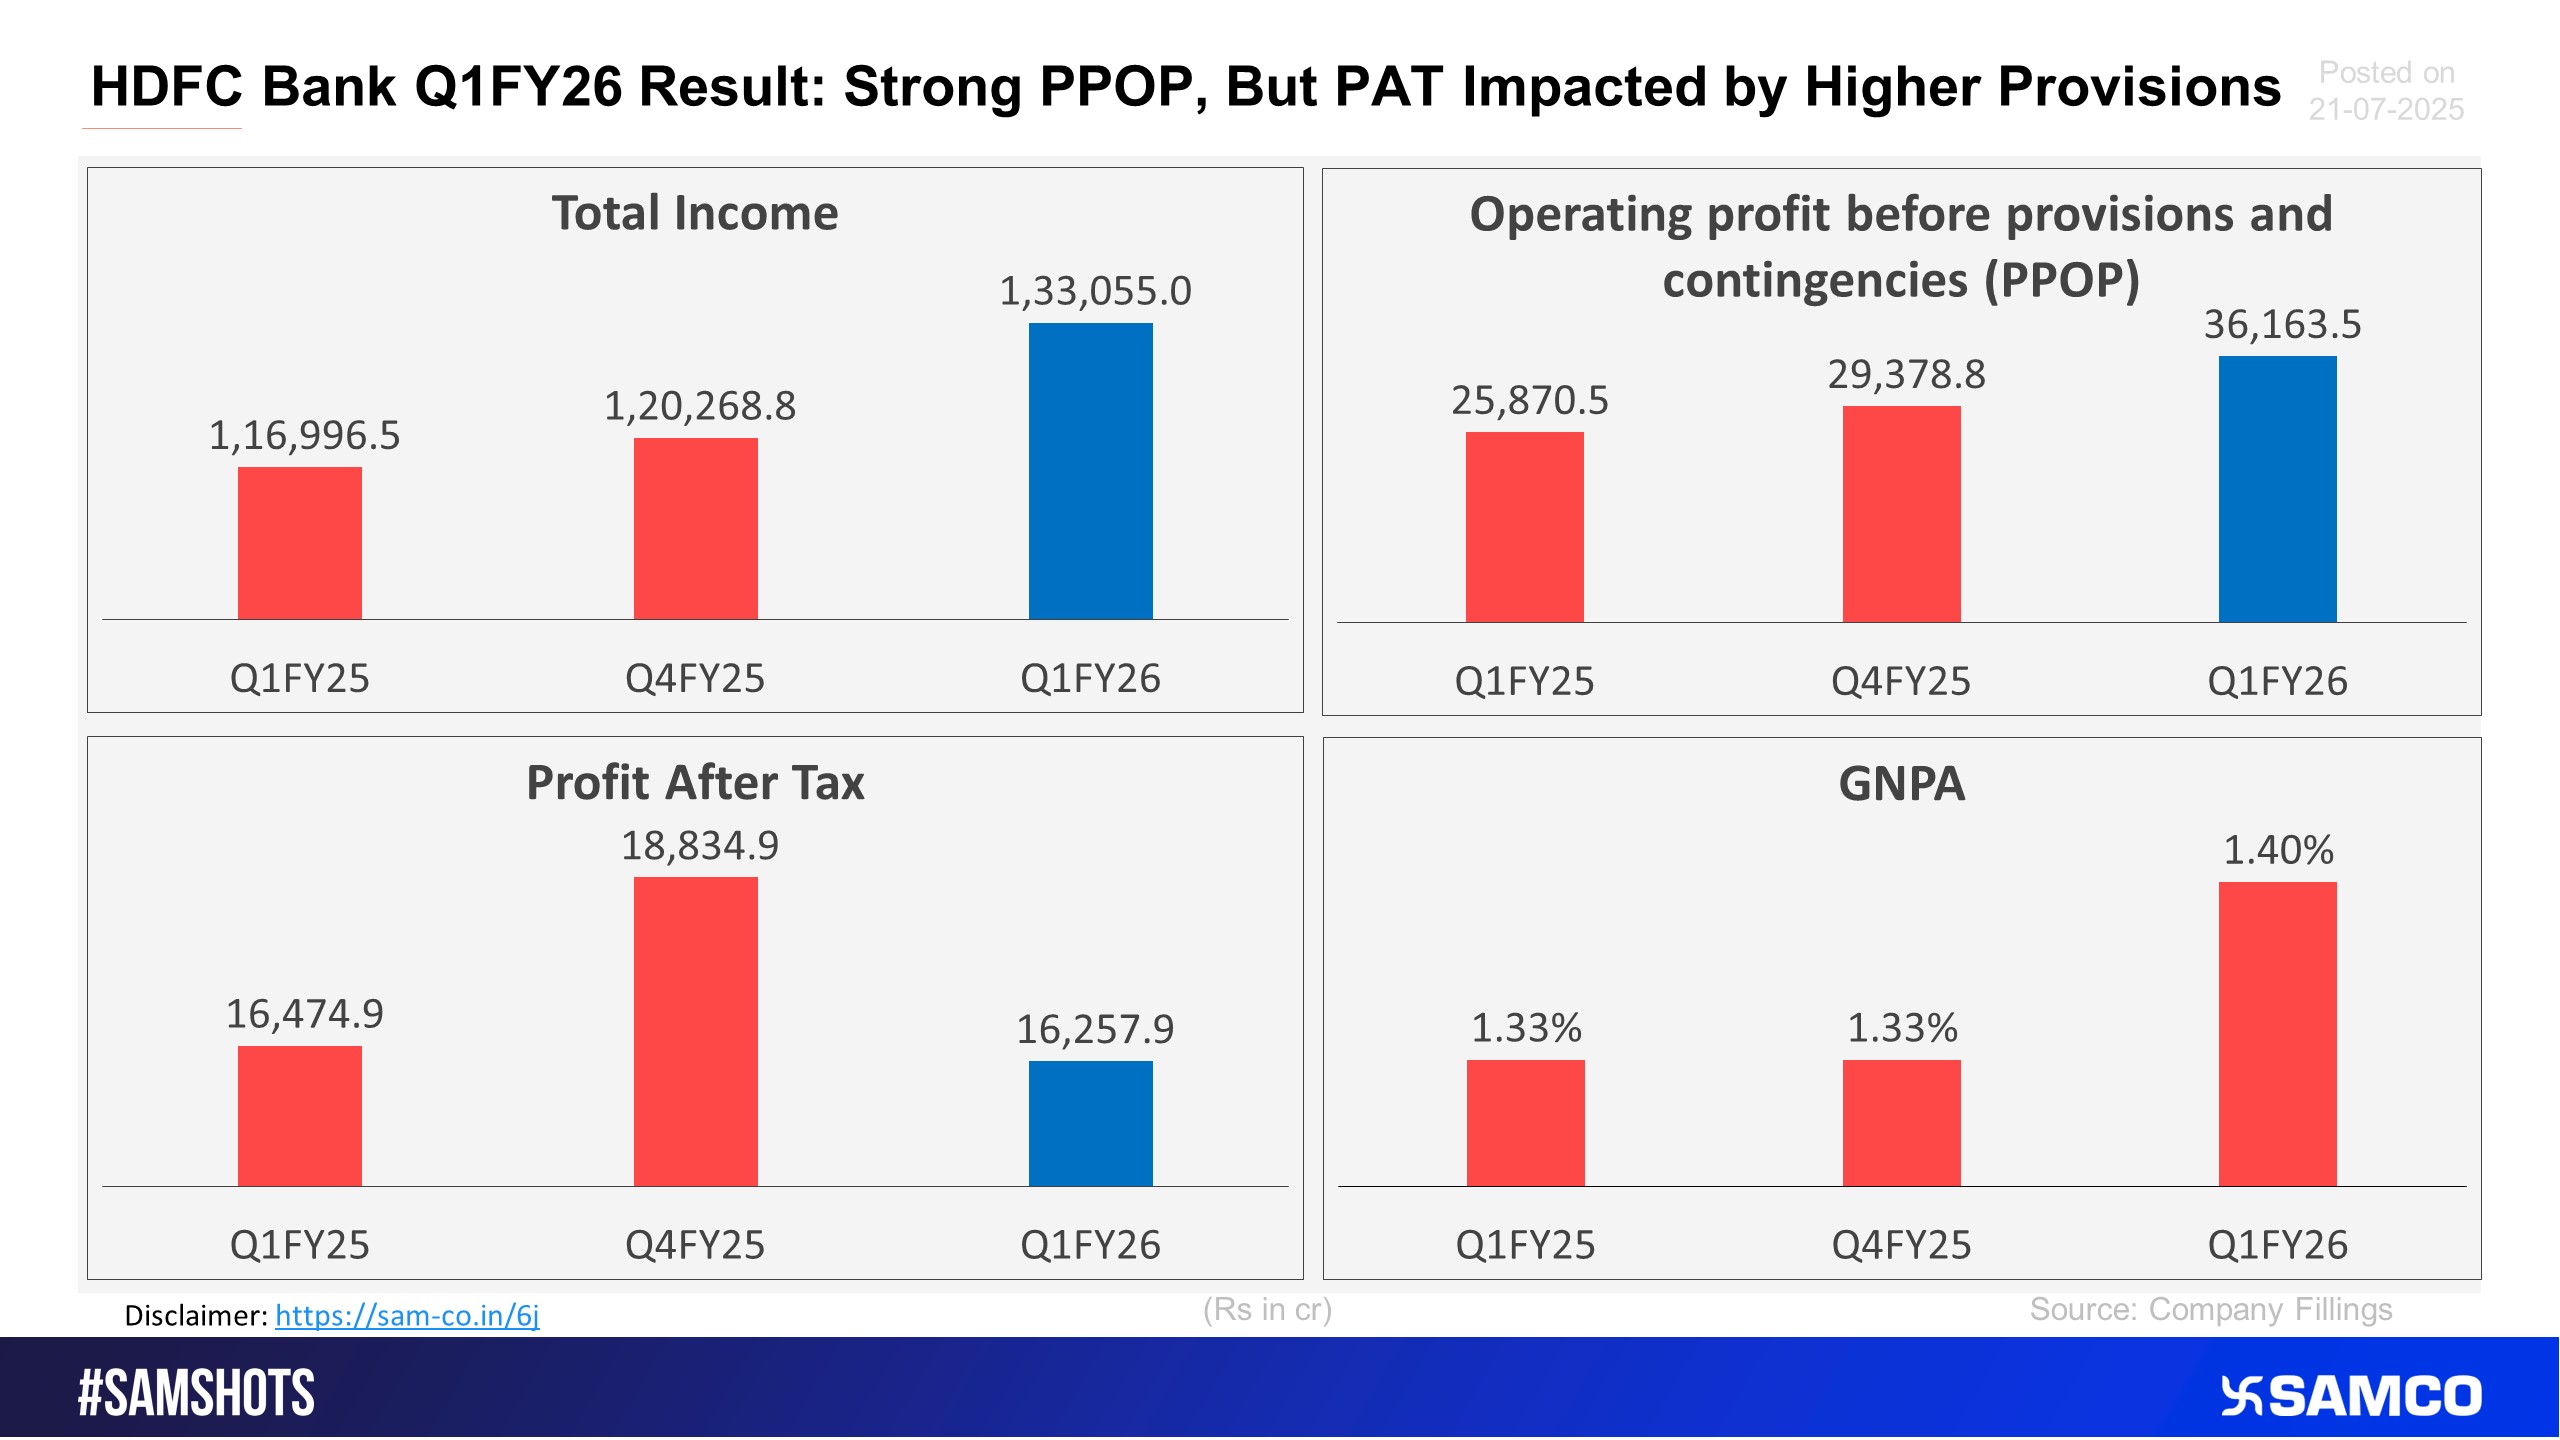
Here’s how HDFC Bank performed in Q1FY26.


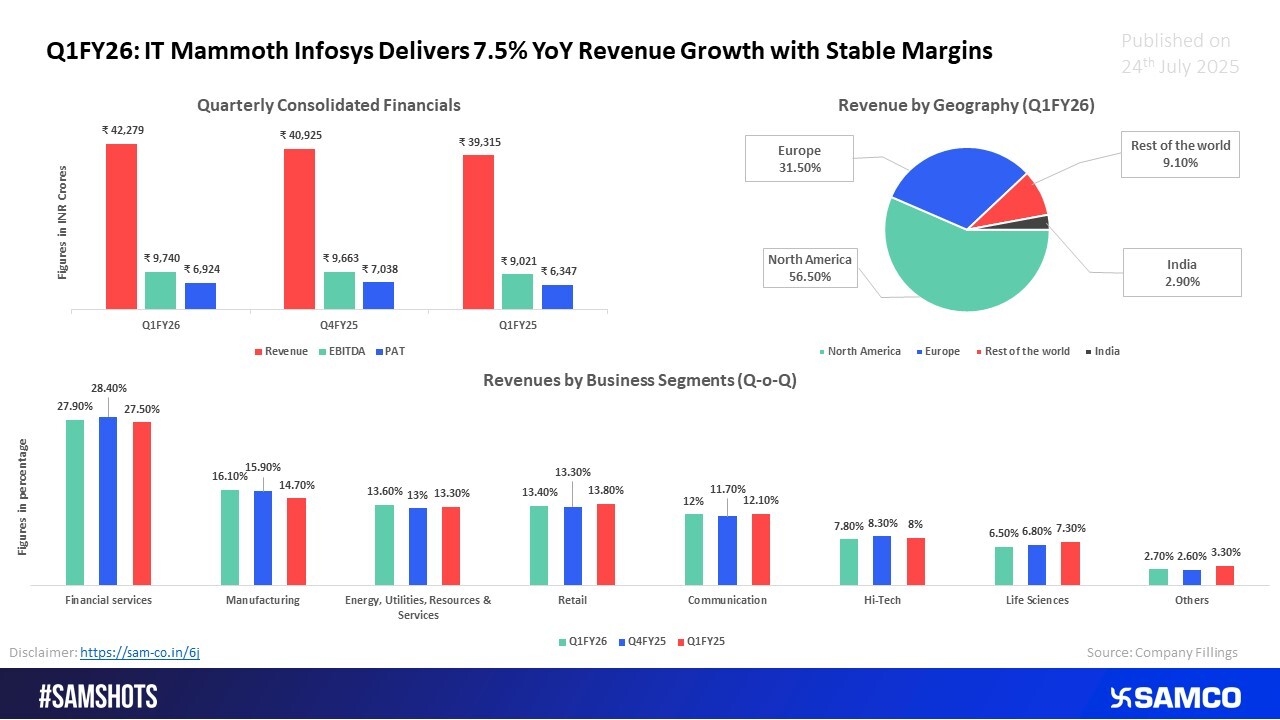
Infosys Delivers Steady Growth with Robust Deals and Stable Margins
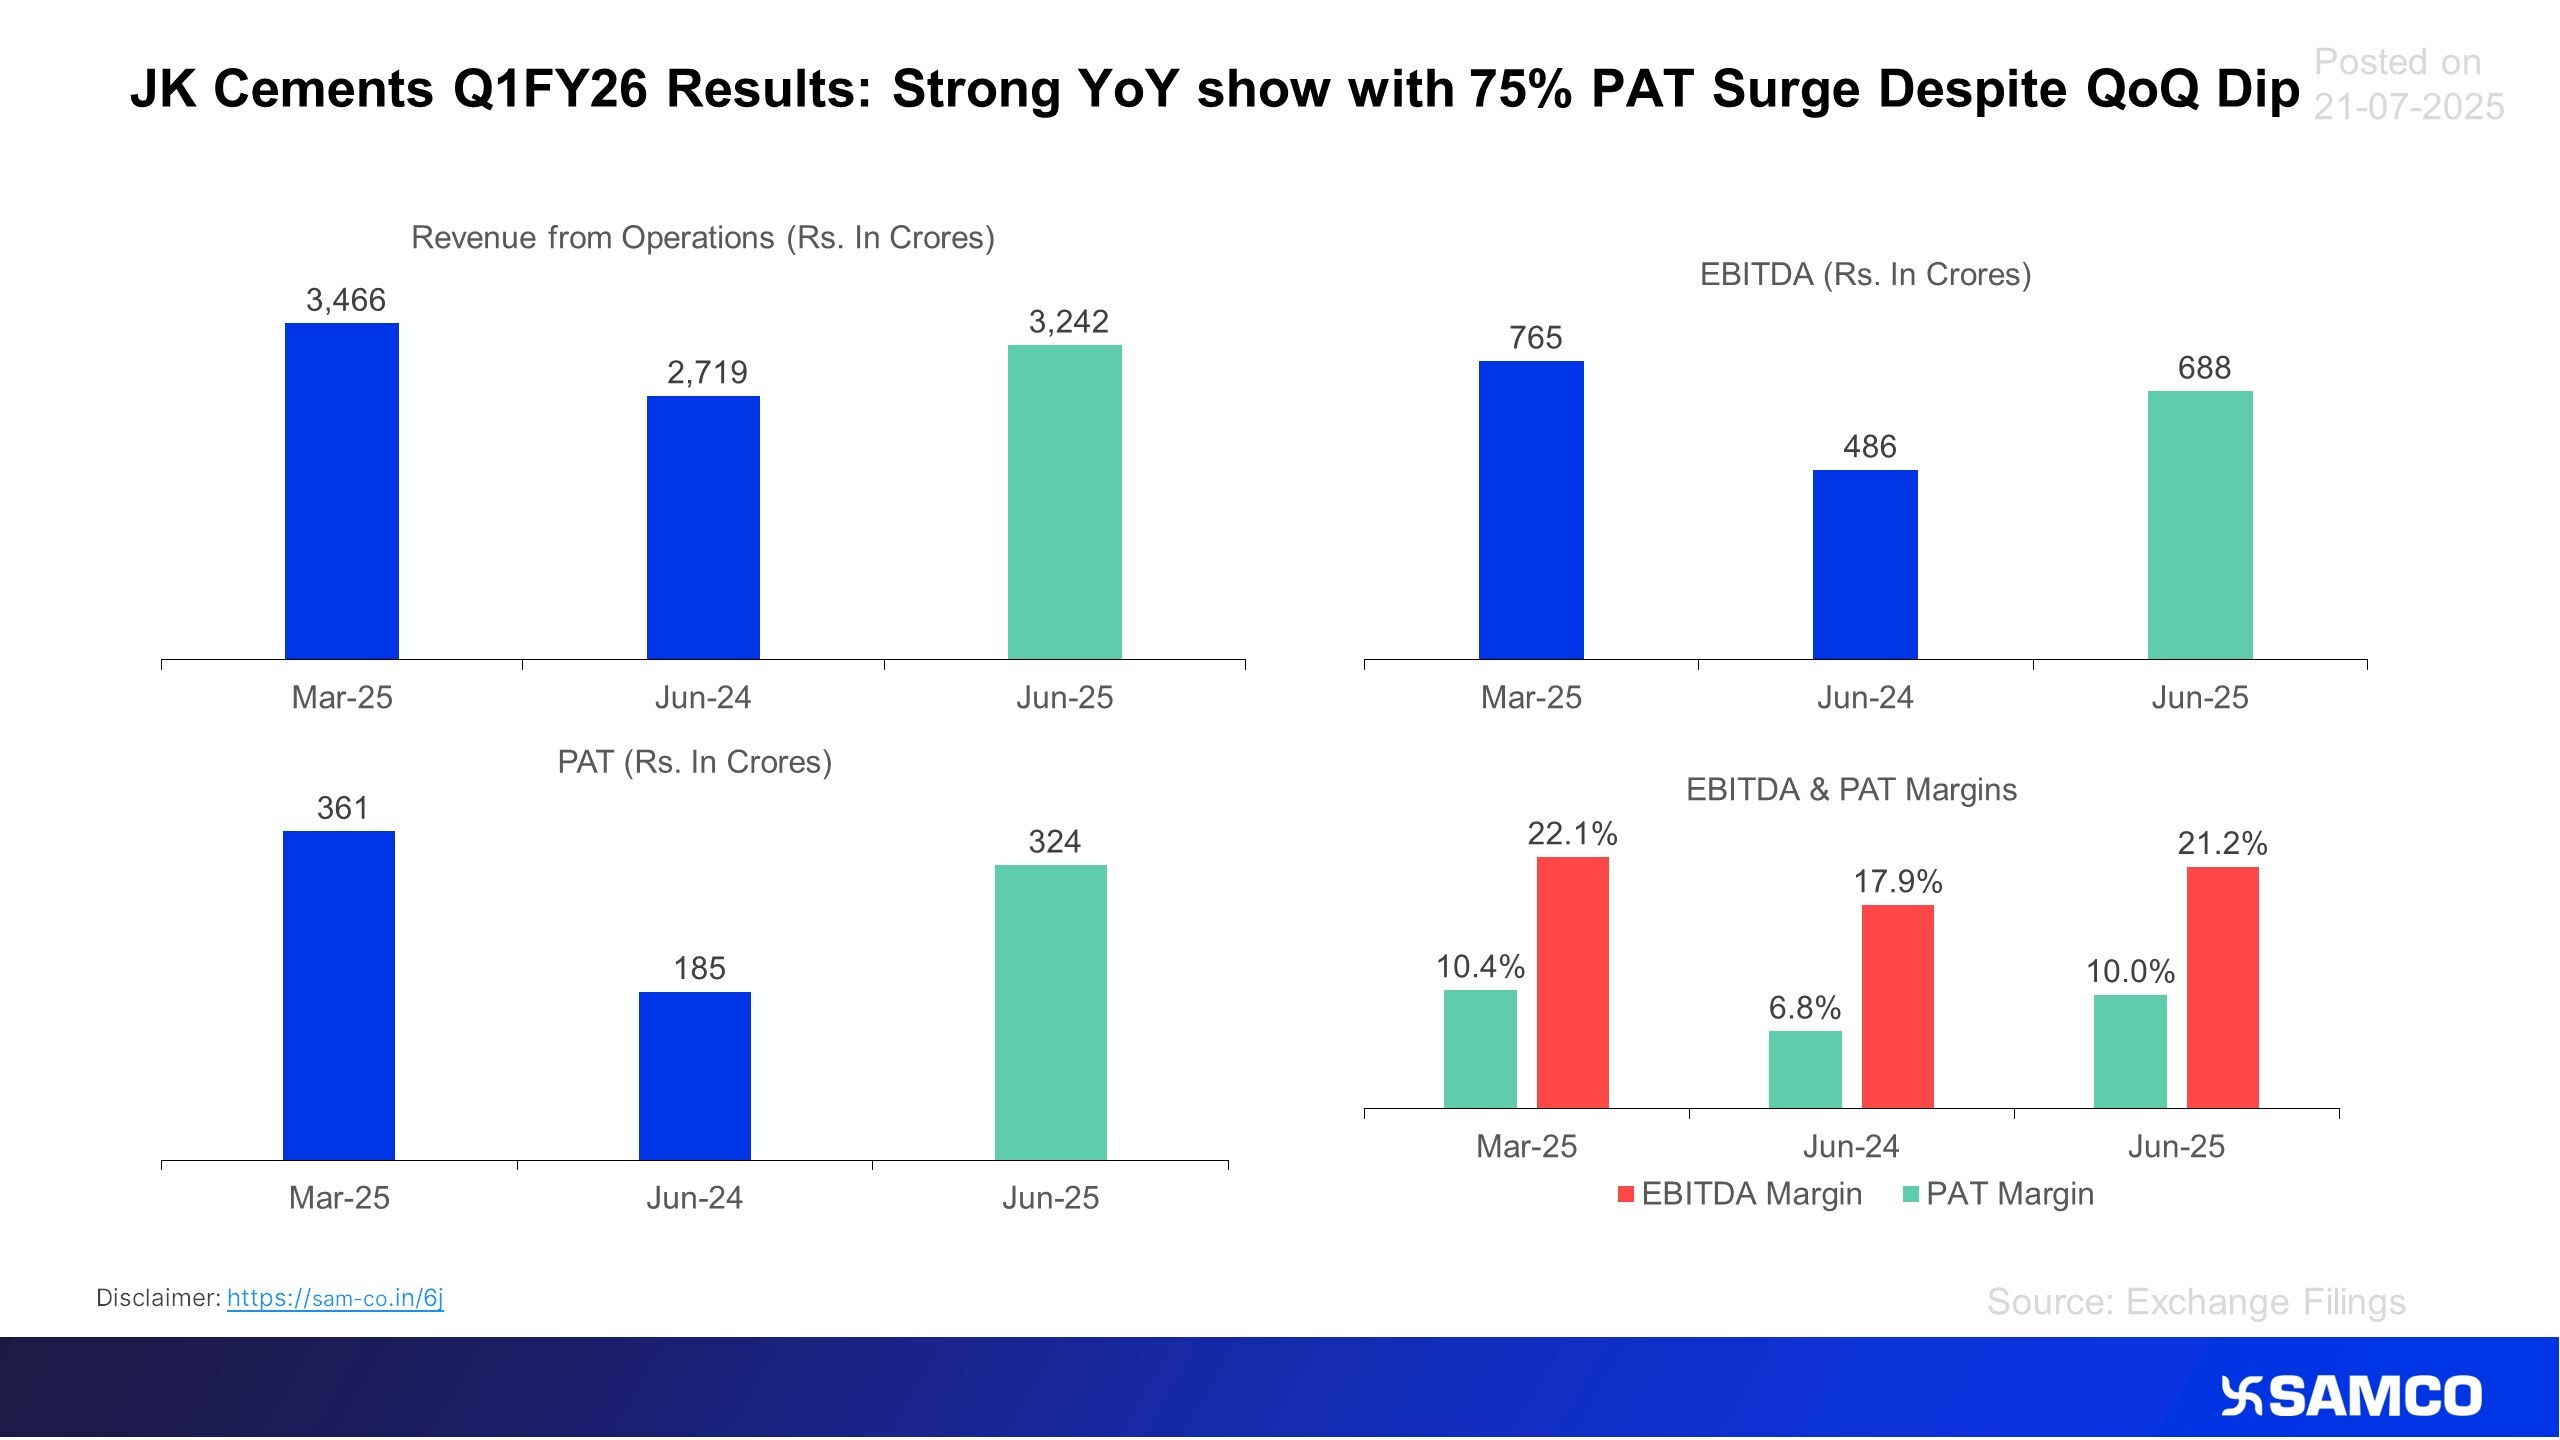
Here’s how JK cements performed by Q1FY26.
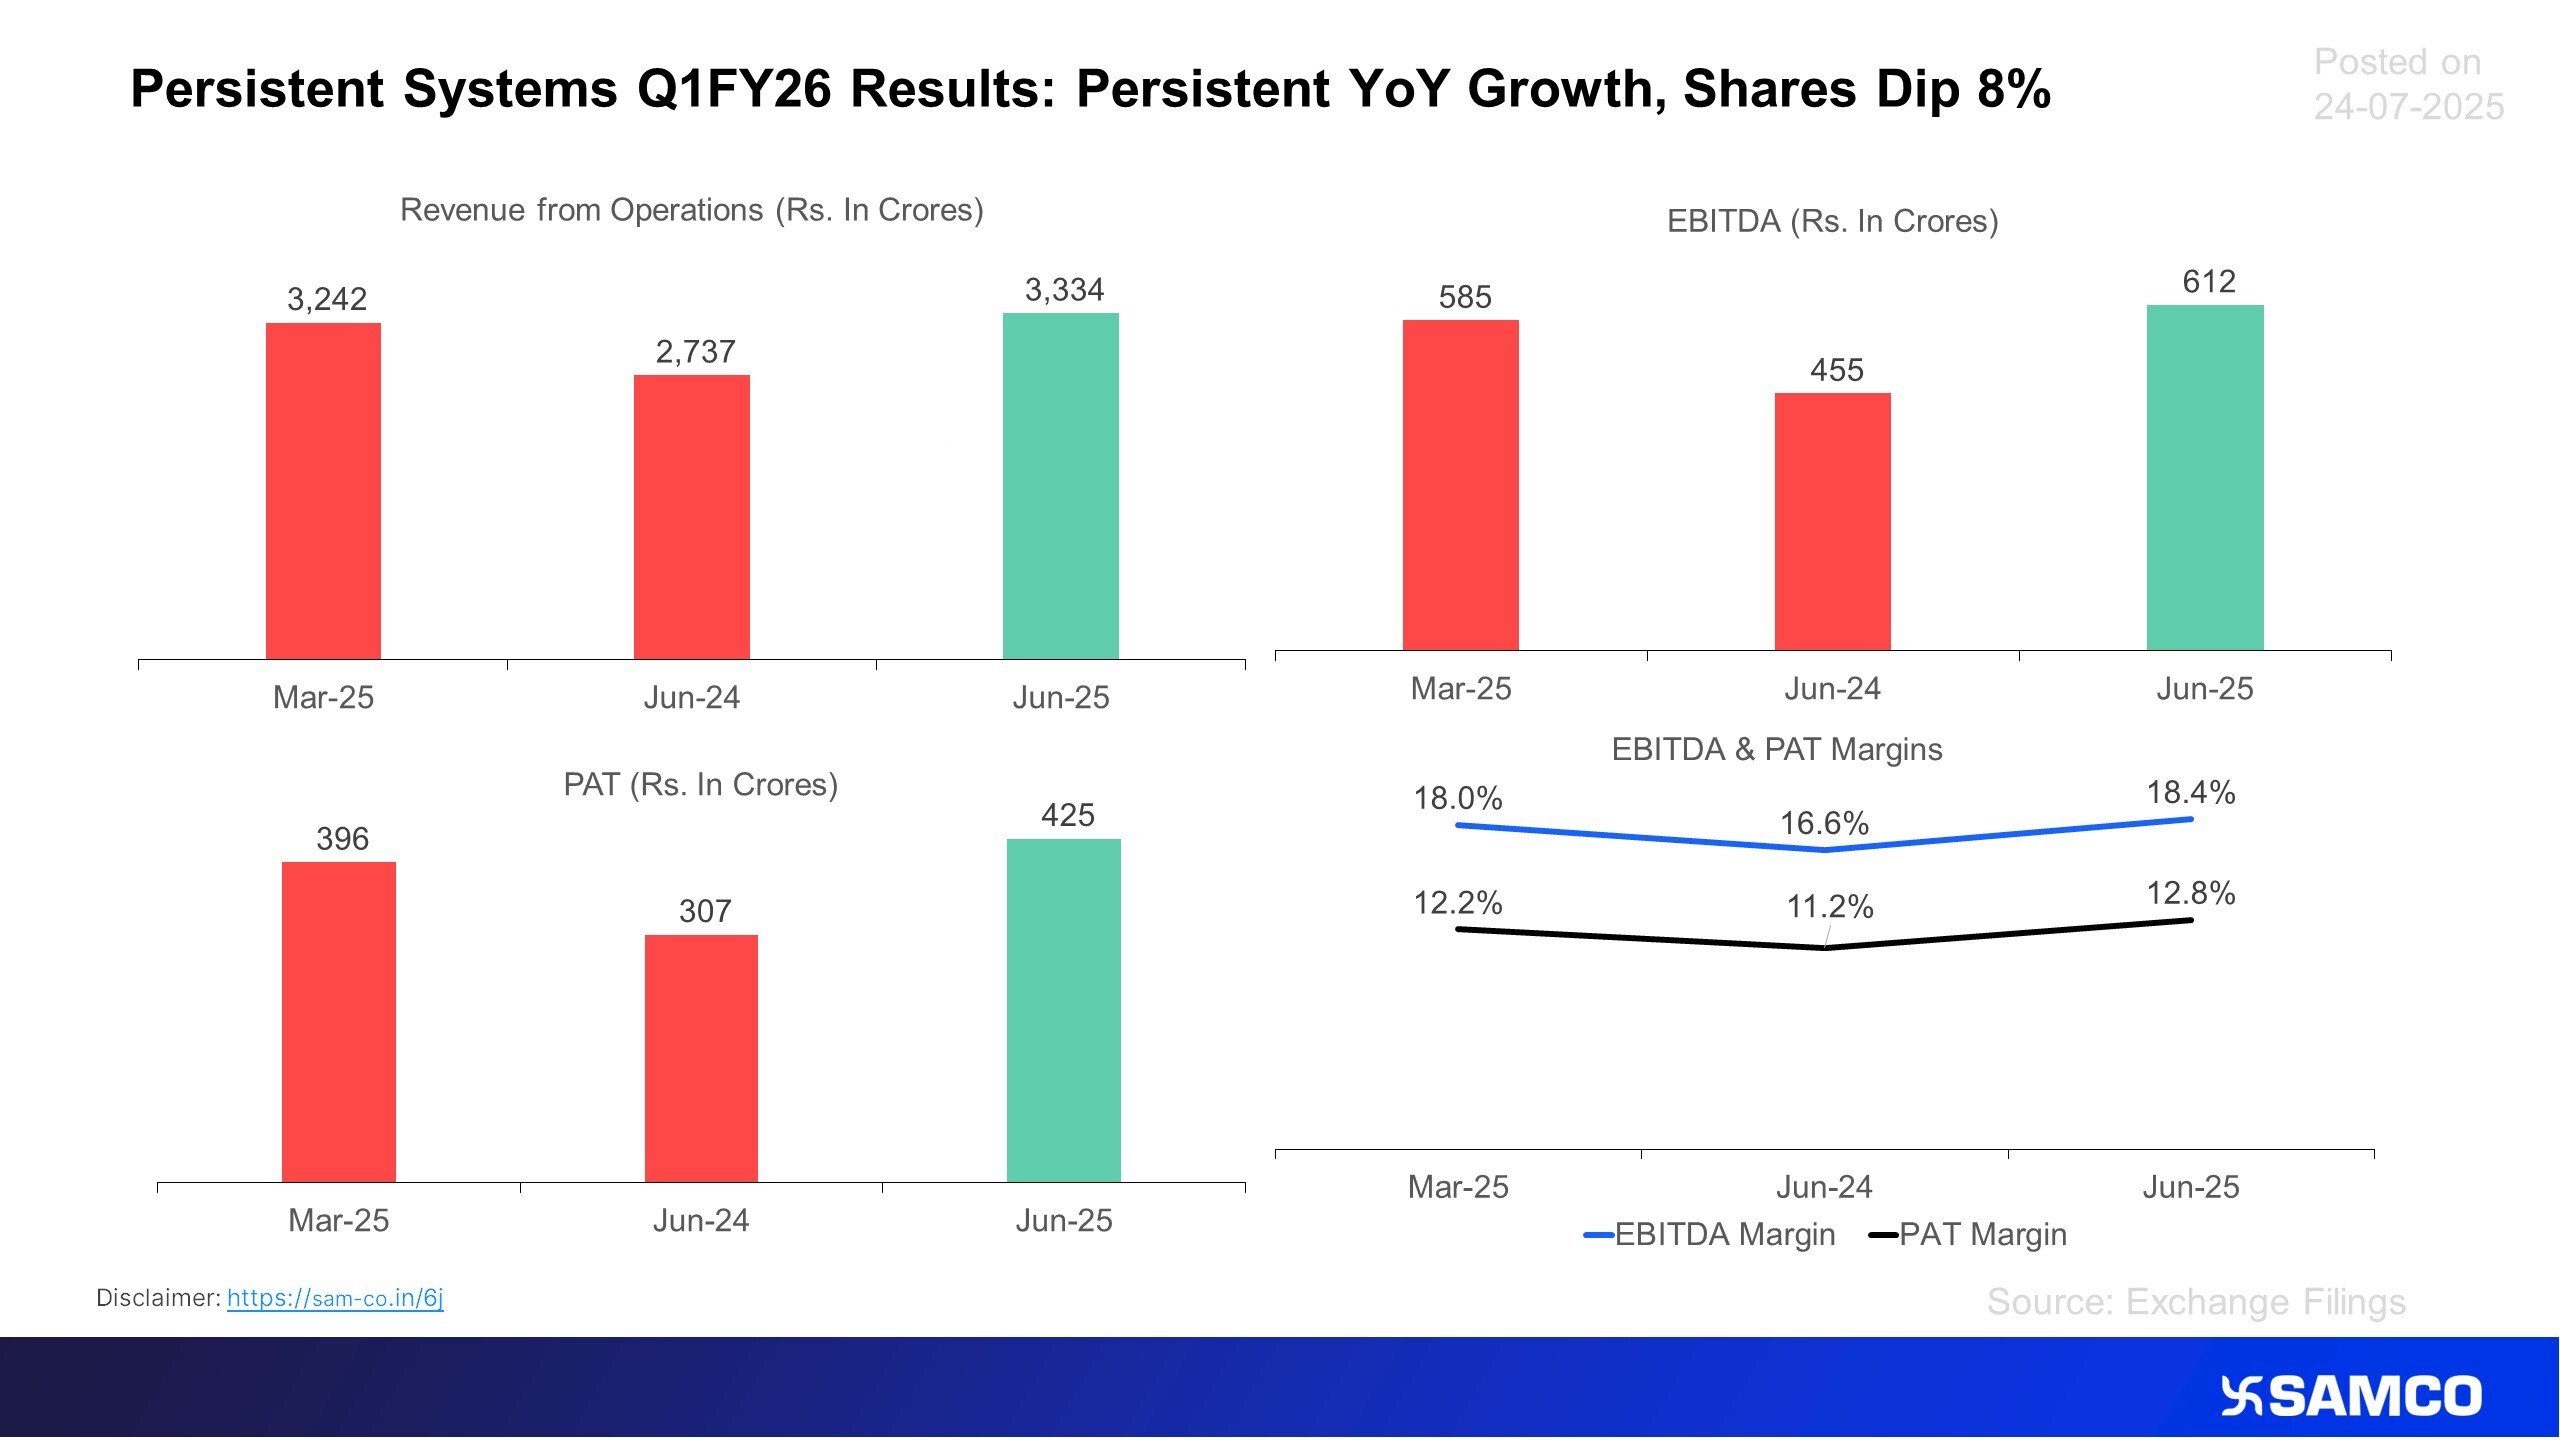
Below chart presents the Q1FY26 results of Persistent systems ltd.
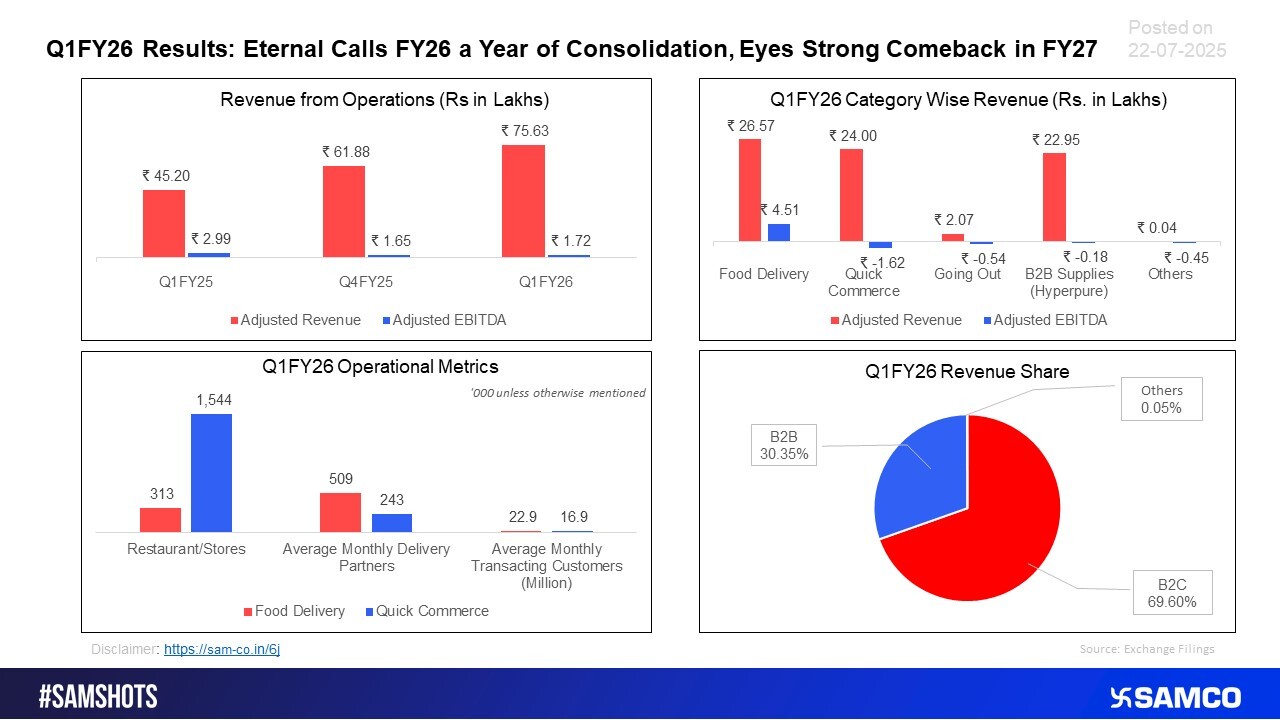
Eternal Posts 67% Revenue Surge in Q1 FY26, Focuses on Growth Amid Margin Pressure
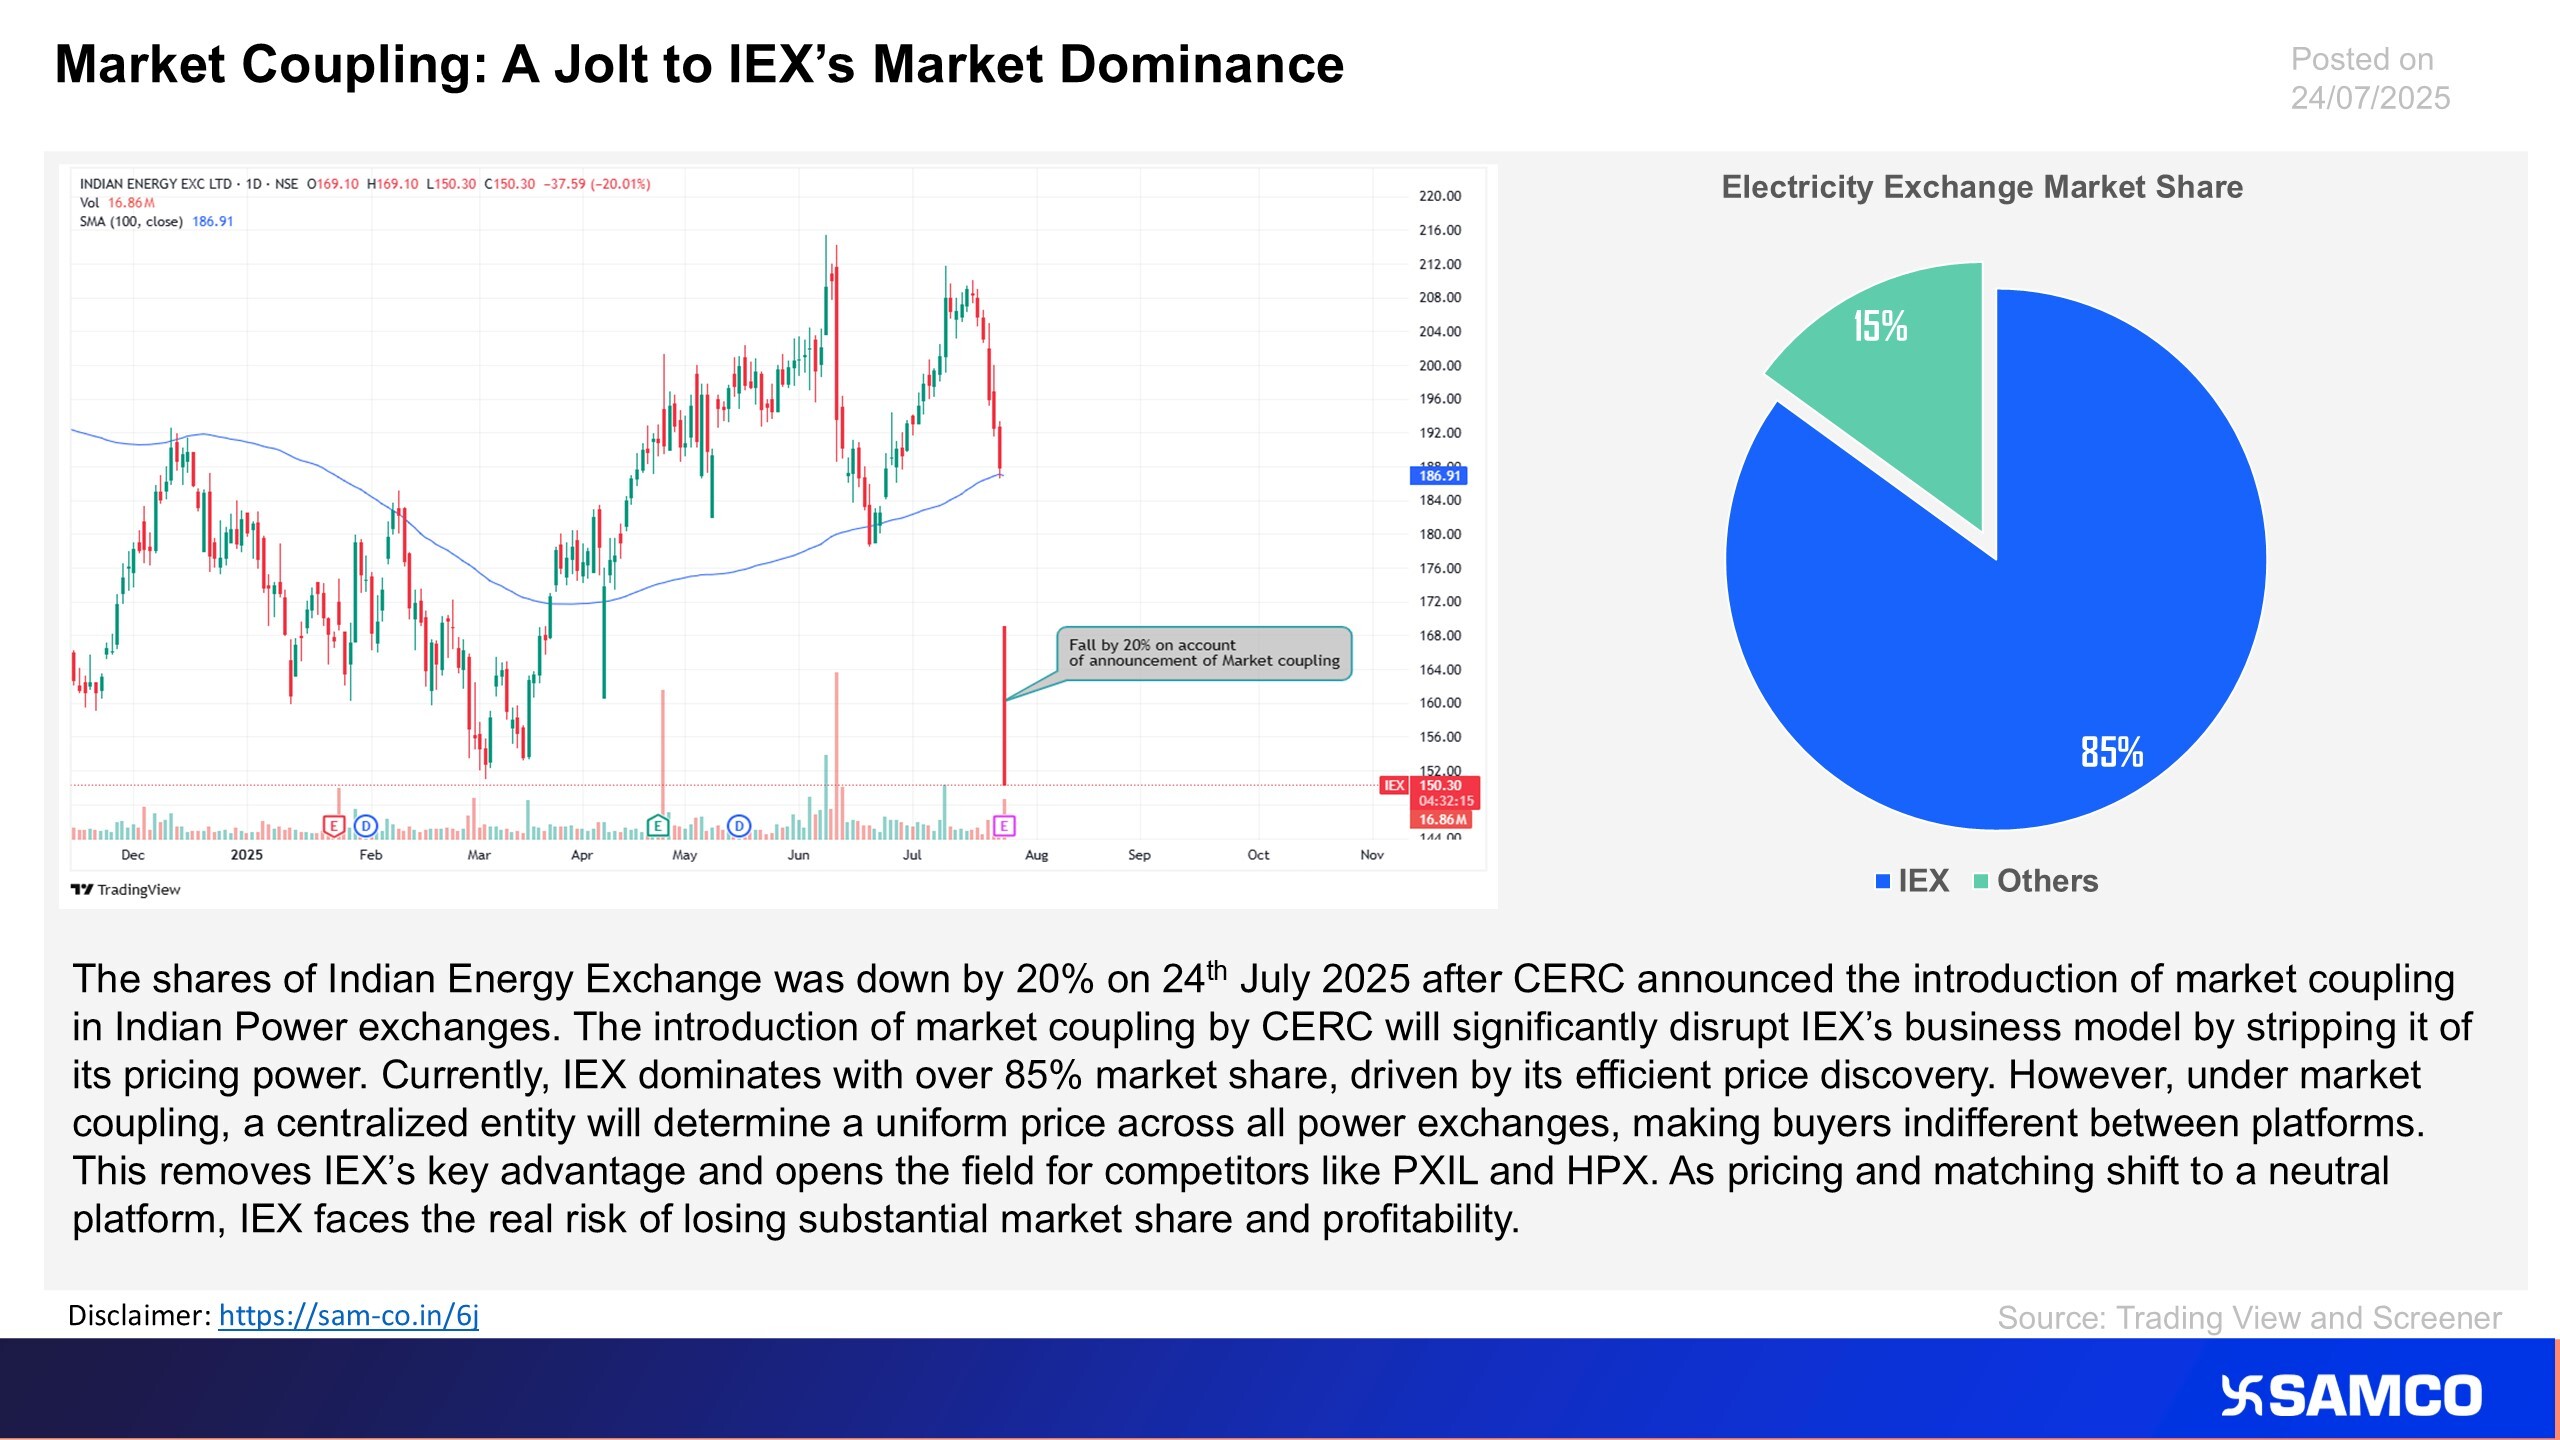
The chart explains the rationale behind IEX share price fall
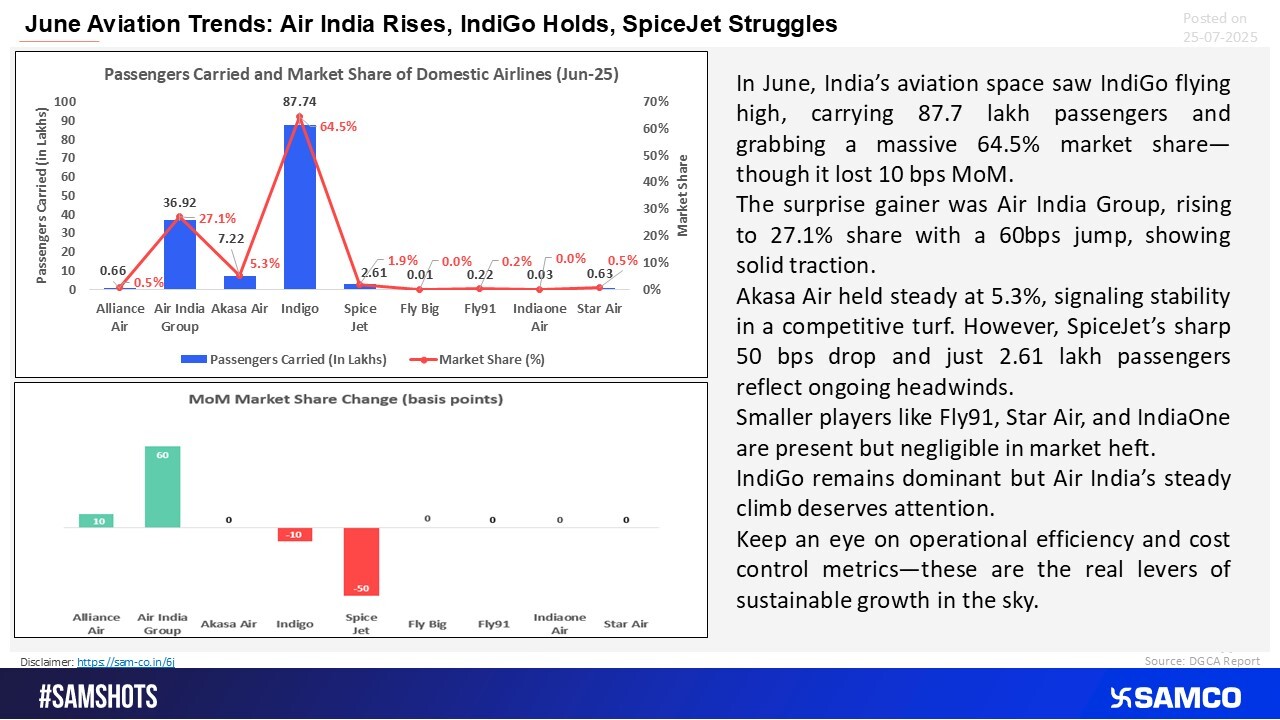
June Flight Shift: Air India Up, SpiceJet Down
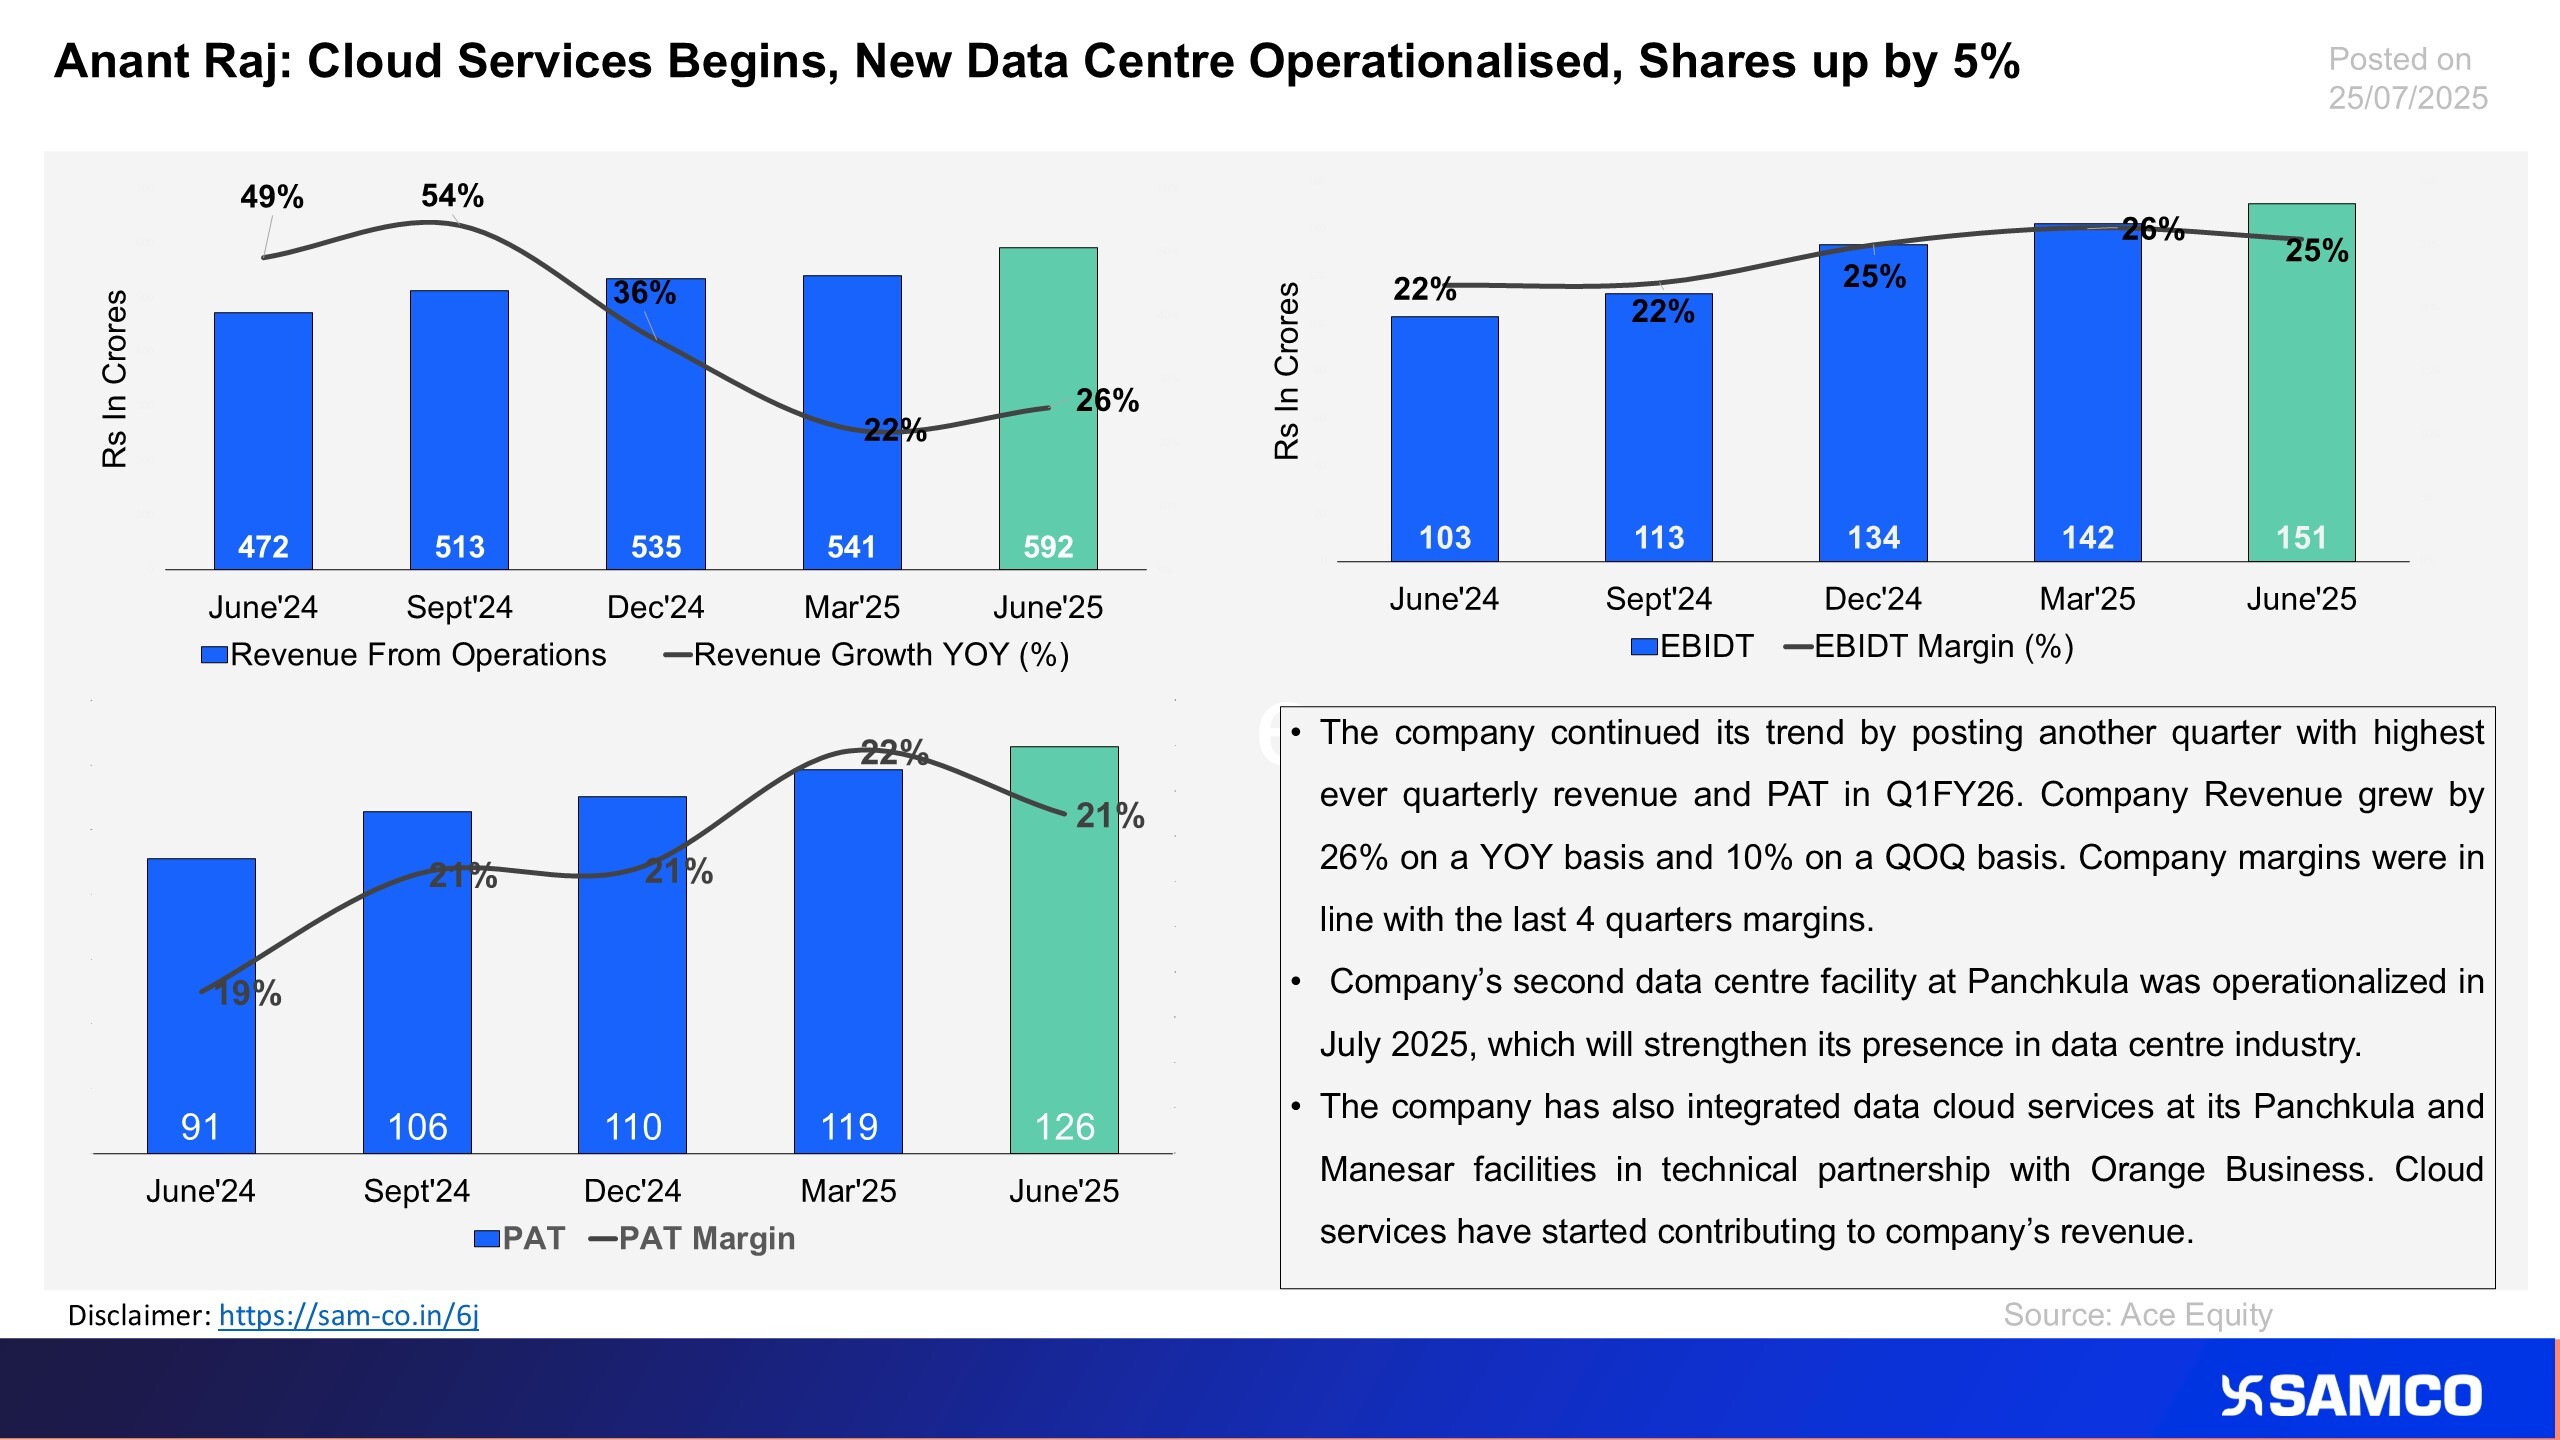
The chart highlights the operational performance and financial highlights for Q1FY26
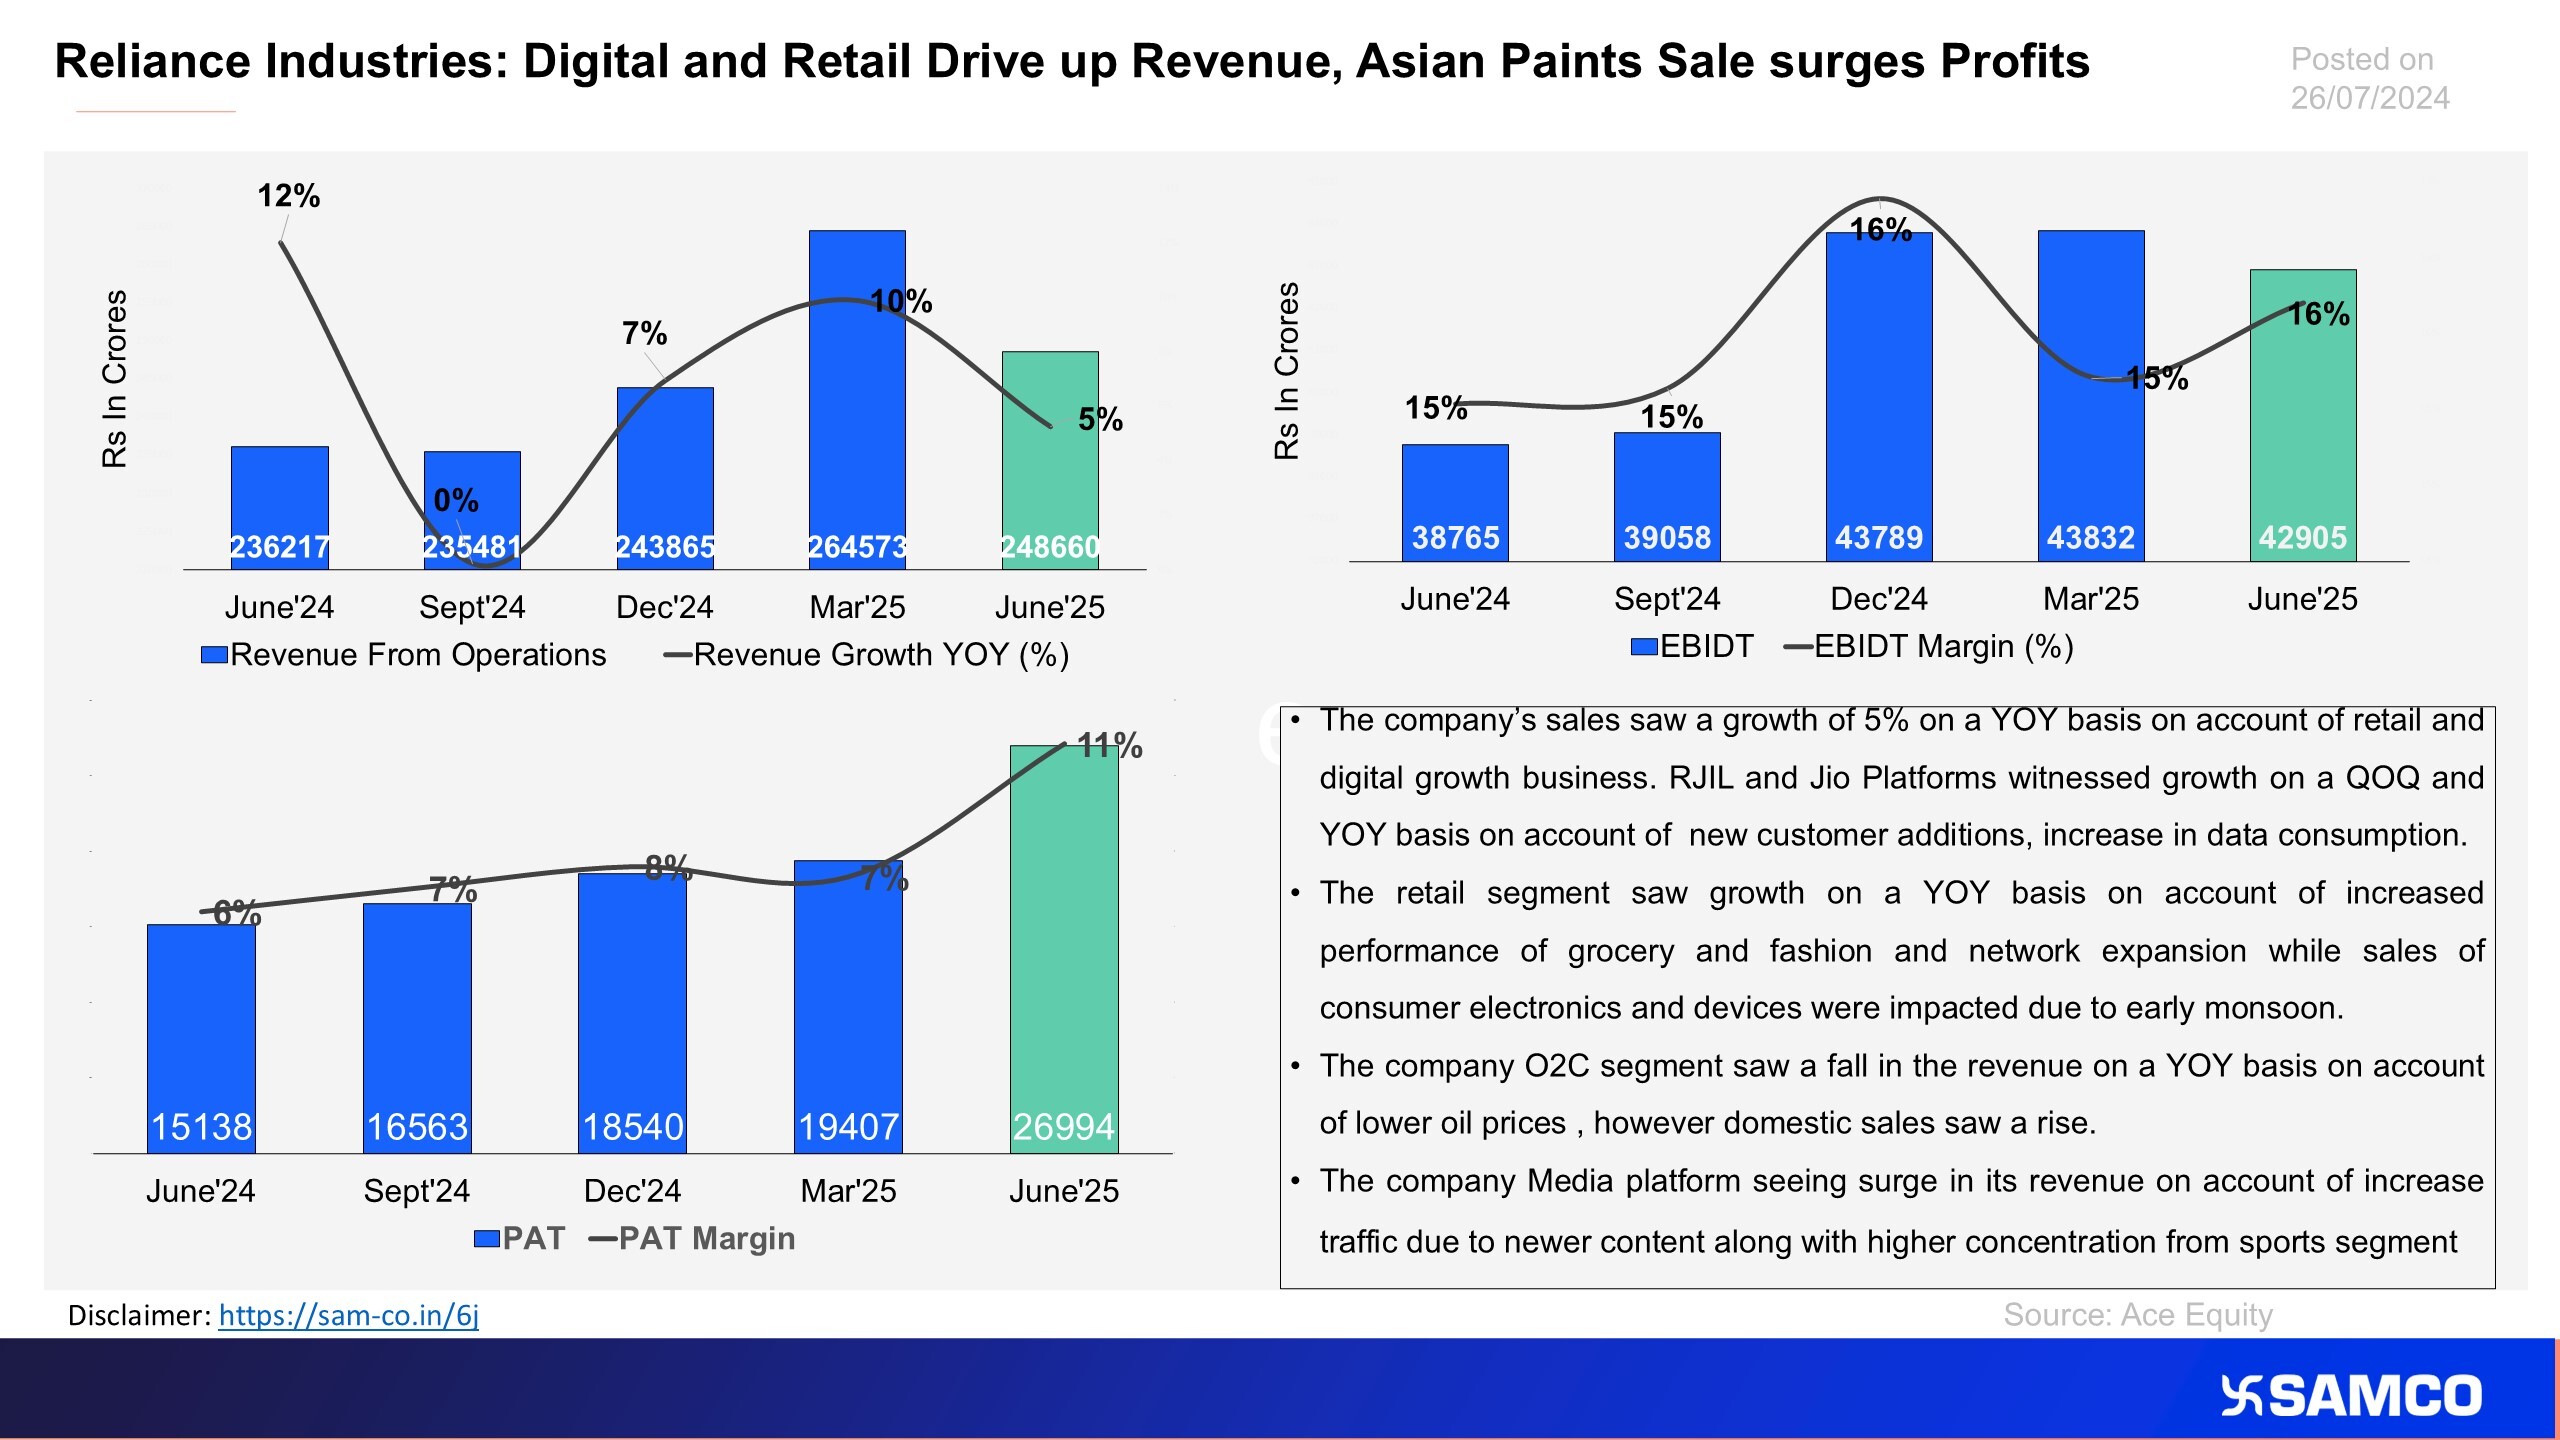
The chart evaluates the financial performance of India’s biggest listed company for Q1Fy26
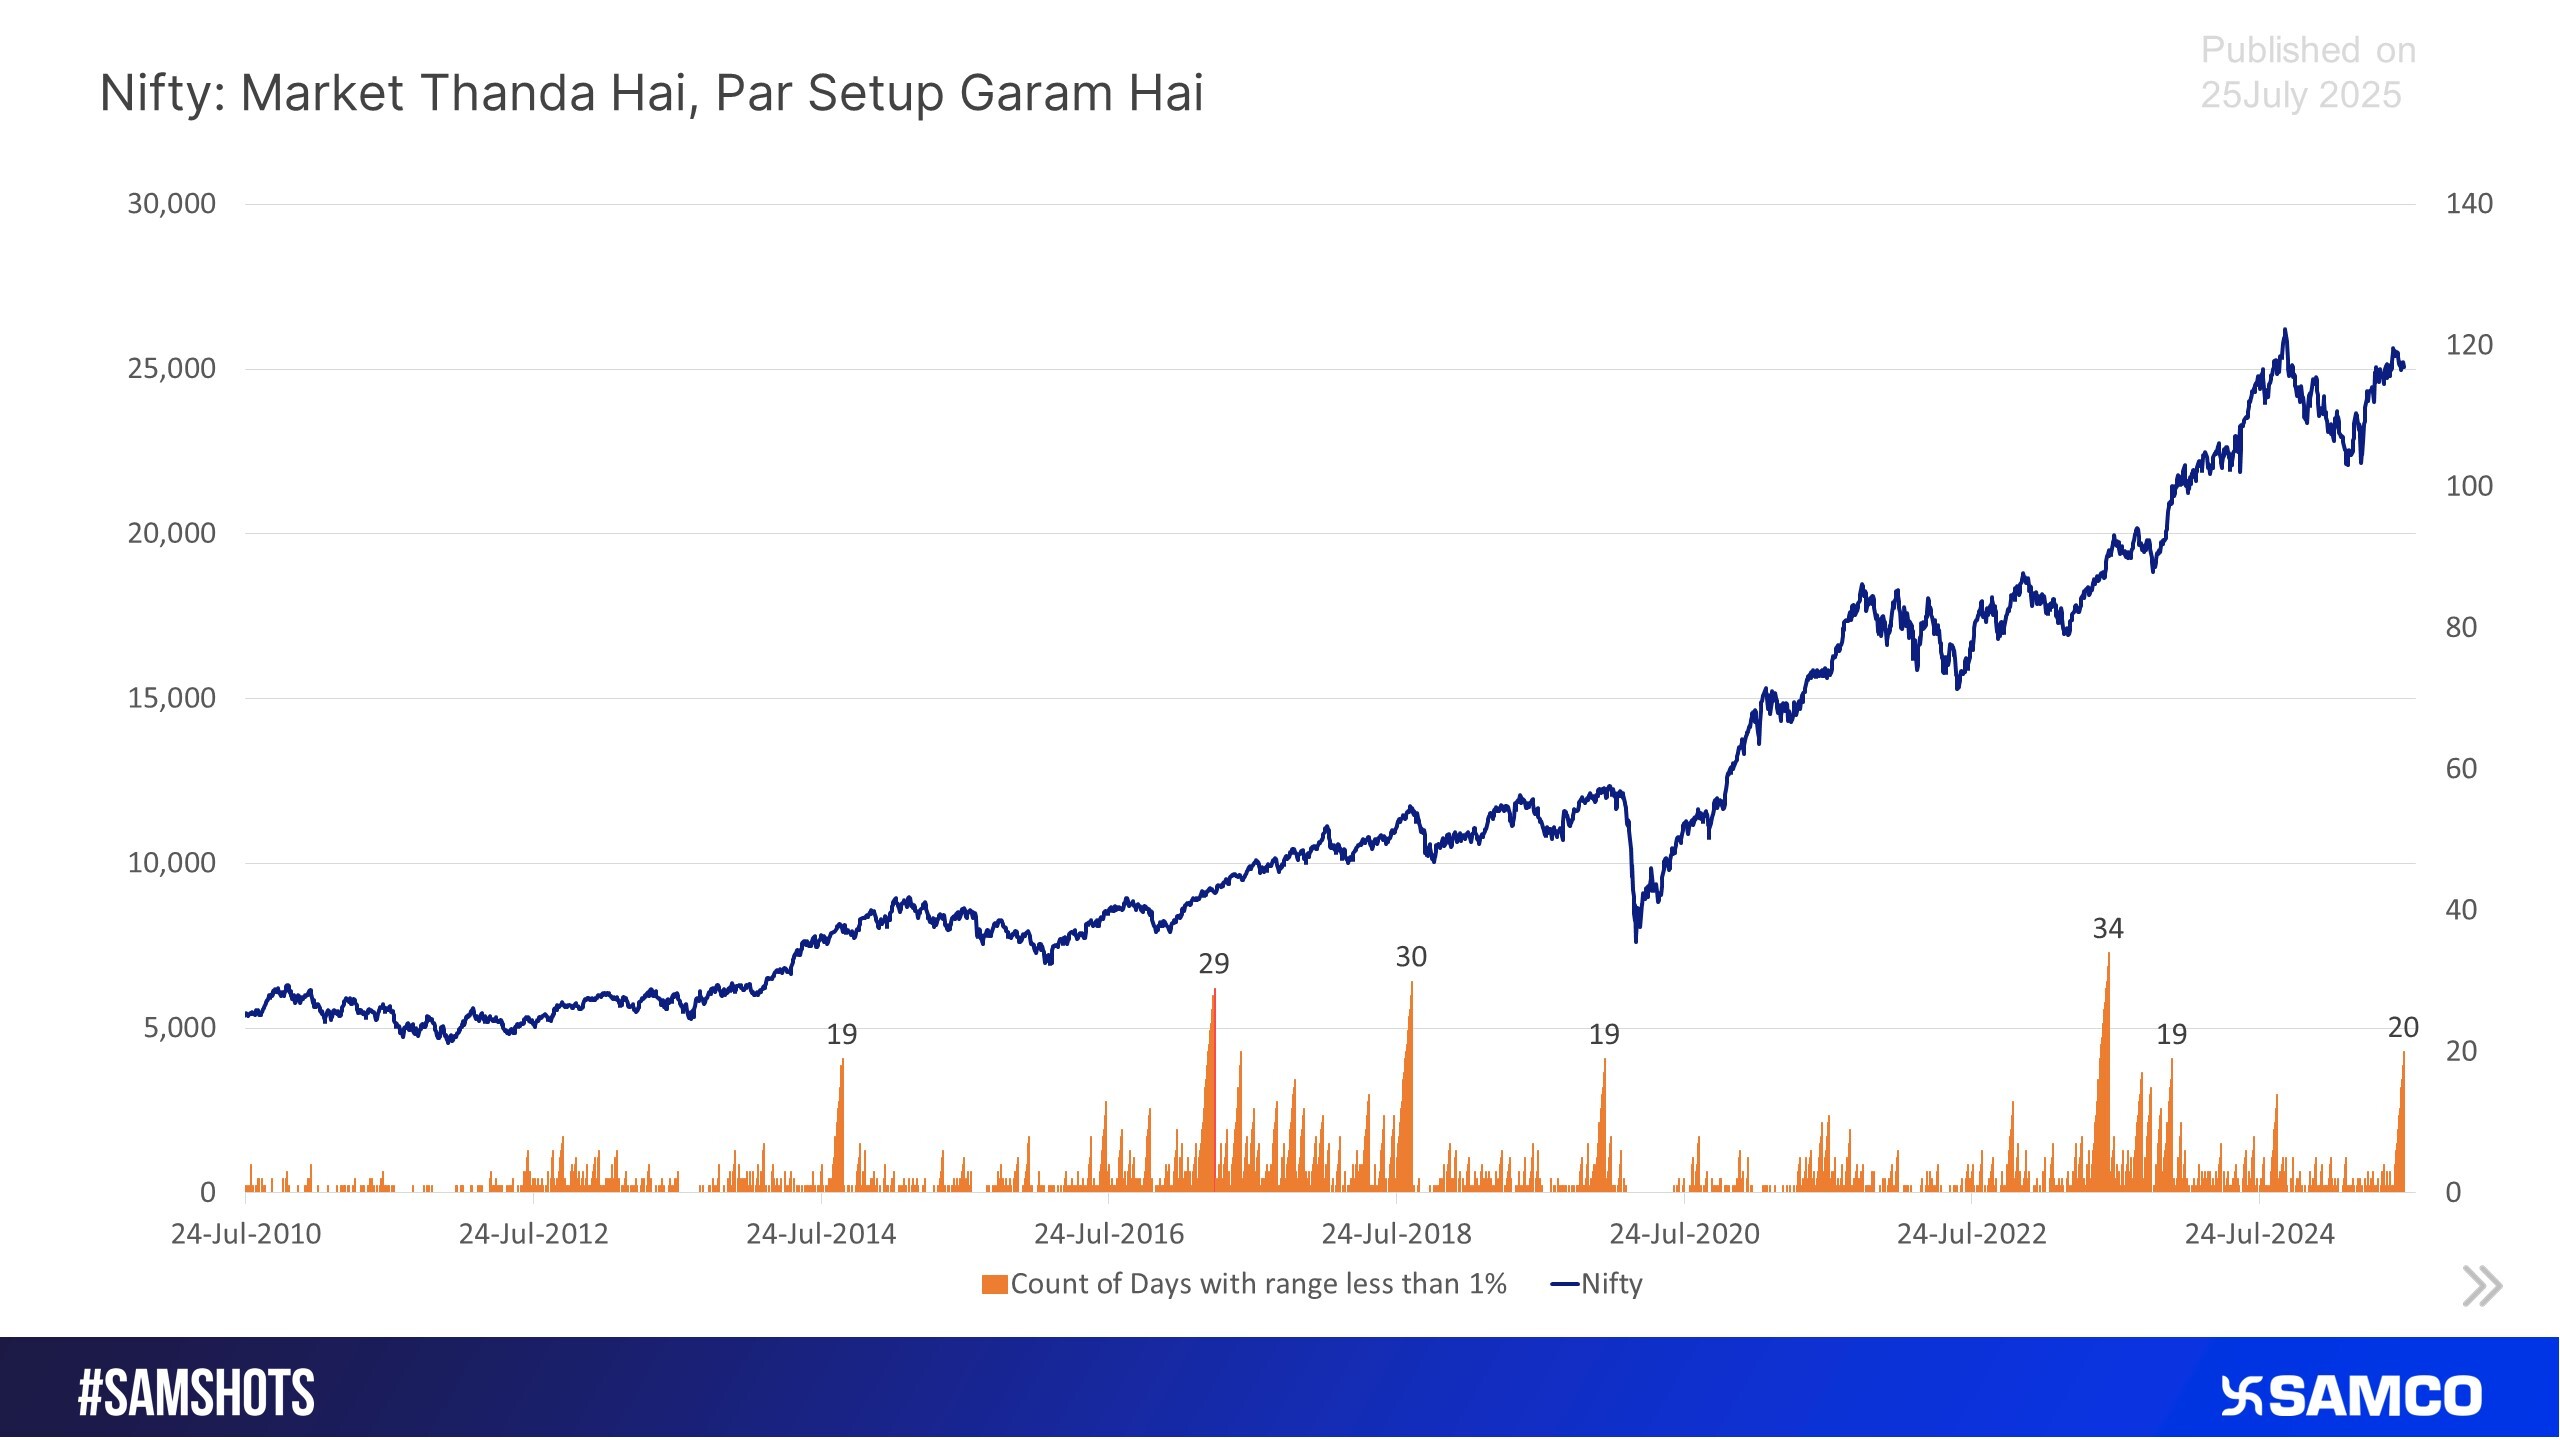
The Nifty slow down its momentum since last 20 trading sessions.
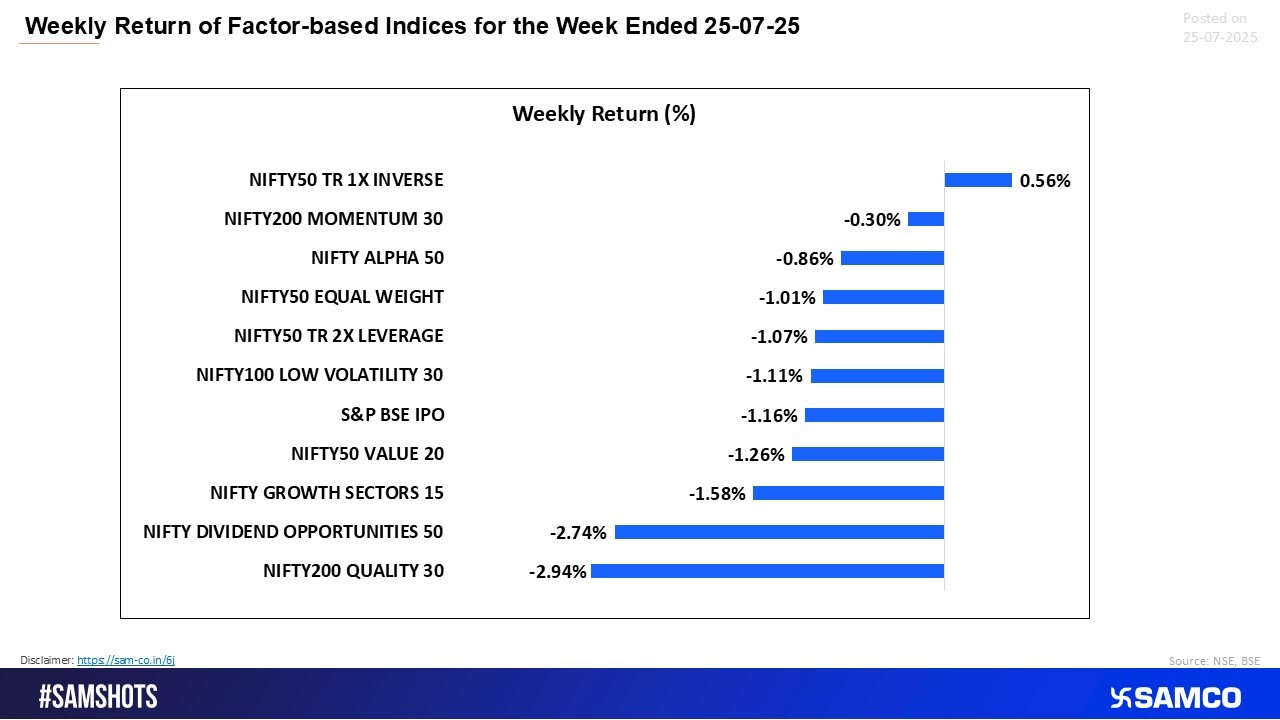
In a weak week for factor indices, Nifty 1x Inverse rose, while Quality and Dividend themes took the biggest hit.
Nifty Bank and Pharma held steady this week, while Realty and IT bore the brunt of the sell-off, falling nearly 5% and 4% respectively

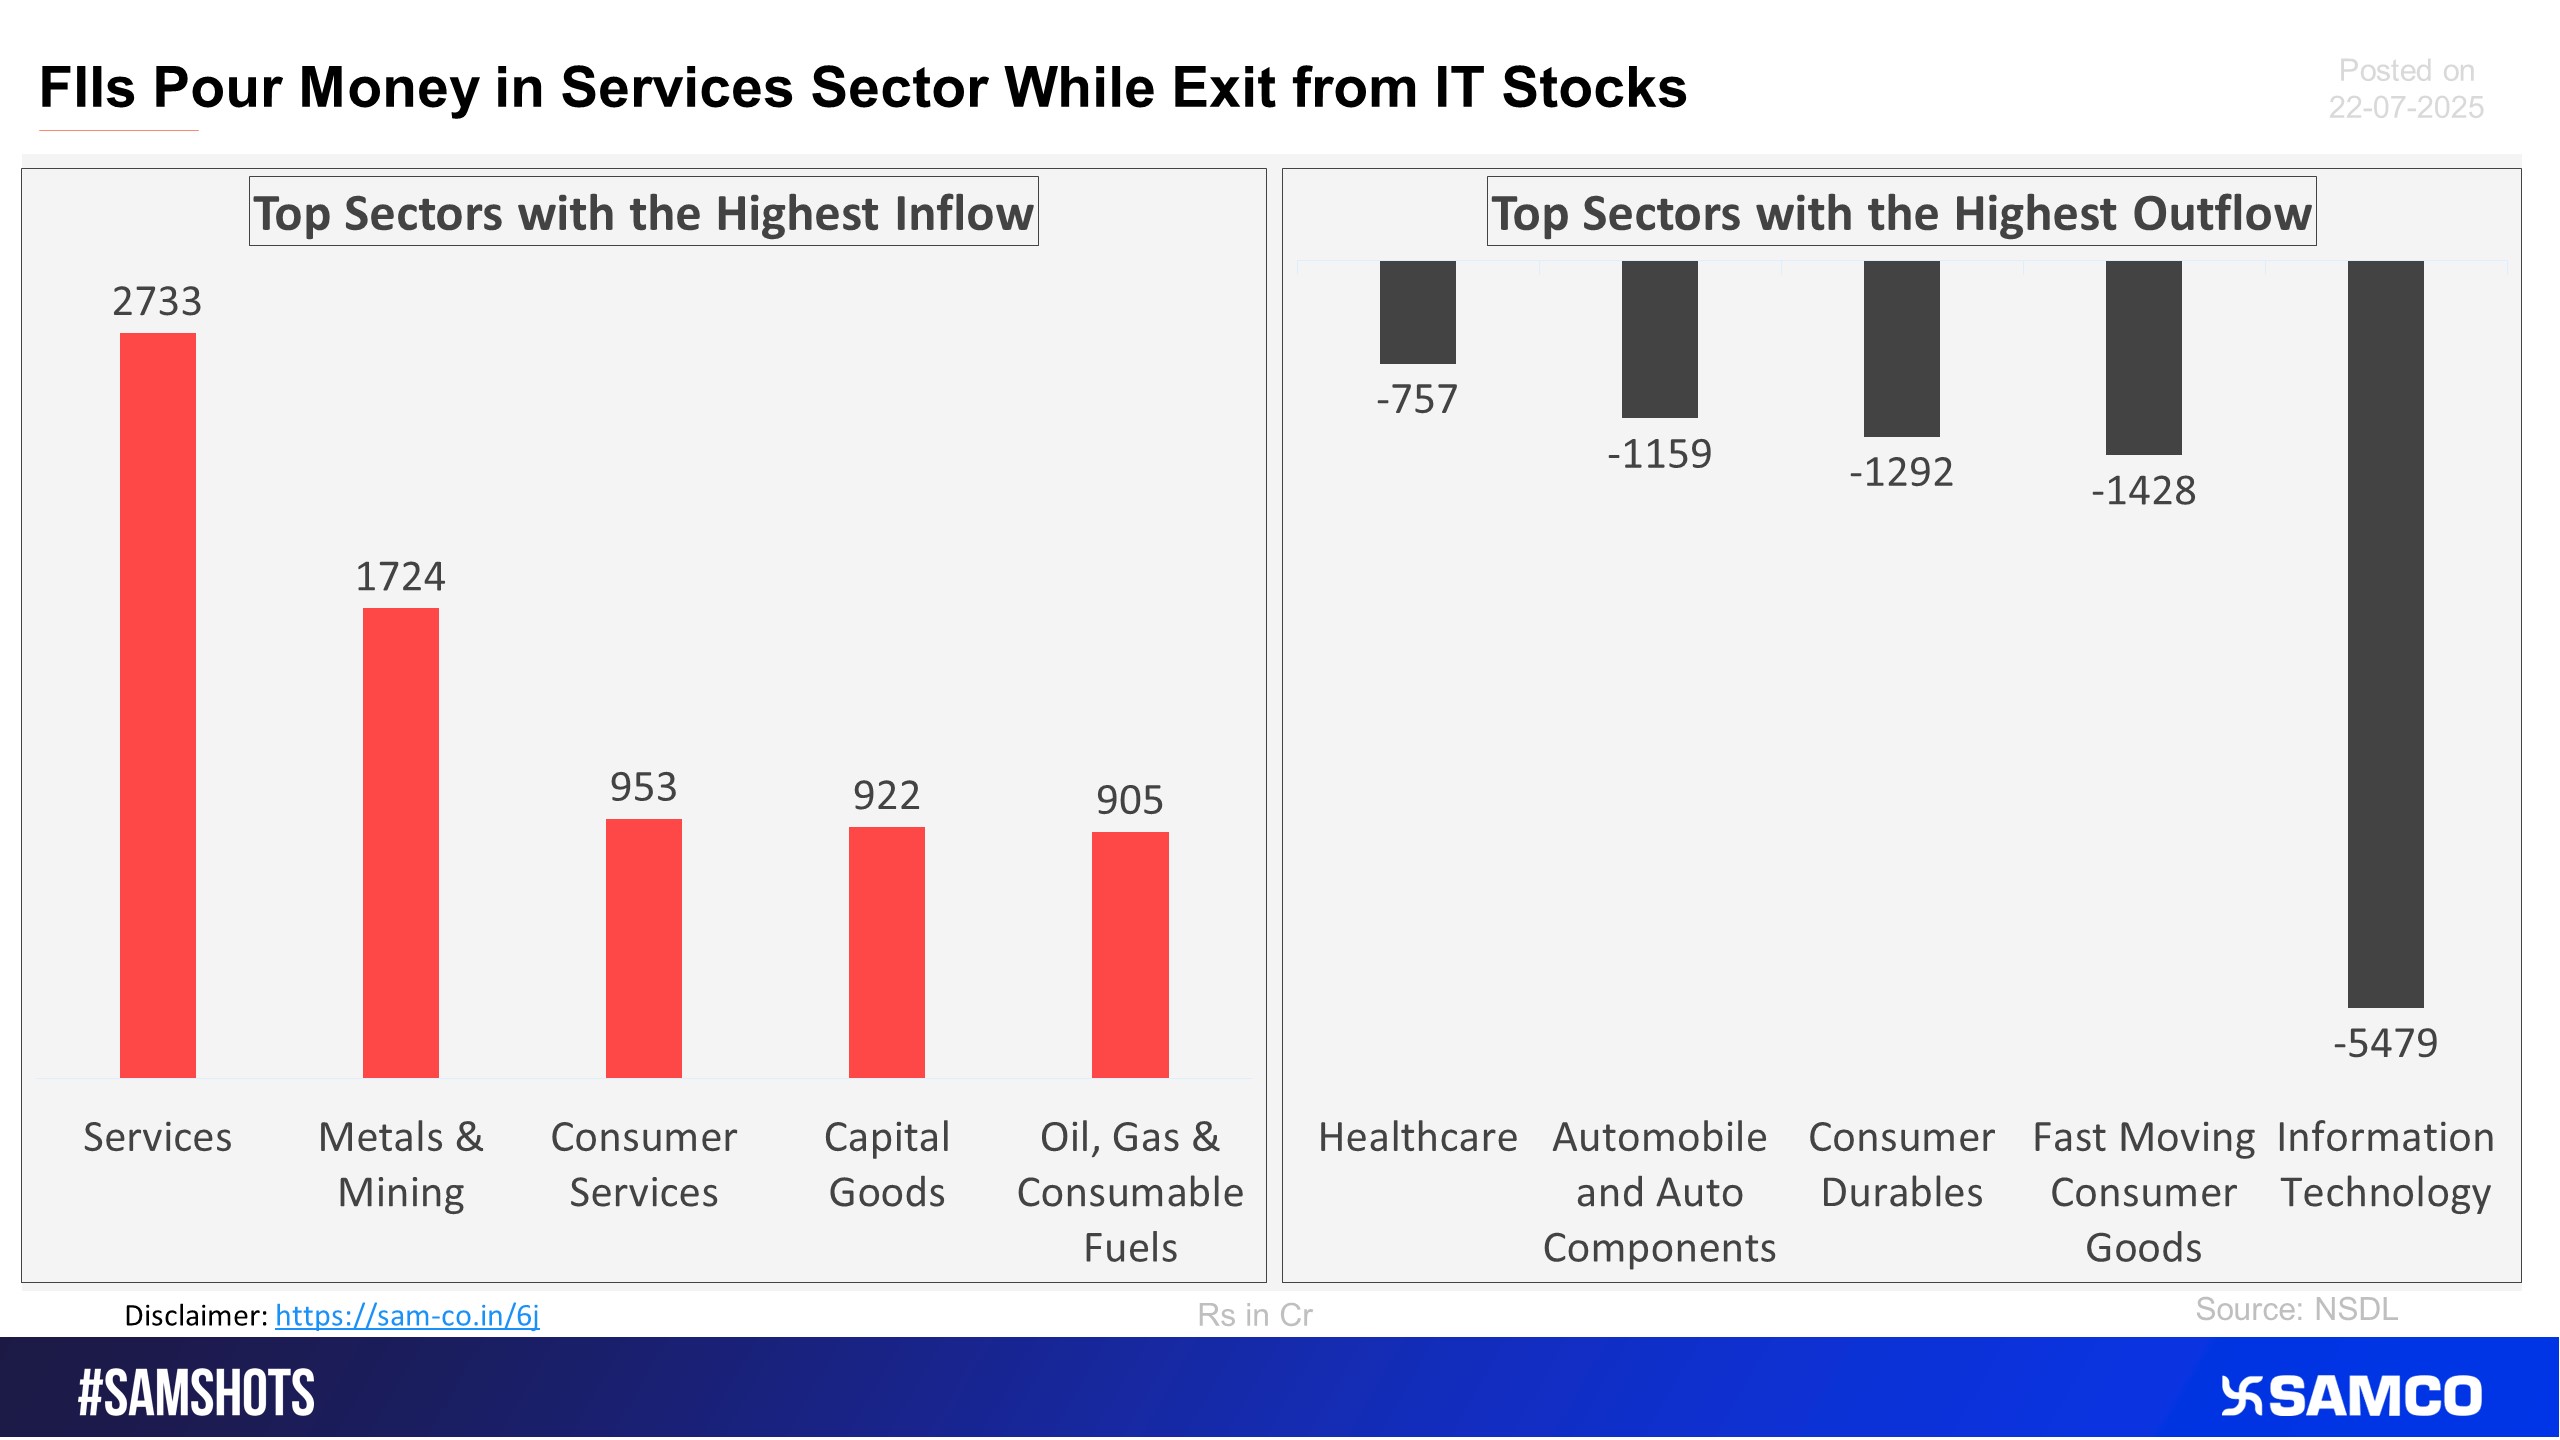
The accompanying chart shows the top 5 sectors that witnessed FPI’s highest inflow and outflow in the latest quarter.
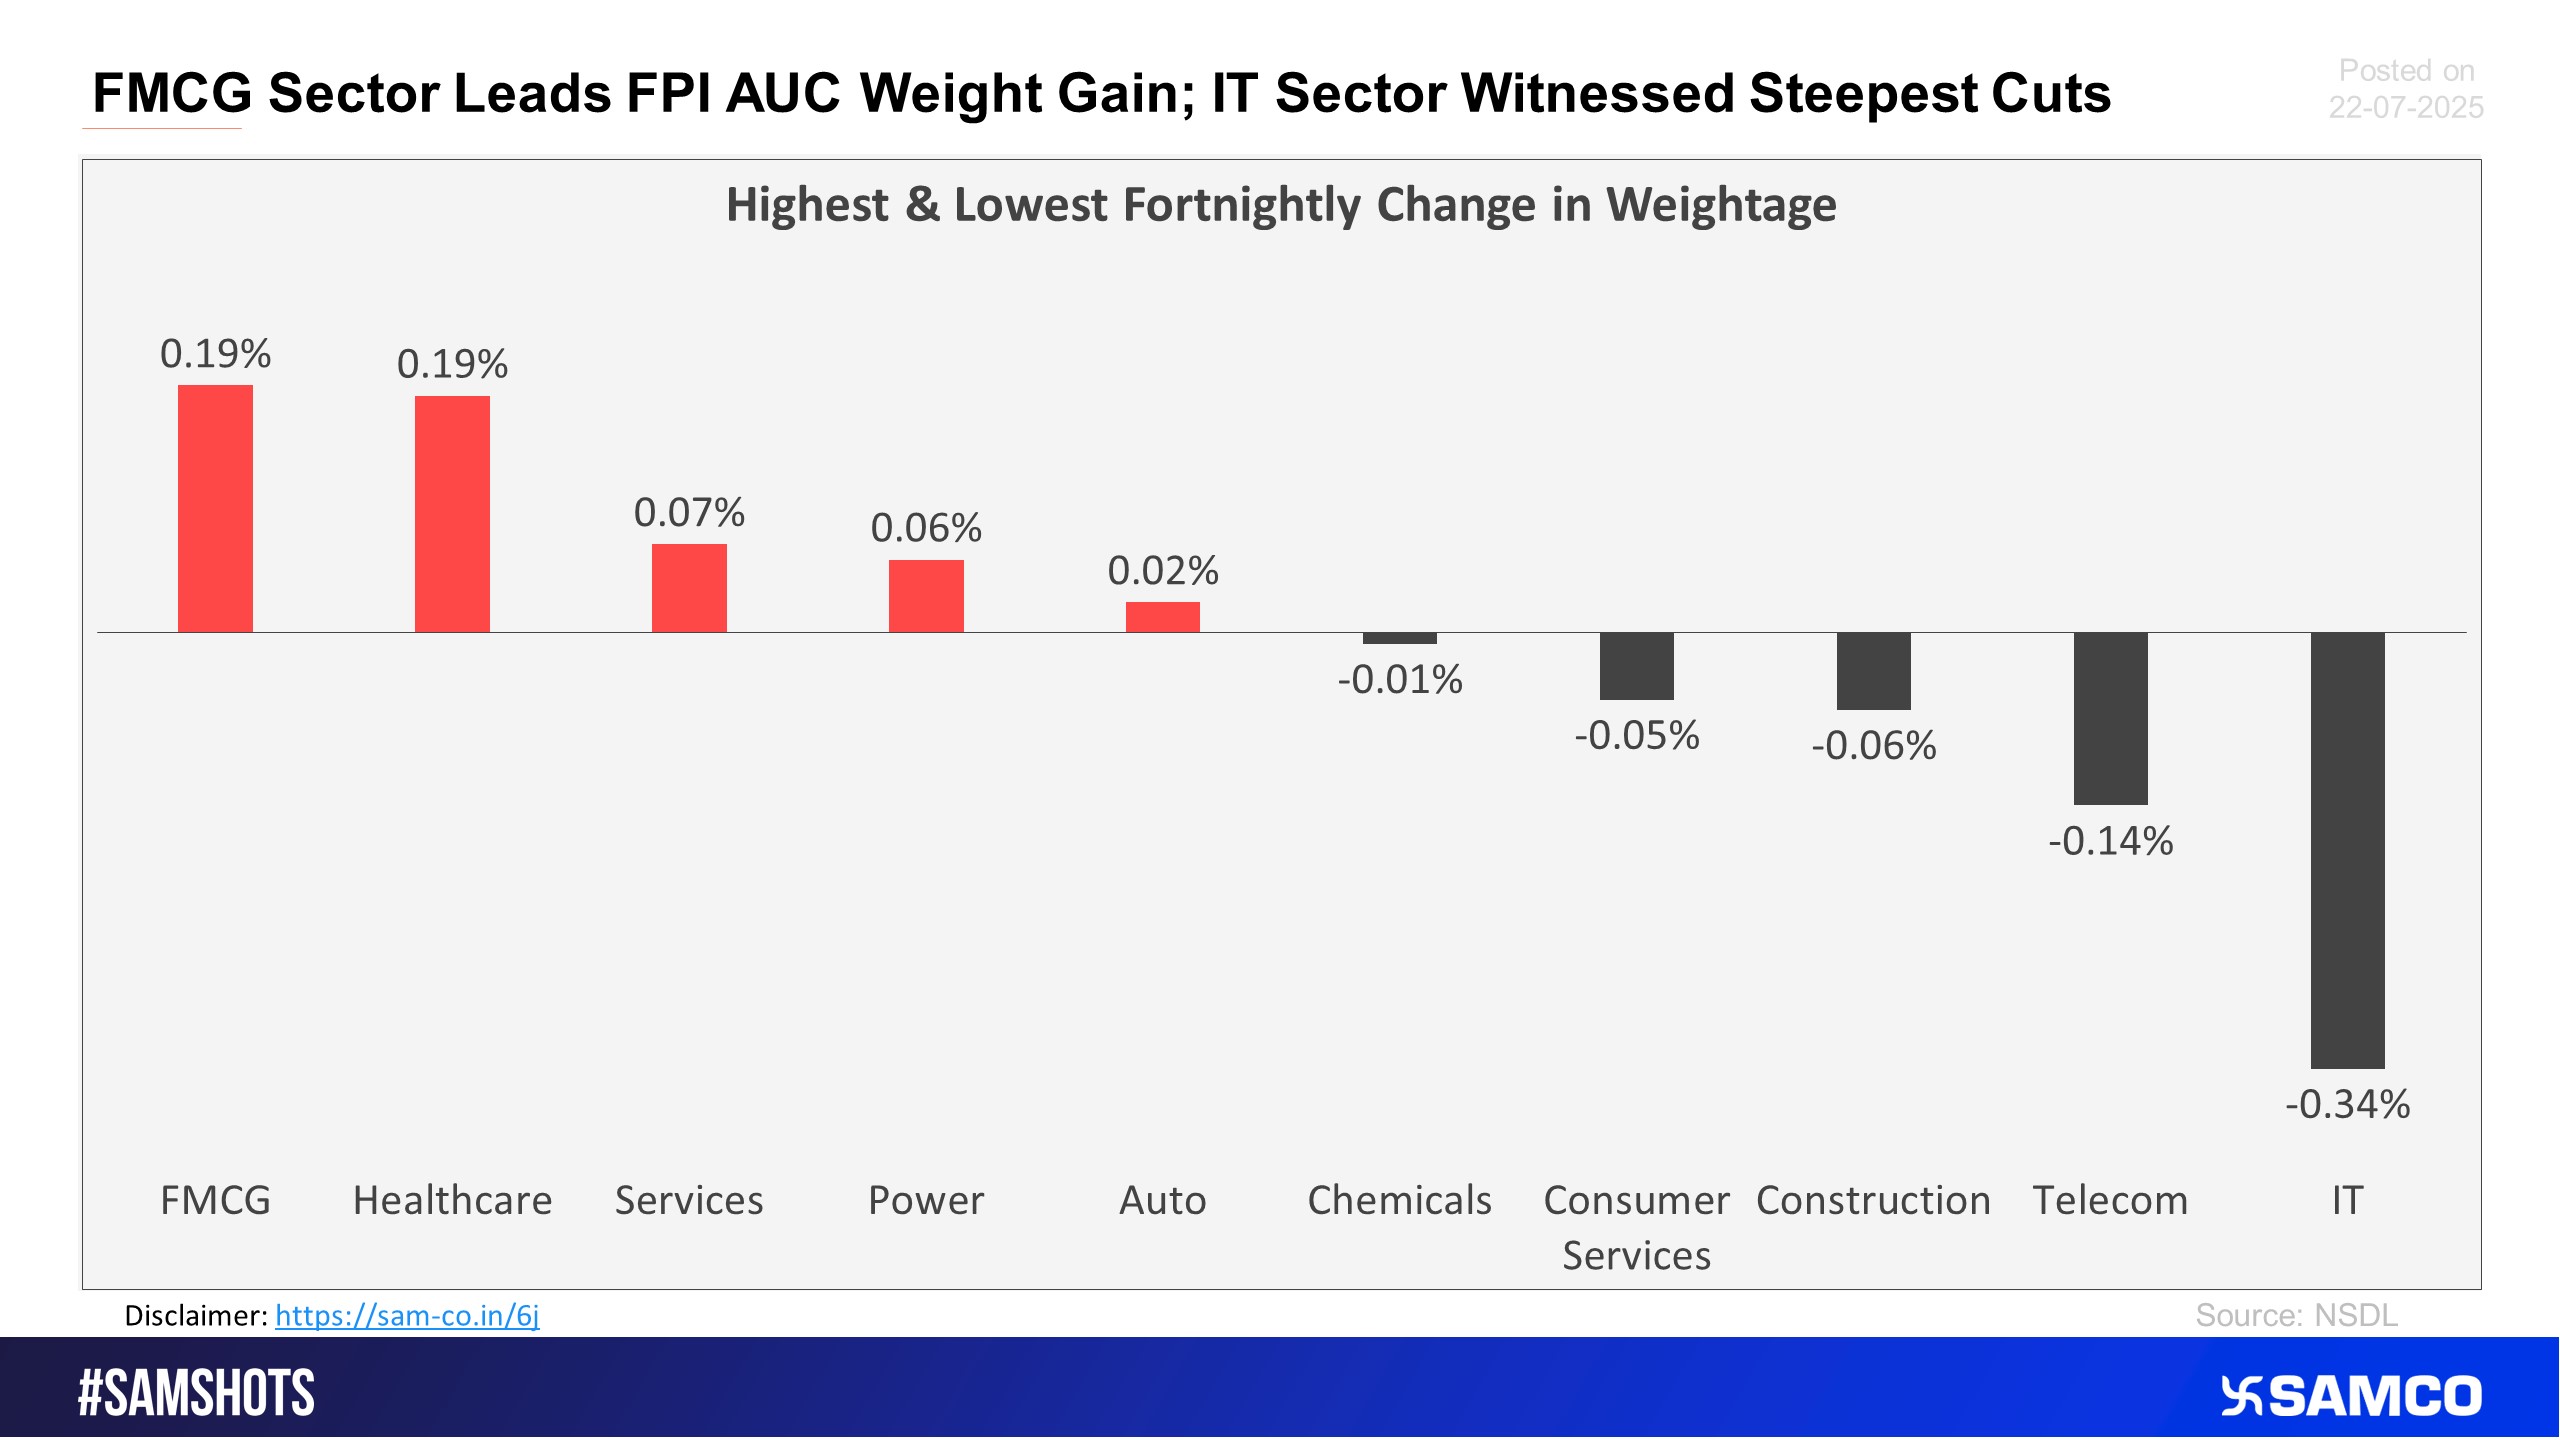
The chart below displays sectors that witnessed the highest and lowest change in the weightage of sectoral FPI holdings to the total FPI holdings compared to the previous fortnight.
The below chart presents the highest & lowest percentage inflow of investment in the latest fortnight compared to the previous period AUC (Asset Under Custody) of FPI.

Momentum builds as TORNTPHARM breaks accumulation
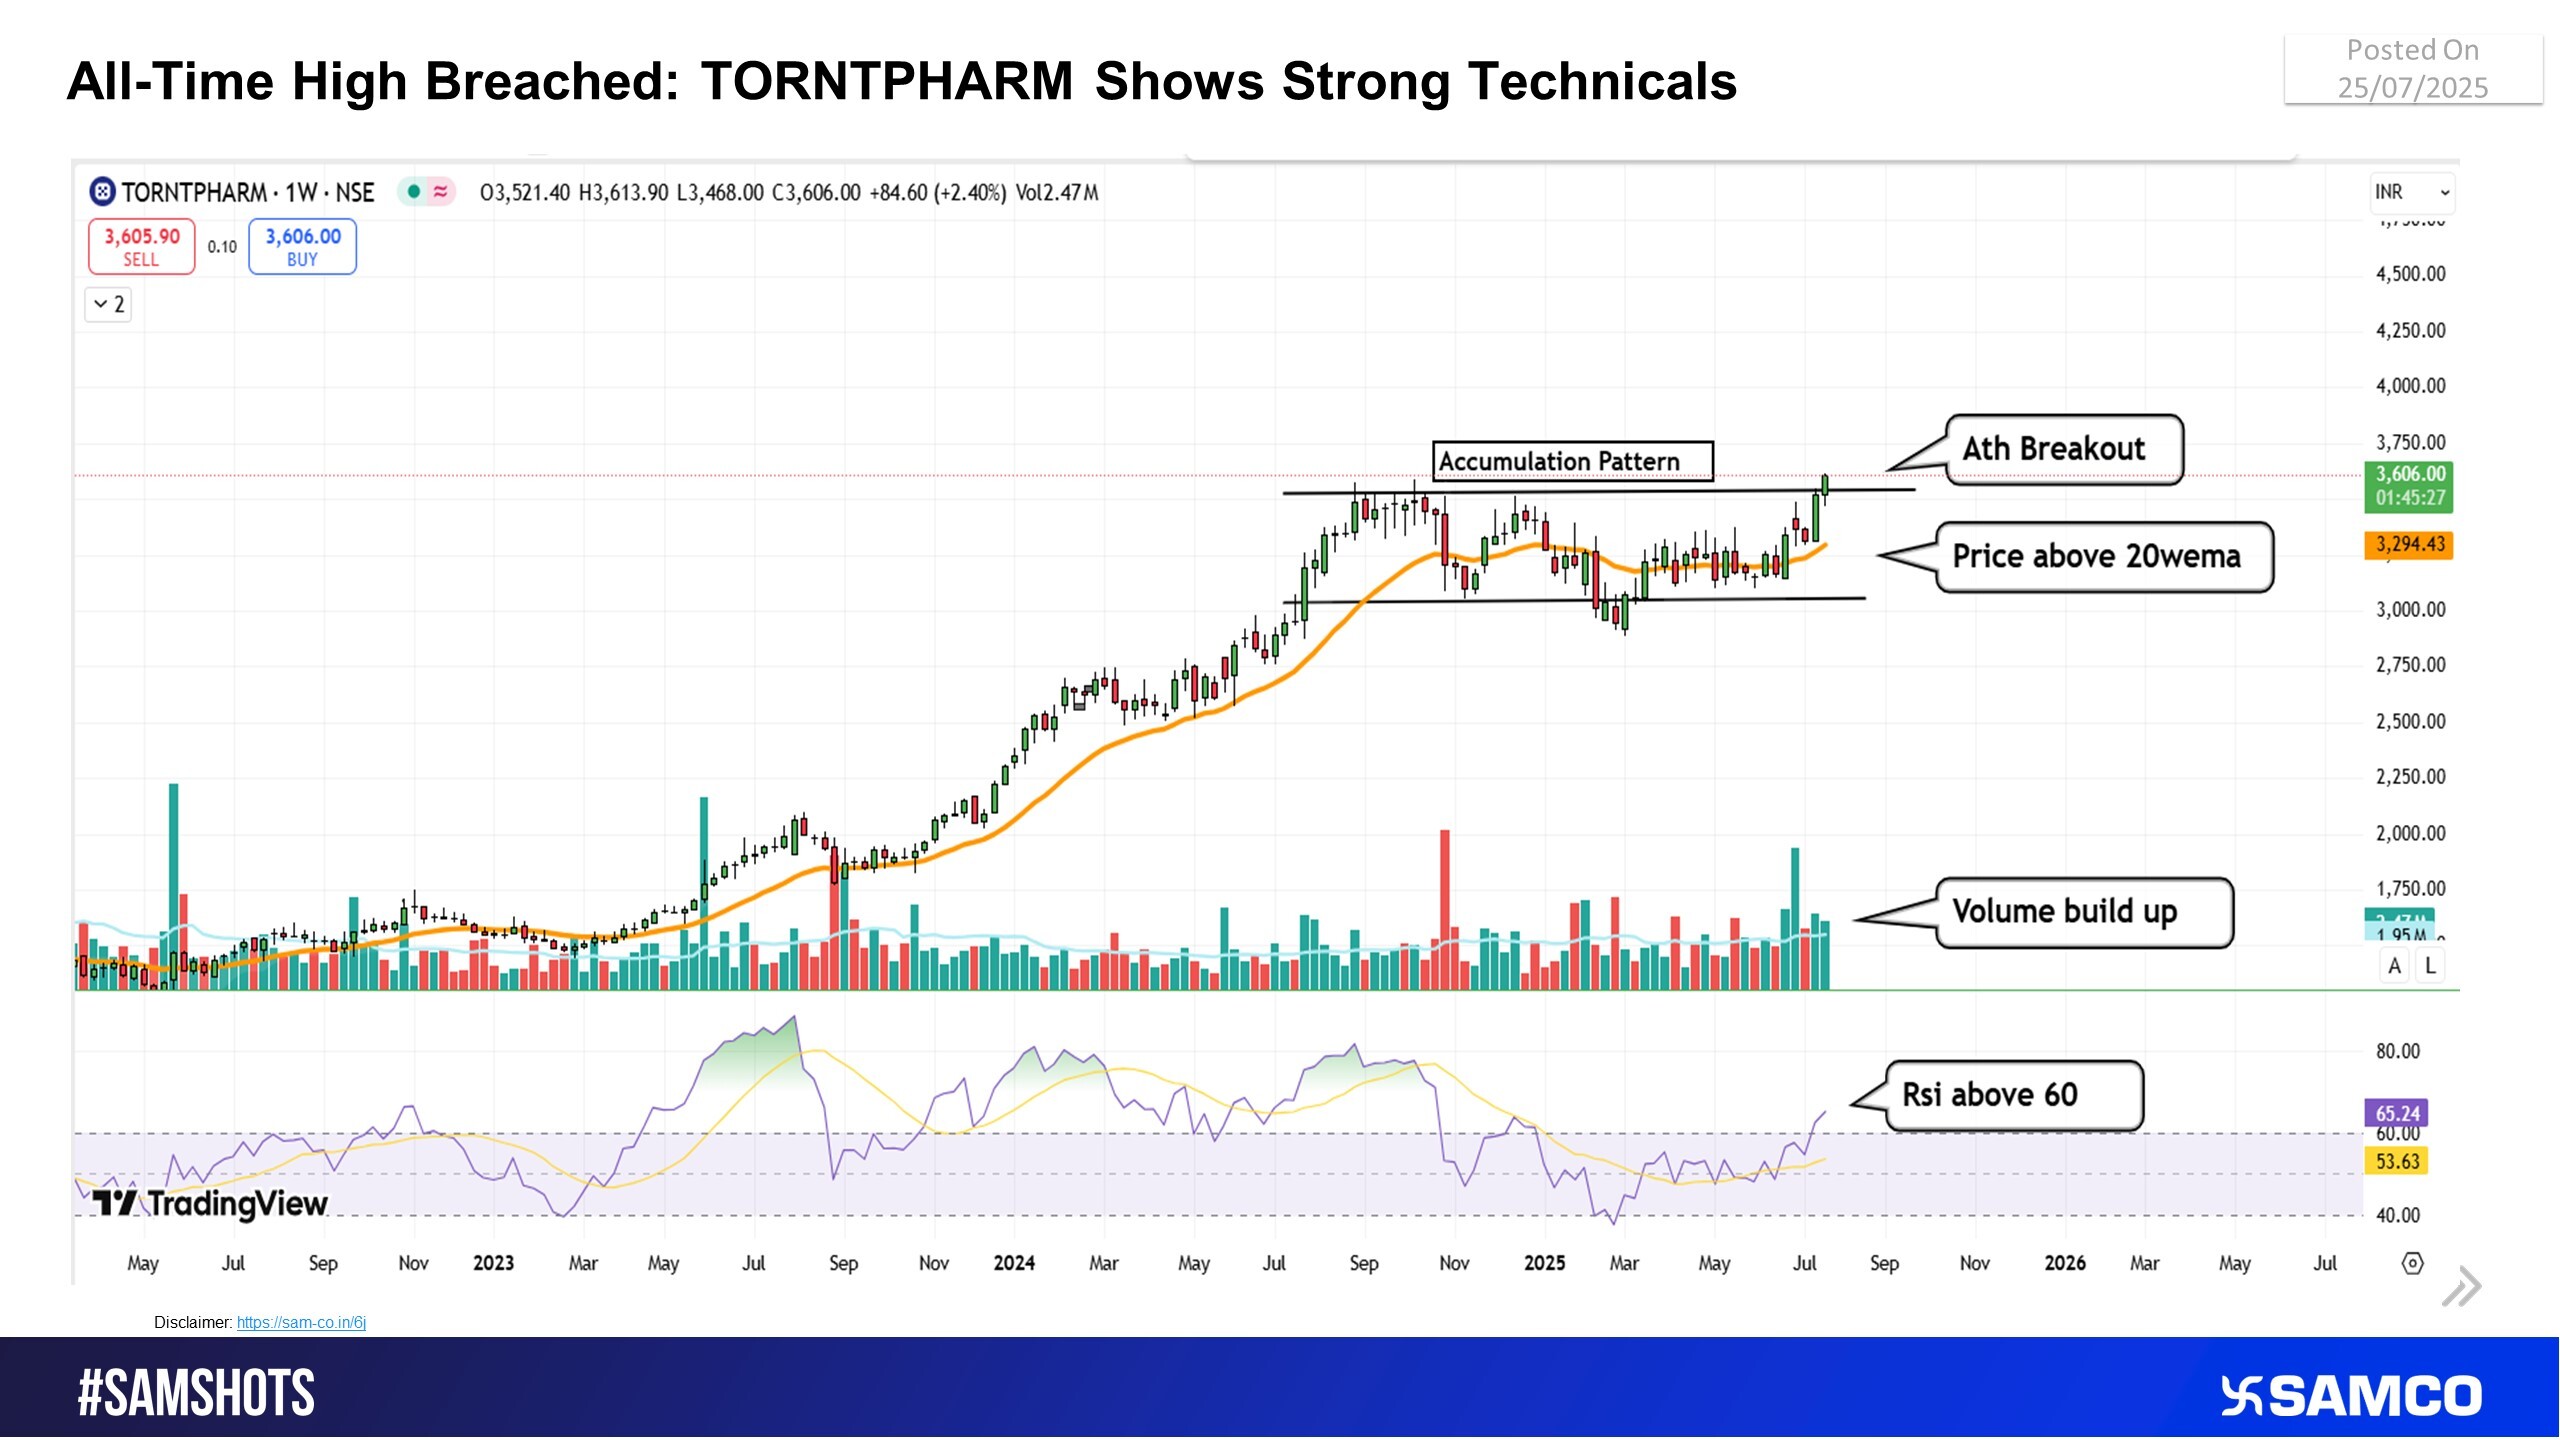
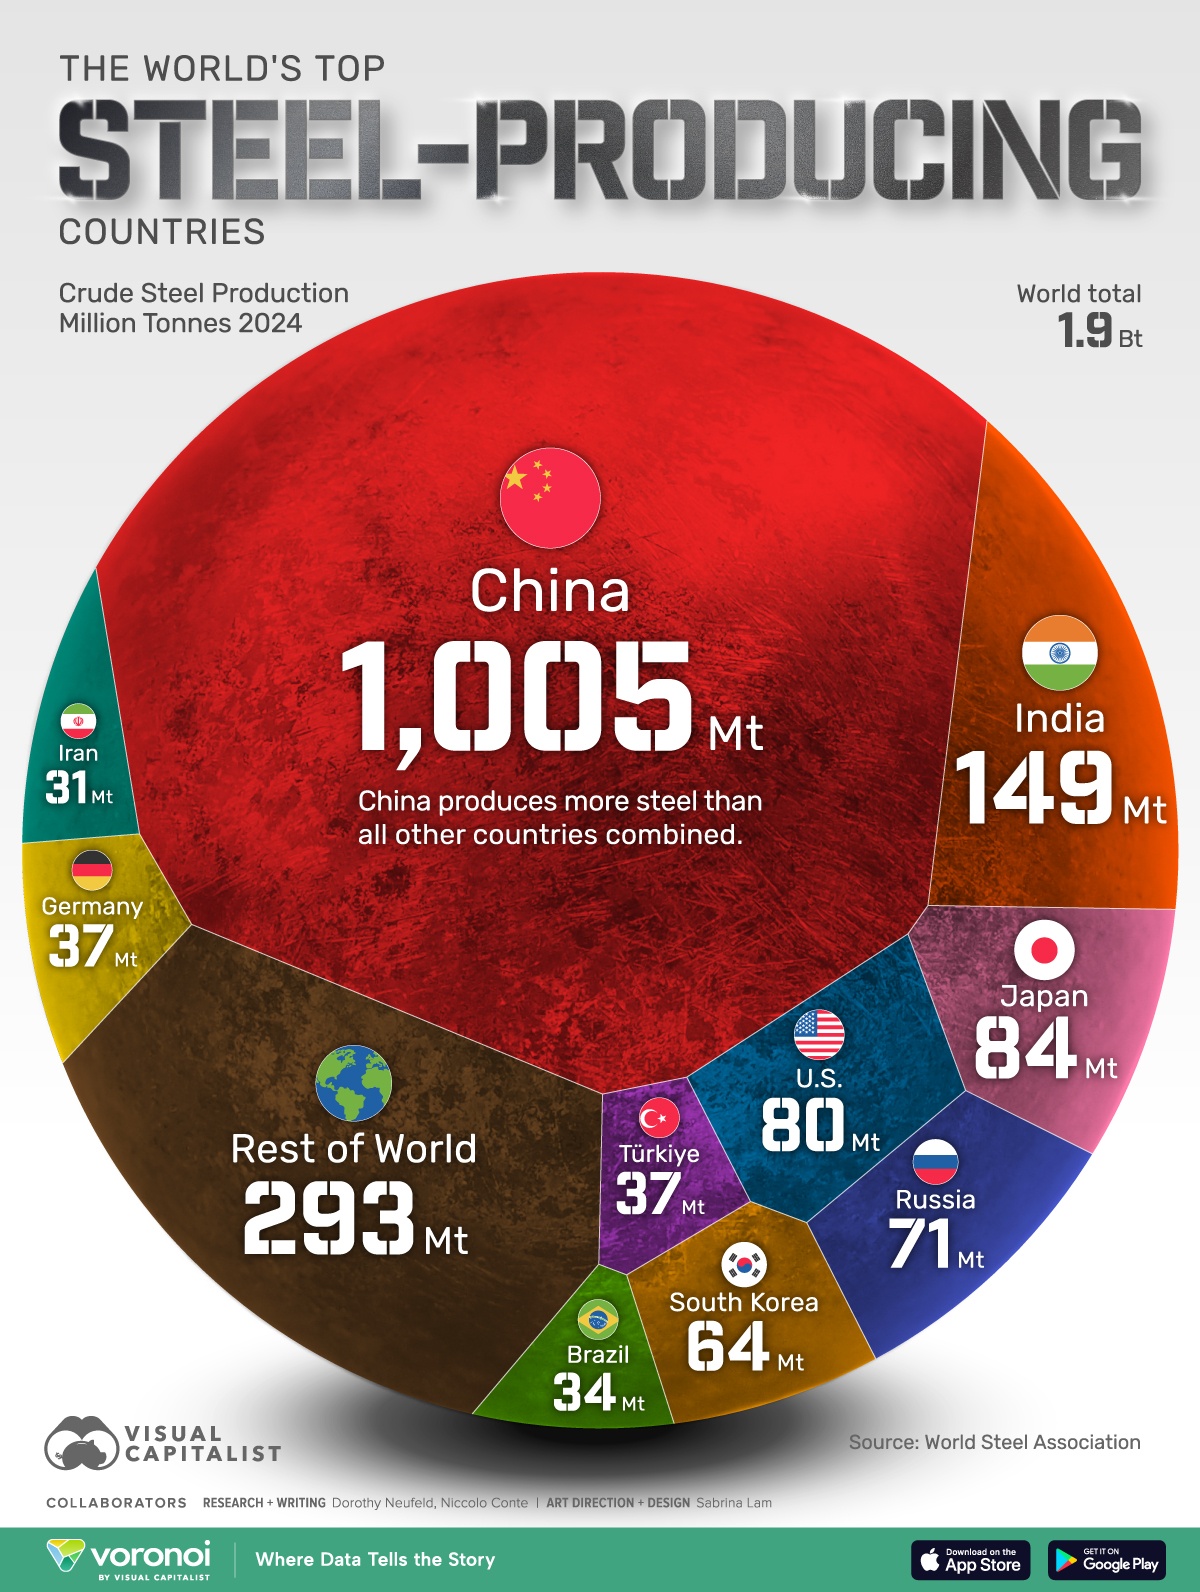
Image Source: @ VisualCap (Twitter)
 Easy & quick
1. Register on SCORES portal
2. Mandatory details for filling complaints on SCORES
Name | PAN | Address | Mobile | Number | E-mail ID
3. Benefits
Effective Communication
Speedy redressal of the grievances
