Bitcoin has started the year with a bang. It crossed US$ 30,000 a day after we stepped in to the new year. Bitcoin has tripled in a short span of 3 months.
The rally in cryptos has changed perception about gold which is trading flat after its high in August 2020. The media is gung-ho about Bitcoin and other cryptos. The ferocious rally in cryptos is making them believe cryptos will replace gold. I believe they are wrong.
It’s not a question of Bitcoin vs Gold. It’s Bitcoin and Gold vs Paper currencies.
Unprecedented money printing by global central banks is leading to rally in stocks, bonds, commodities and even cryptos.
If cryptos are racing, how can gold be left behind?
At the end of the day both gold and cryptos are a currency and a medium of exchange. There are 4-5 parameters on which a currency is evaluated.
- Purchasing Power
- Trustworthiness
- Liquidity
- Portability
- Regulatory Hurdles
Bitcoin may score almost equally with gold over purchasing power, liquidity and portability. But gold beats Bitcoin over trustworthiness and regulatory hurdles.
Thus, it’s silly to believe Bitcoin will rally and Gold won’t.
Now let’s see why I believe the time for goldbugs has come to wake-up from their sleep.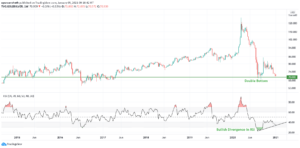
The above is Gold to Silver ratio chart in dollar terms. A ratio chart is prepared by dividing the price of one commodity with another. In this case we are dividing the price of gold with price of silver.
So, if the ratio chart moves up it means gold is outperforming silver. If it falls then silver is beating gold. You must note that here we are only considering relative outperformance and not absolute outperformance.
It could happen that when ratio is moving up both gold and silver may be moving up. But gold might be gaining more than silver.
If you want to know more about ratio charts then you can read my detailed twitter post here.
You will notice in the above chart that gold to silver ratio is trading near its important weekly support level of 70. Support is a point where demand could exceed supply.
The RSI indicator plotted in the bottom panel is also forming a bullish divergence. A bullish divergence occurs when price is in a downtrend and make a lower-low but RSI makes a higher low.
This is like a car slowing down and turning the indicator lights on before taking a U-turn. This doesn’t guarantee a reversal but chances are high.
So, from the above chart it seems gold is likely to outperform silver.
Now here’s a ratio chart of Bitcoin to Gold.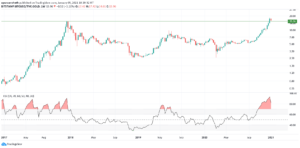
The Bitcoin to Gold ratio chart recently crossed the previous all-time high of 15.60. The momentum in Bitcoin is still strong but we saw first signs of an exhaustion. Bitcoin dropped 15% earlier this week before recovering.
The weekly RSI in the above chart is in deep overbought zones. It’s a red flag for Bitcoin bulls and an optimistic sign for goldbugs.
Now let’s check out the trend of gold back home on the MCX.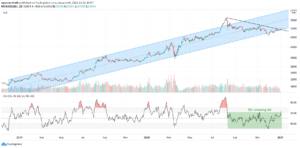
Gold is moving in a rising channel since November 2018. It is bouncing back after touching the lower edge of the channel.
It also crossed above a falling trendline drawn from the August 2020 peak. The daily RSI is picking up momentum. It crossed the 60 mark for the first time in 5 months.
Thus, all the above suggests goldbugs should wake-up from their sleep and smell the coffee before its too late.
 Easy & quick
Leave A Comment?