

In this article, we will discuss:
- What is a Hammer Candlestick Pattern?
- How Does a Hammer Candlestick Work?
- Types of Hammer Candlestick Patterns?
- Hammer Candlestick Pattern: Explained with Example
- Pros and Cons of Hammer Candlestick Pattern
- Conclusion
- Frequently Asked Questions
Traders often use chart patterns in conjunction with technical analysis tools to decide whether they should buy, sell or hold an asset. Candlestick patterns are a reflection of the market’s psychology - by studying the historical price movements of an asset, you can get insights into its future price directions. In this regard, the hammer candlestick pattern is a significant bullish trading pattern that helps traders identify possible trading opportunities. Let’s find out more about it.
What is a Hammer Candlestick Pattern?
The hammer candlestick is a type of bullish reversal chart pattern that suggests that the price of a stock has hit its ground bottom and is poised for an imminent trend reversal. It is named so because it indicates that the market is hammering out at the bottom before a potential reversal.
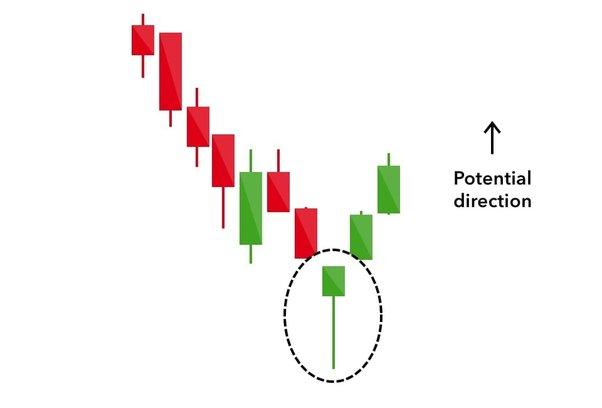
A hammer consists of a small real body at the upper end of the trading range with a long lower shadow. The longer the lower shadow, the more bullish the trend.
How Does a Hammer Candlestick Work?
A hammer candlestick gets formed when the closing price of a stock is above its opening price. This primarily happens when sellers enter the market during a price decline. When the closing time of the market comes, buyers absorb selling pressure and push the market price above the opening price.
Hammer candlesticks indicate a potential bullish price reversal. It should be noted that the price must start moving up following the hammer to indicate confirmation of the pattern.
Hammer candlesticks usually have relatively small bodies with long wicks. The wicks are typically at least two times longer than the candle's actual body. The greater the length of the wick, the stronger the reversal in price trend.
What are the Types of Hammer Candlestick Patterns?
The primary types of hammer candlestick patterns have been explained below:
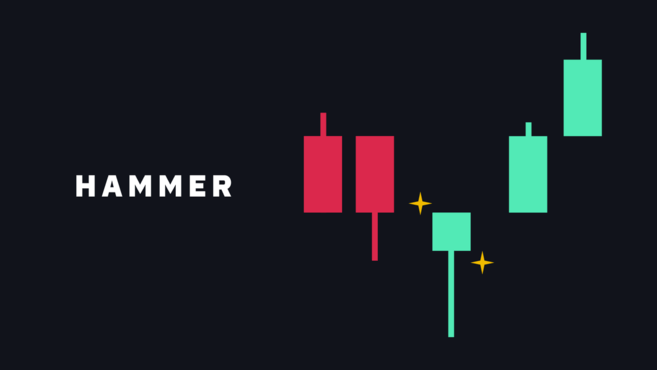
- Bullish candlestick hammer: This bullish candlestick pattern gets formed when the closing price goes above the opening price, indicating that the buying strength had more power before the market closed.
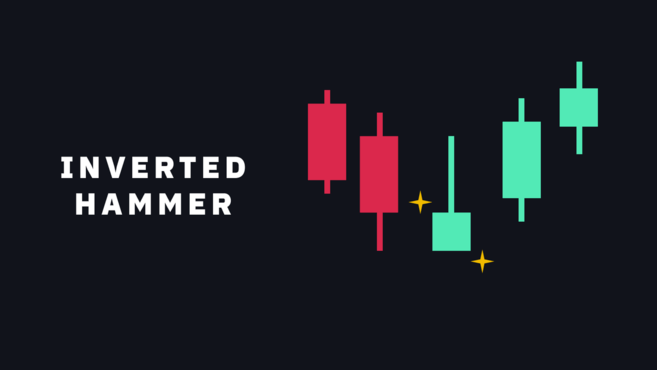
- Bullish Inverted hammer: An inverted hammer occurs when the opening price goes below the closing price. This is a bullish reversal pattern that appears after a downtrend; it indicates that the buying pressure was dragged down just before the closing of the market.
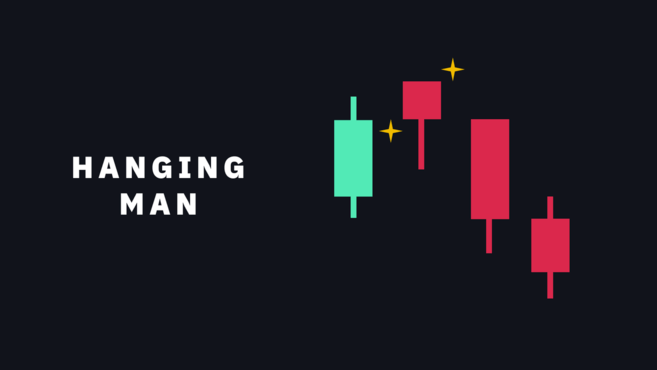
- Bearish candlestick hammer: Also known as the hanging man, this pattern occurs when the opening price goes above the closing price, resulting in a red candle. This primarily happens when the market experiences selling pressure, indicating a potential negative trend reversal.
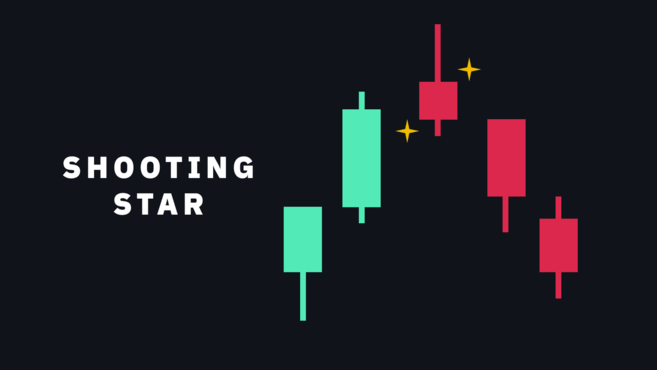
- Bearish inverted hammer: Also called a shooting star candlestick, this pattern looks just like a regular inverted hammer, but it indicates that there are chances of a bearish trend reversal instead of a bullish one. One can notice this pattern when the opening price of an asset goes above the closing price.
Hammer Candlestick Pattern: Explained with Example
Let us look at a hammer candlestick example to understand it better:
Let’s say Mr. Ram is tracking the price movements of ABC stock. After studying the candlestick chart for the stock, he identified a bullish hammer in a downtrend after three bearish candlesticks. Thinking it is an indicator of a trend reversal, Mr. Ram buys 100 shares of ABC at Rs. 100 per share. After placing the buy order, the stock’s price jumped due to the expected uptrend. He sold all the shares at Rs.120 per share and made a profit of Rs. 2000.
As noted above, a hammer candlestick pattern appears in a downtrend, i.e., when the price of a stock is facing a noticeable decline. This pattern indicates that the market is facing a downtrend during a particular period, and it is estimated to witness a pullback before the closing.
When a hammer forms after at least three bearish candles, it typically indicates a bullish trend reversal. By identifying such signals and entering and exiting the market at the right time, traders can take a suitable position in the market and leverage it.
Pros and Cons of Hammer Candlestick Pattern
The hammer candlestick pattern has its own set of benefits and limitations for traders. Let’s see them below:
Pros
- This chart pattern is easy to identify.
- It indicates a change in bullish/bearish momentum in the prevailing market trend.
- It is a reliable chart pattern that works in accordance with a confirmation. It also goes well with other technical analysis tools.
Cons
- This candlestick pattern might send a false signal if it is observed in isolation and there’s no confirmation. The price could still keep dropping even after a hammer.
- A hammer candlestick pattern alone will not guarantee successful trading. Traders must use it with other analysis tools to make an informed decision.
Conclusion
Like other candlestick patterns, the hammer candlestick pattern has its advantages and disadvantages. The most significant drawback of this classic chart pattern is that it could provide false signals. This is why it is of utmost importance to draw on a broader range of technical analysis tools before arriving at any decision.
In this regard, the Samco New-gen app can help you place your trades smoothly while ensuring you stay updated with the latest changes in the price trends. You can open an online demat account and a trading account by following a few easy steps and place your orders on the go. Download the Samco app to enjoy a hassle-free trading journey!
Frequently Asked Questions
Does it matter what colour the hammer candlestick is?
Ans. No, as long as the proportion of shadow to the actual body is maintained, the colour of the hammer is not that important. However, it is better if the previous movement of the hammer was bearish in nature.
What is confirmation of a hammer candlestick signal?
Ans. Confirmation of a signal happens when subsequent price action confirms the expectation of a trend reversal. In other words, the candlestick formed just after the hammer signal should confirm the bullish price trend. Traders hoping to profit from a hammer signal often place buy orders during the formation of this upward confirmation candle.
What’s the difference between Doji and Hammer Candlestick?
Ans. A Doji candlestick opens and closes at the same price; it is basically like a hammer without an actual body. Doji chart patterns usually signify price continuation or market indecision.
What is the success rate of a hammer candlestick?
Ans. The success rate of hammer candlesticks is usually around 50%. This is why it is important for traders to confirm the signal with other trading tools before making any decision.
How to trade with a hammer candlestick pattern?
Ans. There are two things that you can do after spotting a confirmed hammer candlestick pattern:
- Place your order as soon as the hammer gets formed, and wait for the trend reversal to start. Make sure to exit the trade strategically.
- Wait for a second confirmation candle. If it's a green candle, enter the trade to leverage the reversal.
Disclaimer: INVESTMENT IN SECURITIES MARKET ARE SUBJECT TO MARKET RISKS, READ ALL THE RELATED DOCUMENTS CAREFULLY BEFORE INVESTING. The asset classes and securities quoted in the film are exemplary and are not recommendatory. SAMCO Securities Limited (Formerly known as Samruddhi Stock Brokers Limited): BSE: 935 | NSE: 12135 | MSEI- 31600 | SEBI Reg. No.: INZ000002535 | AMFI Reg. No. 120121 | Depository Participant: CDSL: IN-DP-CDSL-443-2008 CIN No.: U67120MH2004PLC146183 | SAMCO Commodities Limited (Formerly known as Samruddhi Tradecom India Limited) | MCX- 55190 | SEBI Reg. No.: INZ000013932 Registered Address: Samco Securities Limited, 1004 - A, 10th Floor, Naman Midtown - A Wing, Senapati Bapat Marg, Prabhadevi, Mumbai - 400 013, Maharashtra, India. For any complaints Email - grievances@samco.in Research Analysts -SEBI Reg.No.-INHO0O0005847


 Easy & quick
Leave A Comment?