


People often believe that a cash flow statement shows a company's profitability. But that’s not the case…they are two different things.
A cash flow statement lists only the cash inflows and outflows. It helps us understand where the cash is coming in and where the company is spending it. While the income statement lists cash as well as credit income and expenses.
A cash flow statement helps an investor analyze a company's liquidity. While the income statement helps analyze the profitability.
So, what if we can skip the cash flow statement and instead focus on the income statement only?
The answer is simple. No, we can’t skip the cash flow statement. The reason behind the same is simpler!
Let’s understand this with an example -
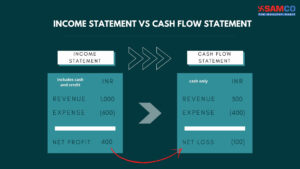 In this example, the company’s income statement shows a net profit of Rs. 400. But when we look at cash transactions in isolation, the company is incurring a loss of Rs. 100.
How to interpret this information? Does this mean that the company is not safe to invest in? We will learn that in this article.
The above example explains why we must analyze the cash flow statement. Cash flow tells us if the company has enough cash to pay its expenses to avoid insolvency.
Cash Flow Statement Format:
There are three sources of cash flow -
In this example, the company’s income statement shows a net profit of Rs. 400. But when we look at cash transactions in isolation, the company is incurring a loss of Rs. 100.
How to interpret this information? Does this mean that the company is not safe to invest in? We will learn that in this article.
The above example explains why we must analyze the cash flow statement. Cash flow tells us if the company has enough cash to pay its expenses to avoid insolvency.
Cash Flow Statement Format:
There are three sources of cash flow -
- Cash Flow from Operating Activity
- Cash Flow from Investing Activity
- Cash Flow from Financing Activity
 Let’s break this down and understand how to analyze this statement.
- Cash Flow from Operating Activities
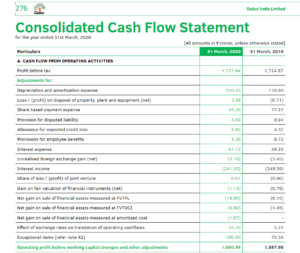 Operating activities include the company’s day-to-day activities that create revenues. It begins with the profit before tax amount from the income statement. Here, we add back all the non-cash items to arrive at a cash-based figure.
In simple words, cash flow from operating activities works backward to achieve a cash figure.
For example, depreciation is a non-cash expense. It was deducted as an expense in the income statement. In the cash flow statement, depreciation is added back to the profit before the tax’s figure. Similarly, interest income is added in the income statement but subtracted in the cash flow statement.
Operating activities include the company’s day-to-day activities that create revenues. It begins with the profit before tax amount from the income statement. Here, we add back all the non-cash items to arrive at a cash-based figure.
In simple words, cash flow from operating activities works backward to achieve a cash figure.
For example, depreciation is a non-cash expense. It was deducted as an expense in the income statement. In the cash flow statement, depreciation is added back to the profit before the tax’s figure. Similarly, interest income is added in the income statement but subtracted in the cash flow statement.
- Effects of exchange rates on translations of operating cash flows:
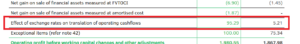 We can see that Dabur India’s effects of exchange rates on translations increased from Rs. 5.21 crores to Rs. 95.29 crores. That is a huge addition to operating activities' cash flow. What we must check next is if this was a one-time event. Find the past five years data and observe the foreign operations volumes.
- Adjustment for changes in working capital:
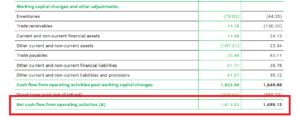 Working Capital is the amount required to run the daily business operations. It gives you a quick idea about the liquidity of the business.
Working Capital = Current Assets - Current Liabilities
If the working capital is in line with the industry average, it is considered favorable. Whereas low working capital compared to the industry average is considered risky. It indicates that the company cannot generate enough revenues for short-term requirements.
Working Capital is the amount required to run the daily business operations. It gives you a quick idea about the liquidity of the business.
Working Capital = Current Assets - Current Liabilities
If the working capital is in line with the industry average, it is considered favorable. Whereas low working capital compared to the industry average is considered risky. It indicates that the company cannot generate enough revenues for short-term requirements.
- Net cash flow from operating activities
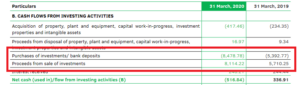
- Purchase of investments
- Sale of investments
- Net cash flow from investing activities
 Though it generated a negative cash flow for the current year, this kind of expenditure has future economic inflows. The future implications of current investment look brighter.
- Cash Flow from Financing Activities
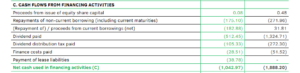
- Repayment of Borrowing
- Dividend Paid
- Net cash flow from financing activities
 In 2019, net cash flow from financing activities was negative Rs. 1,888.20 crores. In 2020, there is a sharp drop. . Though the net cash flow from financing activities is negative, it is less than the previous year. This is a sign that the company spent less on financing activities.
We can trace this back to that in 2019, Dabur India Limited paid out Rs. 1,324.71 crores as dividend. In 2020, the dividend payments went down to Rs. 512.45 crores. This ultimately reflected in the net cash flow amount.
4. Net cash flow all activities combined
In 2019, net cash flow from financing activities was negative Rs. 1,888.20 crores. In 2020, there is a sharp drop. . Though the net cash flow from financing activities is negative, it is less than the previous year. This is a sign that the company spent less on financing activities.
We can trace this back to that in 2019, Dabur India Limited paid out Rs. 1,324.71 crores as dividend. In 2020, the dividend payments went down to Rs. 512.45 crores. This ultimately reflected in the net cash flow amount.
4. Net cash flow all activities combined
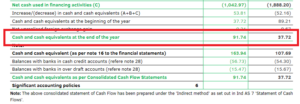 When combining cash flows from all three activities, the balance is Rs. 91.74 crores. This is the net balance cash the company has at the end of the financial year. We can see a huge increase from Rs. 37.72 crores in 2019 to Rs. 91.74 crores in 2020. An increase of almost 143.21%. This is a massive improvement and a good sign for a company.
Conclusion:
Cash flow statement analysis helps us understand the cash operations of a business. You need enough cash in hand to ensure smooth functioning to run and grow a business.
One disadvantage is that one cannot have a complete picture if we study the cash flow alone. You need an income statement as well as a balance sheet to understand the transactions better. Only cash flow analysis would not be able to give you the right picture of a company. Look for net cash inflow, but also make sure that you have checked how profitable the company is over the years.
To understand a company’s performance, analyze all their financial statements. Compare past trends with the help of ratio analysis for a deeper insight. Start by reading their balance sheet and observe what a company owns and how much it owes to others.
Also Read:
How to Read an Annual Report of a Company
How to Read & Analyse a Balance Sheet of a Company – Dabur India Limited
How to Read & Analyse an Income Statement – Dabur India Limited
When combining cash flows from all three activities, the balance is Rs. 91.74 crores. This is the net balance cash the company has at the end of the financial year. We can see a huge increase from Rs. 37.72 crores in 2019 to Rs. 91.74 crores in 2020. An increase of almost 143.21%. This is a massive improvement and a good sign for a company.
Conclusion:
Cash flow statement analysis helps us understand the cash operations of a business. You need enough cash in hand to ensure smooth functioning to run and grow a business.
One disadvantage is that one cannot have a complete picture if we study the cash flow alone. You need an income statement as well as a balance sheet to understand the transactions better. Only cash flow analysis would not be able to give you the right picture of a company. Look for net cash inflow, but also make sure that you have checked how profitable the company is over the years.
To understand a company’s performance, analyze all their financial statements. Compare past trends with the help of ratio analysis for a deeper insight. Start by reading their balance sheet and observe what a company owns and how much it owes to others.
Also Read:
How to Read an Annual Report of a Company
How to Read & Analyse a Balance Sheet of a Company – Dabur India Limited
How to Read & Analyse an Income Statement – Dabur India Limited


 Easy & quick
Leave A Comment?