
The Nifty 50 recently hit a new all-time high of 26,310.45 on 27 November 2025, surpassing its previous peak after 426 days. While this milestone signals strength on the surface, the broader market paints a completely different picture.
Despite the benchmark index touching fresh highs, market breadth remains weak, and gains are largely concentrated in a handful of large-cap names. This is why investors with higher exposure to mid-cap and small-cap stocks continue to experience flat or negative returns even as the index climbs.
What Sectoral Breadth Tells Us
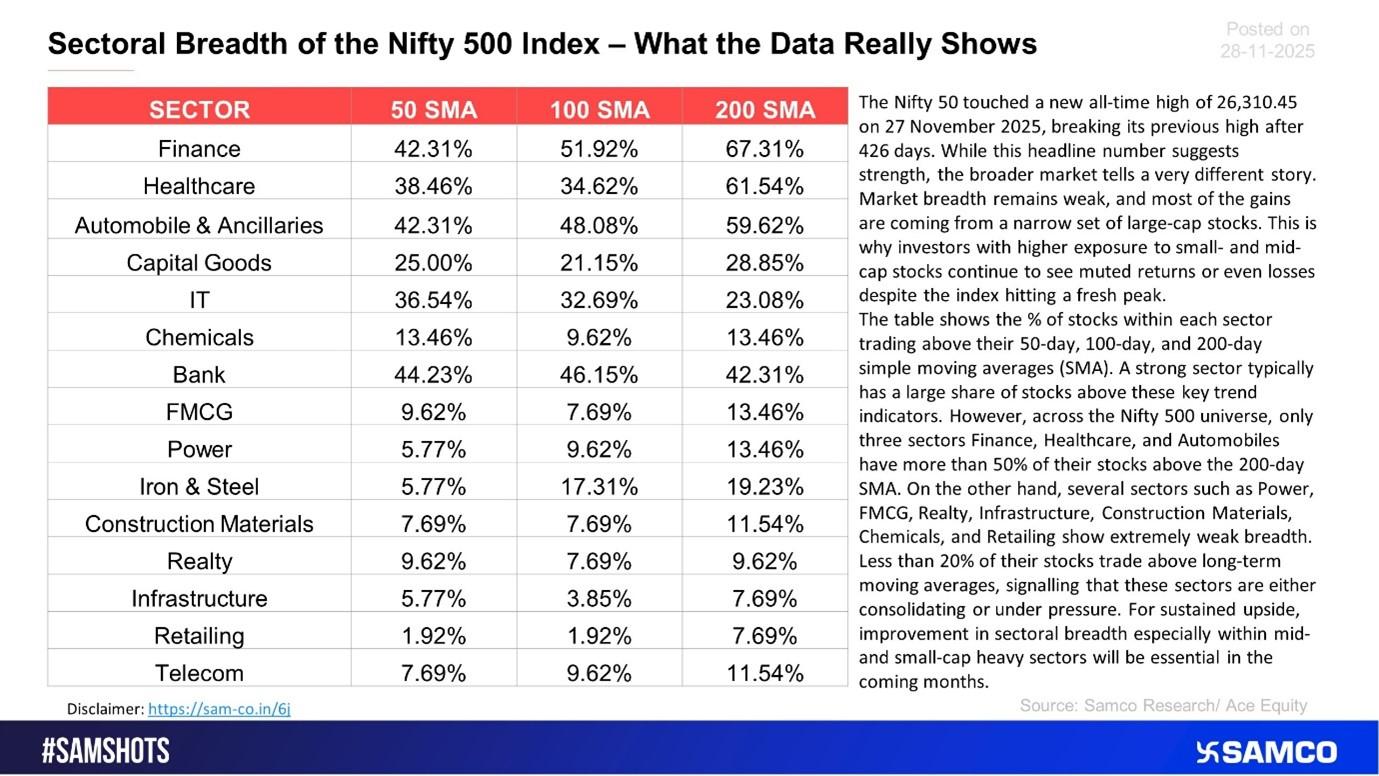
The table highlights the percentage of Nifty 500 stocks in each sector trading above their 50-day, 100-day, and 200-day Simple Moving Averages (SMA).
These averages help identify whether a sector is in an uptrend, consolidating, or under pressure.
Key Insight:
A healthy or strong sector generally sees a large proportion of stocks trading above their major moving averages.
However, the sectoral data shows mixed to weak participation across the broader market.
Sectors Showing Stronger Breadth
Across the Nifty 500, only three sectors have more than 50% of their stocks above the 200-day SMA:
- Finance
- Healthcare
- Automobile & Ancillaries
These sectors are displaying relatively better strength and stability, contributing significantly to index-level performance.
Sectors Showing Weak or Very Weak Breadth
Several sectors are showing extremely poor participation, with less than 20% of their stocks trading above long-term moving averages:
- Power
- FMCG
- Realty
- Infrastructure
- Construction Materials
- Chemicals
- Retailing
Such low levels indicate that these sectors are either in consolidation, facing downward pressure, or are yet to recover meaningfully from previous corrections.
What This Means for Investors
Weak sectoral breadth signals that the market rally is narrow, driven by select large-cap names rather than broad participation.
For the market to enter a stable and sustainable uptrend, mid-cap and small-cap heavy sectors must show improvement, especially in long-term indicators such as the 200-day SMA.
Until broader participation returns, investors heavily allocated to sectors with weak breadth may continue to experience underperformance, even as headline indices make new highs.


 Easy & quick
Leave A Comment?