After three consecutive weeks of gains, Indian equities lost steam as selling pressure gripped Dalal Street. The Nifty 50 closed the week down 2.65%, marking a sharp reversal, with all trading sessions ending in the red. The downturn was aggravated by fresh trade tensions, as U.S. President Donald Trump announced additional tariffs on Indian pharma exports and heavy vehicles, weighing heavily on investor sentiment.
Adding to the pressure, the Nifty IT index plunged 7.86%, its steepest weekly fall in months, amid concerns over the proposed hike in H-1B visa fees for tech workers. Broader indices fared no better, with the Nifty Midcap 100 and Nifty Microcap 250 falling 4.60% and 4.49% respectively, underlining the widespread market weakness.
Meanwhile, precious metals continued their relentless rally as safe-haven demand surged. Gold hit an all-time high of ?114,179 per 10 g on September 23 (Tuesday), while silver followed suit with a record ?138,184 per kg on September 26 (Friday).
September 23 also marked one of the busiest days in India’s capital markets, with 10 IPOs across diverse sectors—including Jaro Education, Solarworld, and Anand Rathi—collectively raising over ?2,700 crore.
On a sectoral basis, FMCG (-2.53%), Auto (-2.70%), Pharma (-5.23%), and Realty (-6.10%) dragged indices lower, while Metals (-1.02%) and PSU Banks (-1.84%) showed relative resilience.
Scroll down to understand more of such market news and perspectives for the week gone by in easily understandable charts.
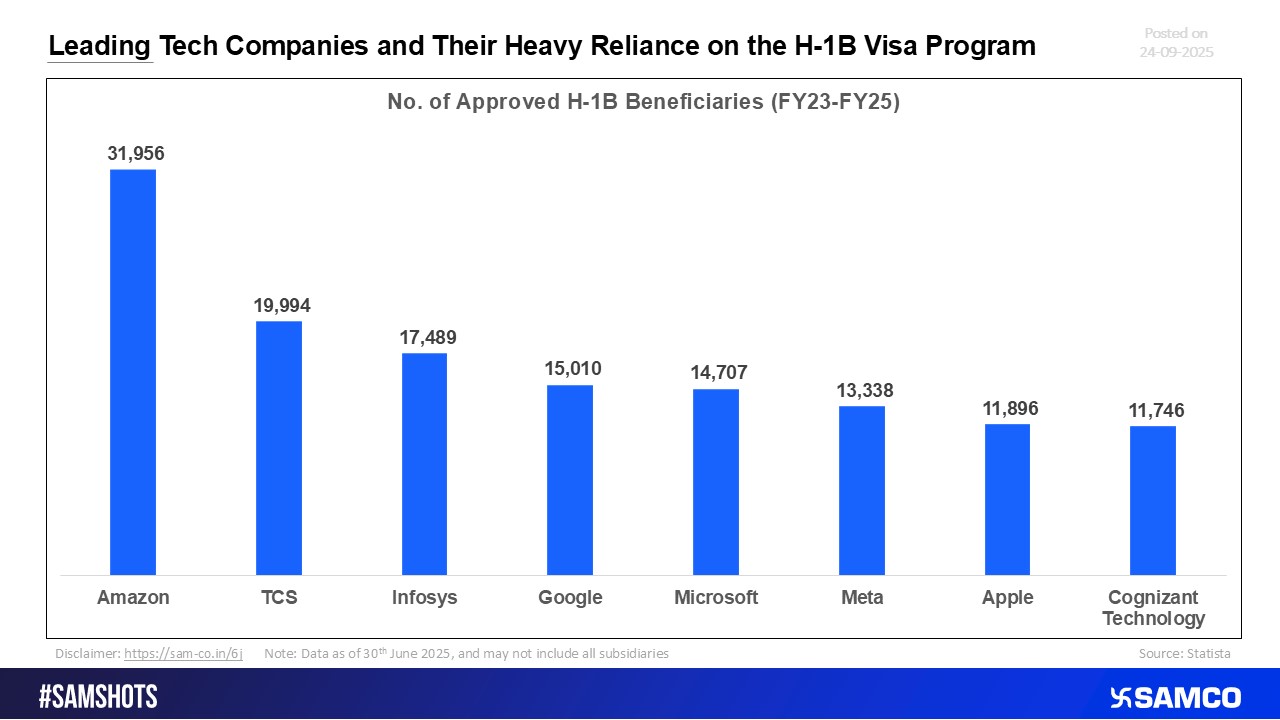
Top Technology Firms and Their Strong Dependence on the H-1B Visa Program


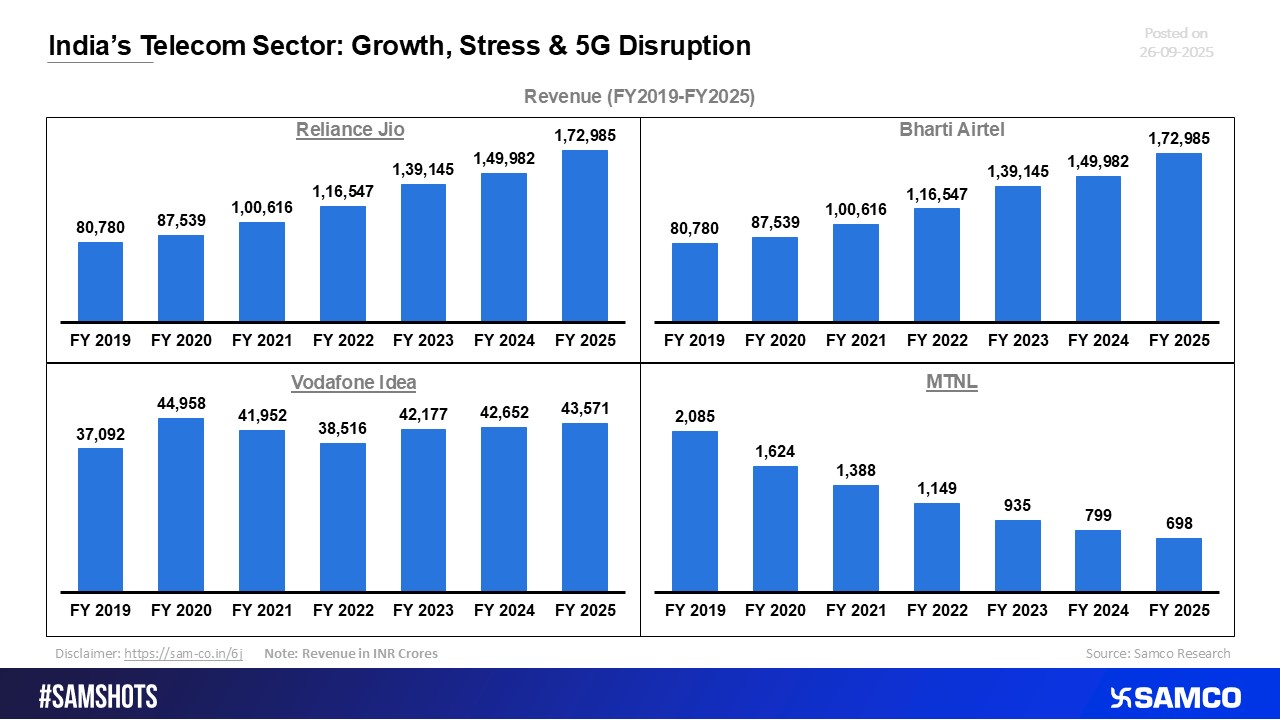
India’s Telecom Industry: Expansion, Challenges & the 5G Shake-Up
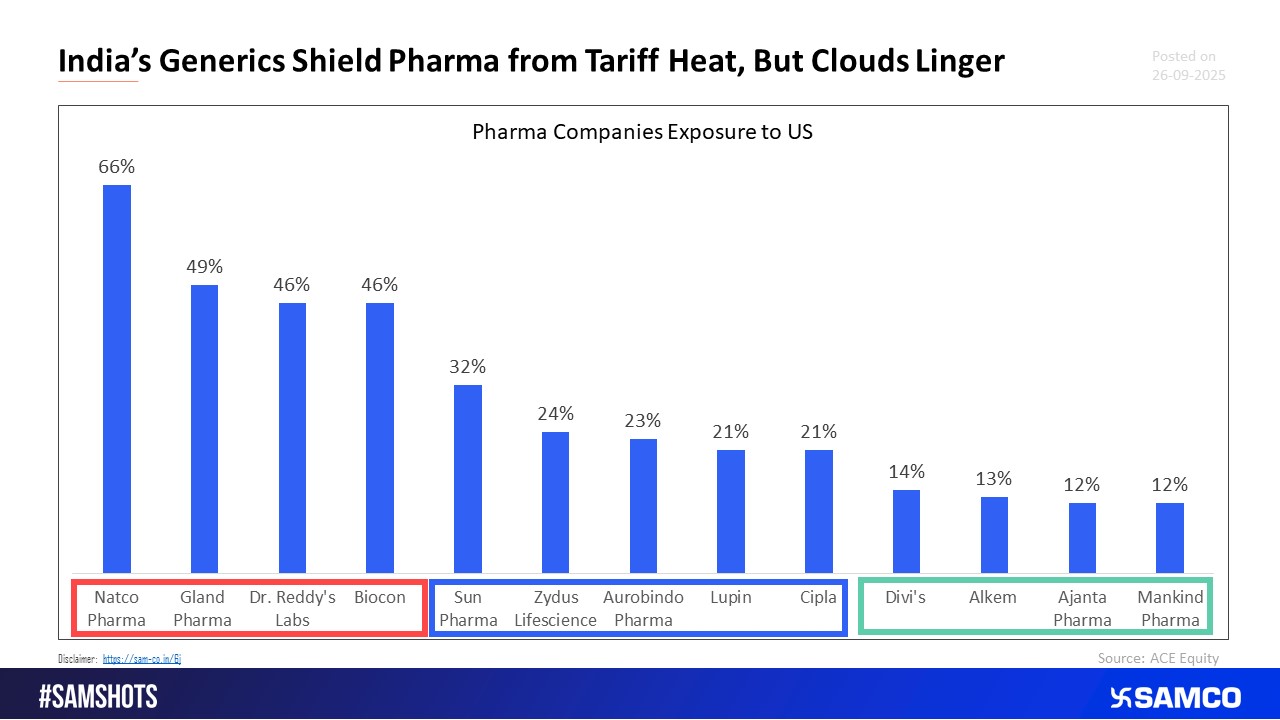
US Tariffs Jolt Pharma Sentiment, Generics Remain the Key Risk
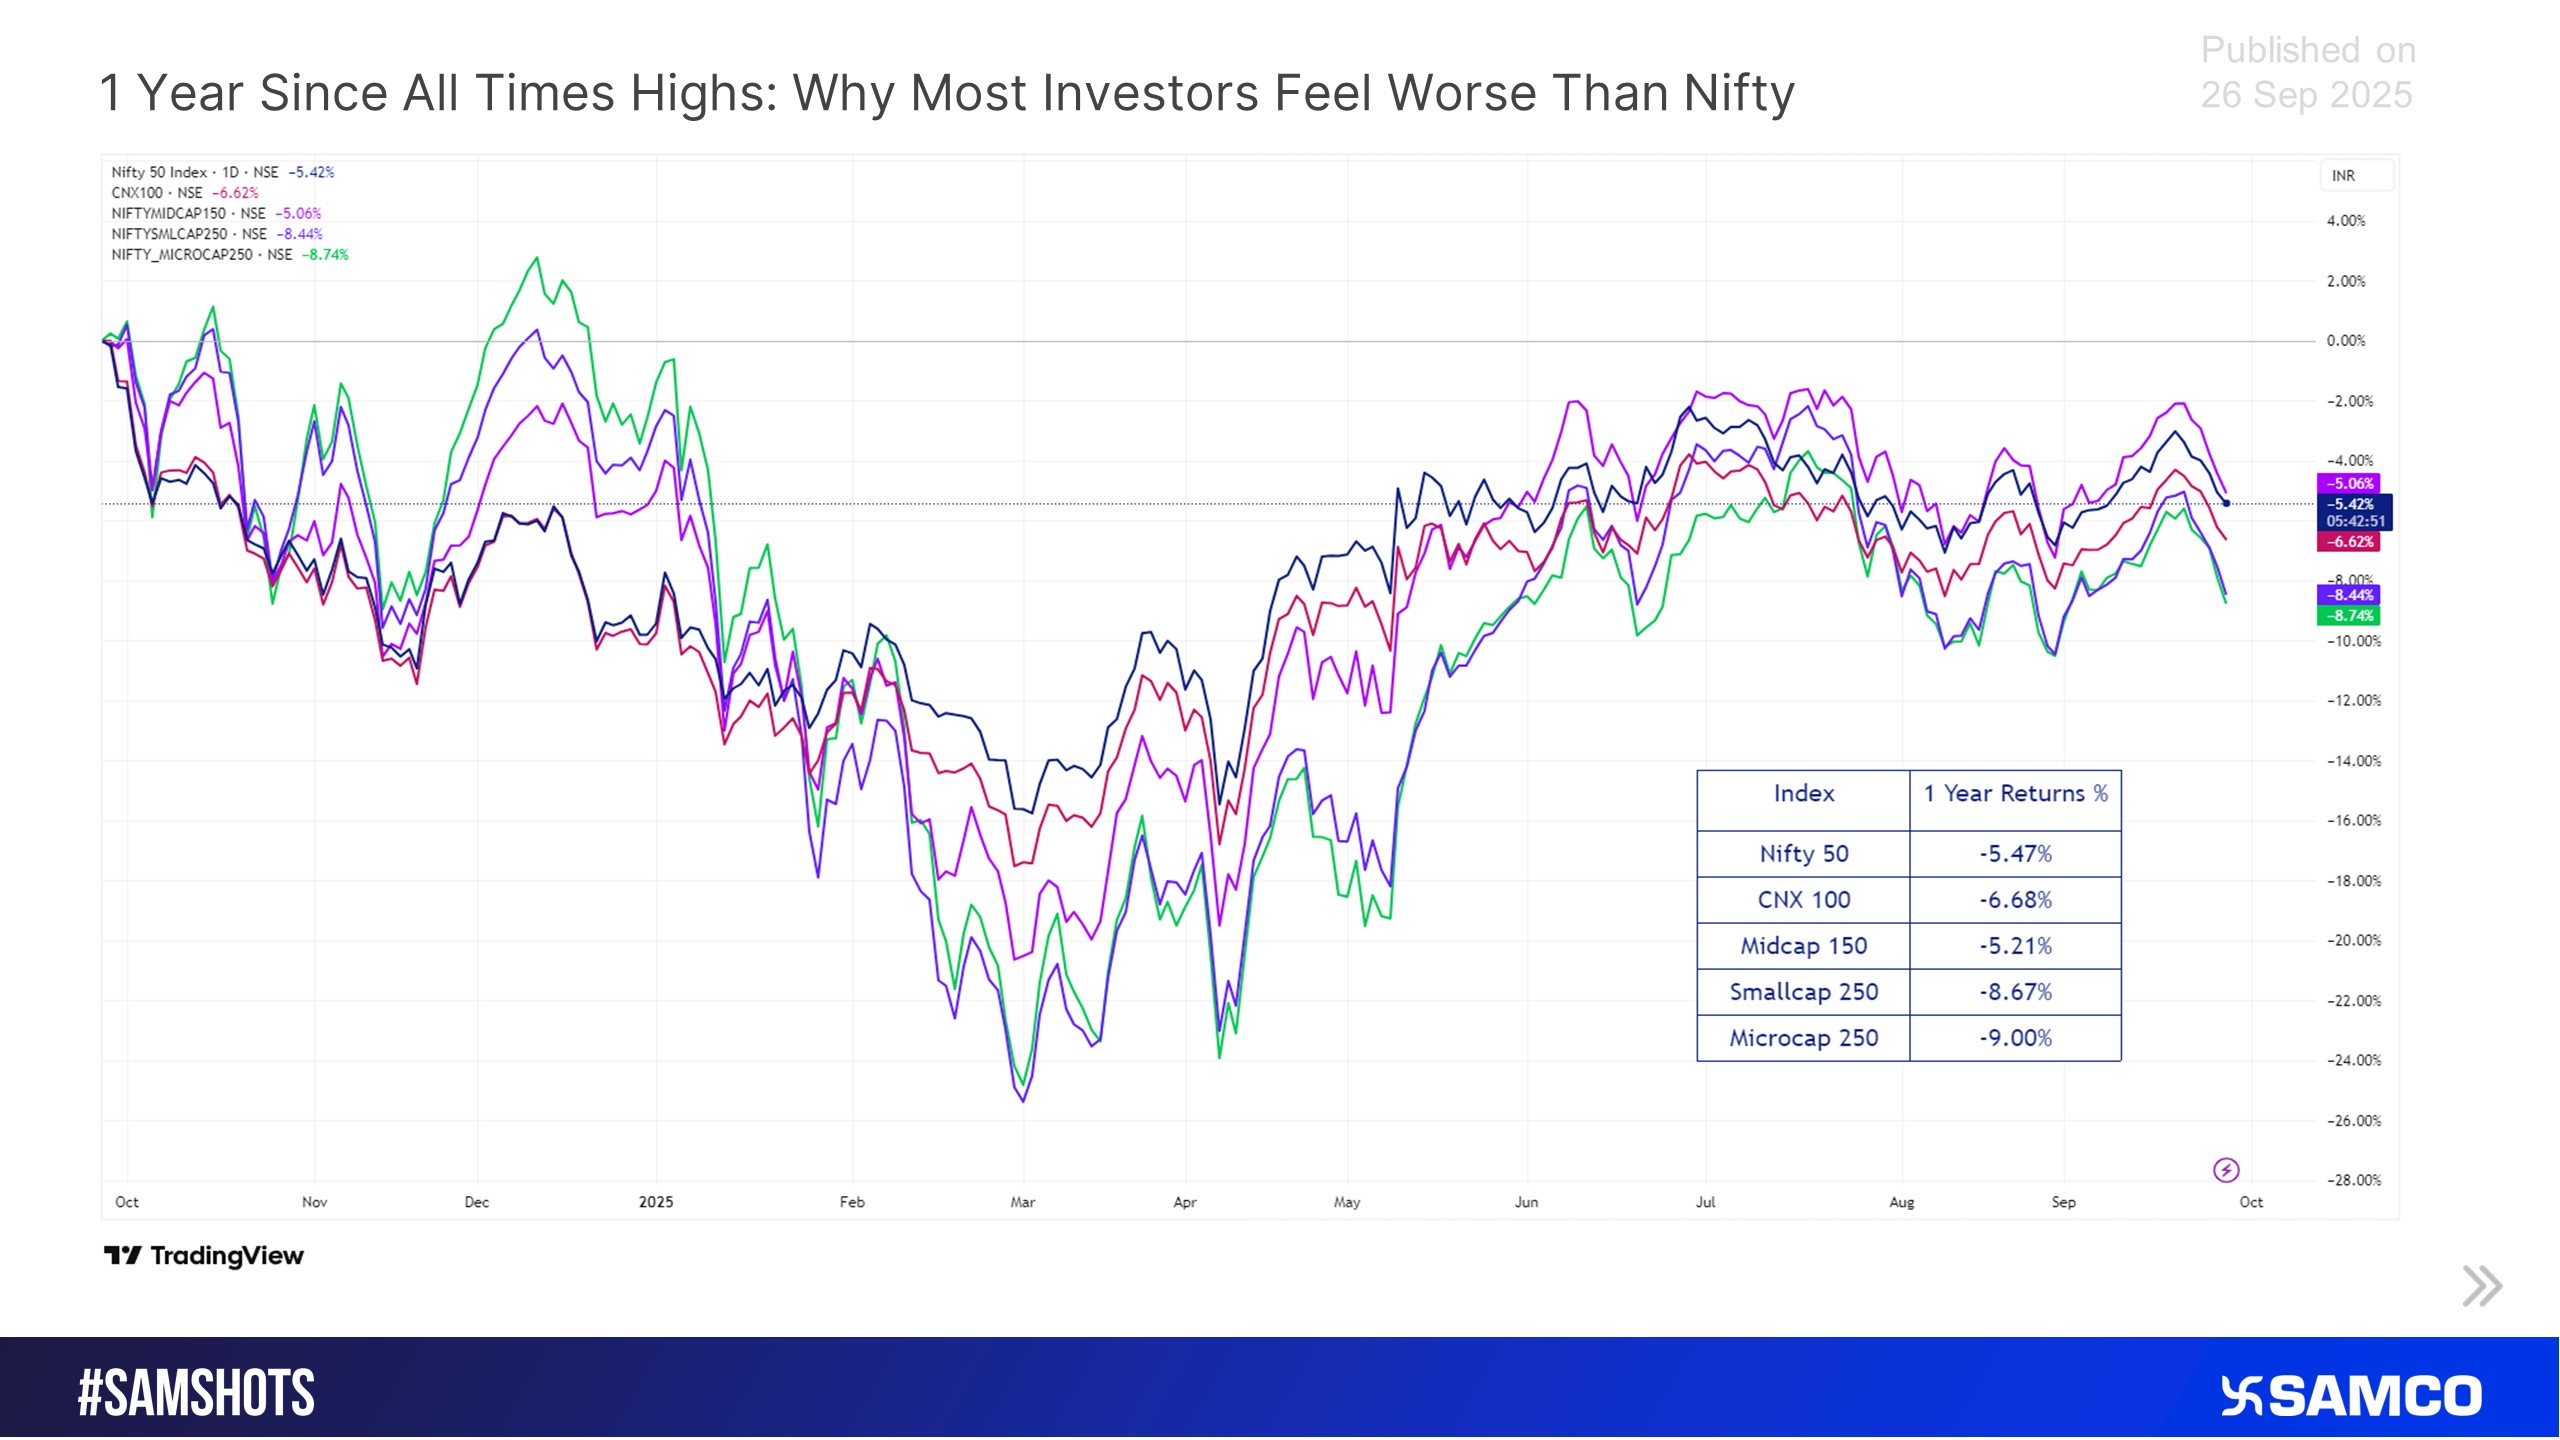
A Year After Market Peaks, Investor Sentiment Trails the Nifty\'s Performance.
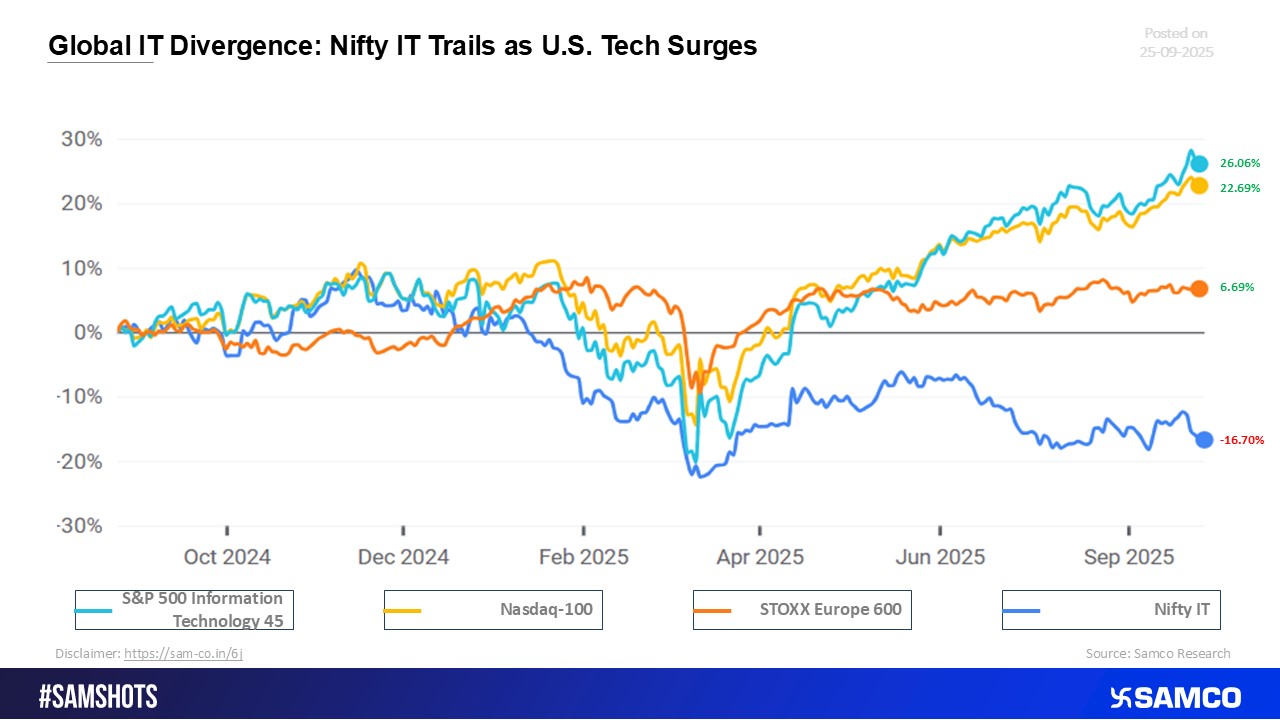
Worldwide IT Split: Nifty IT Lags While U.S. Tech Booms
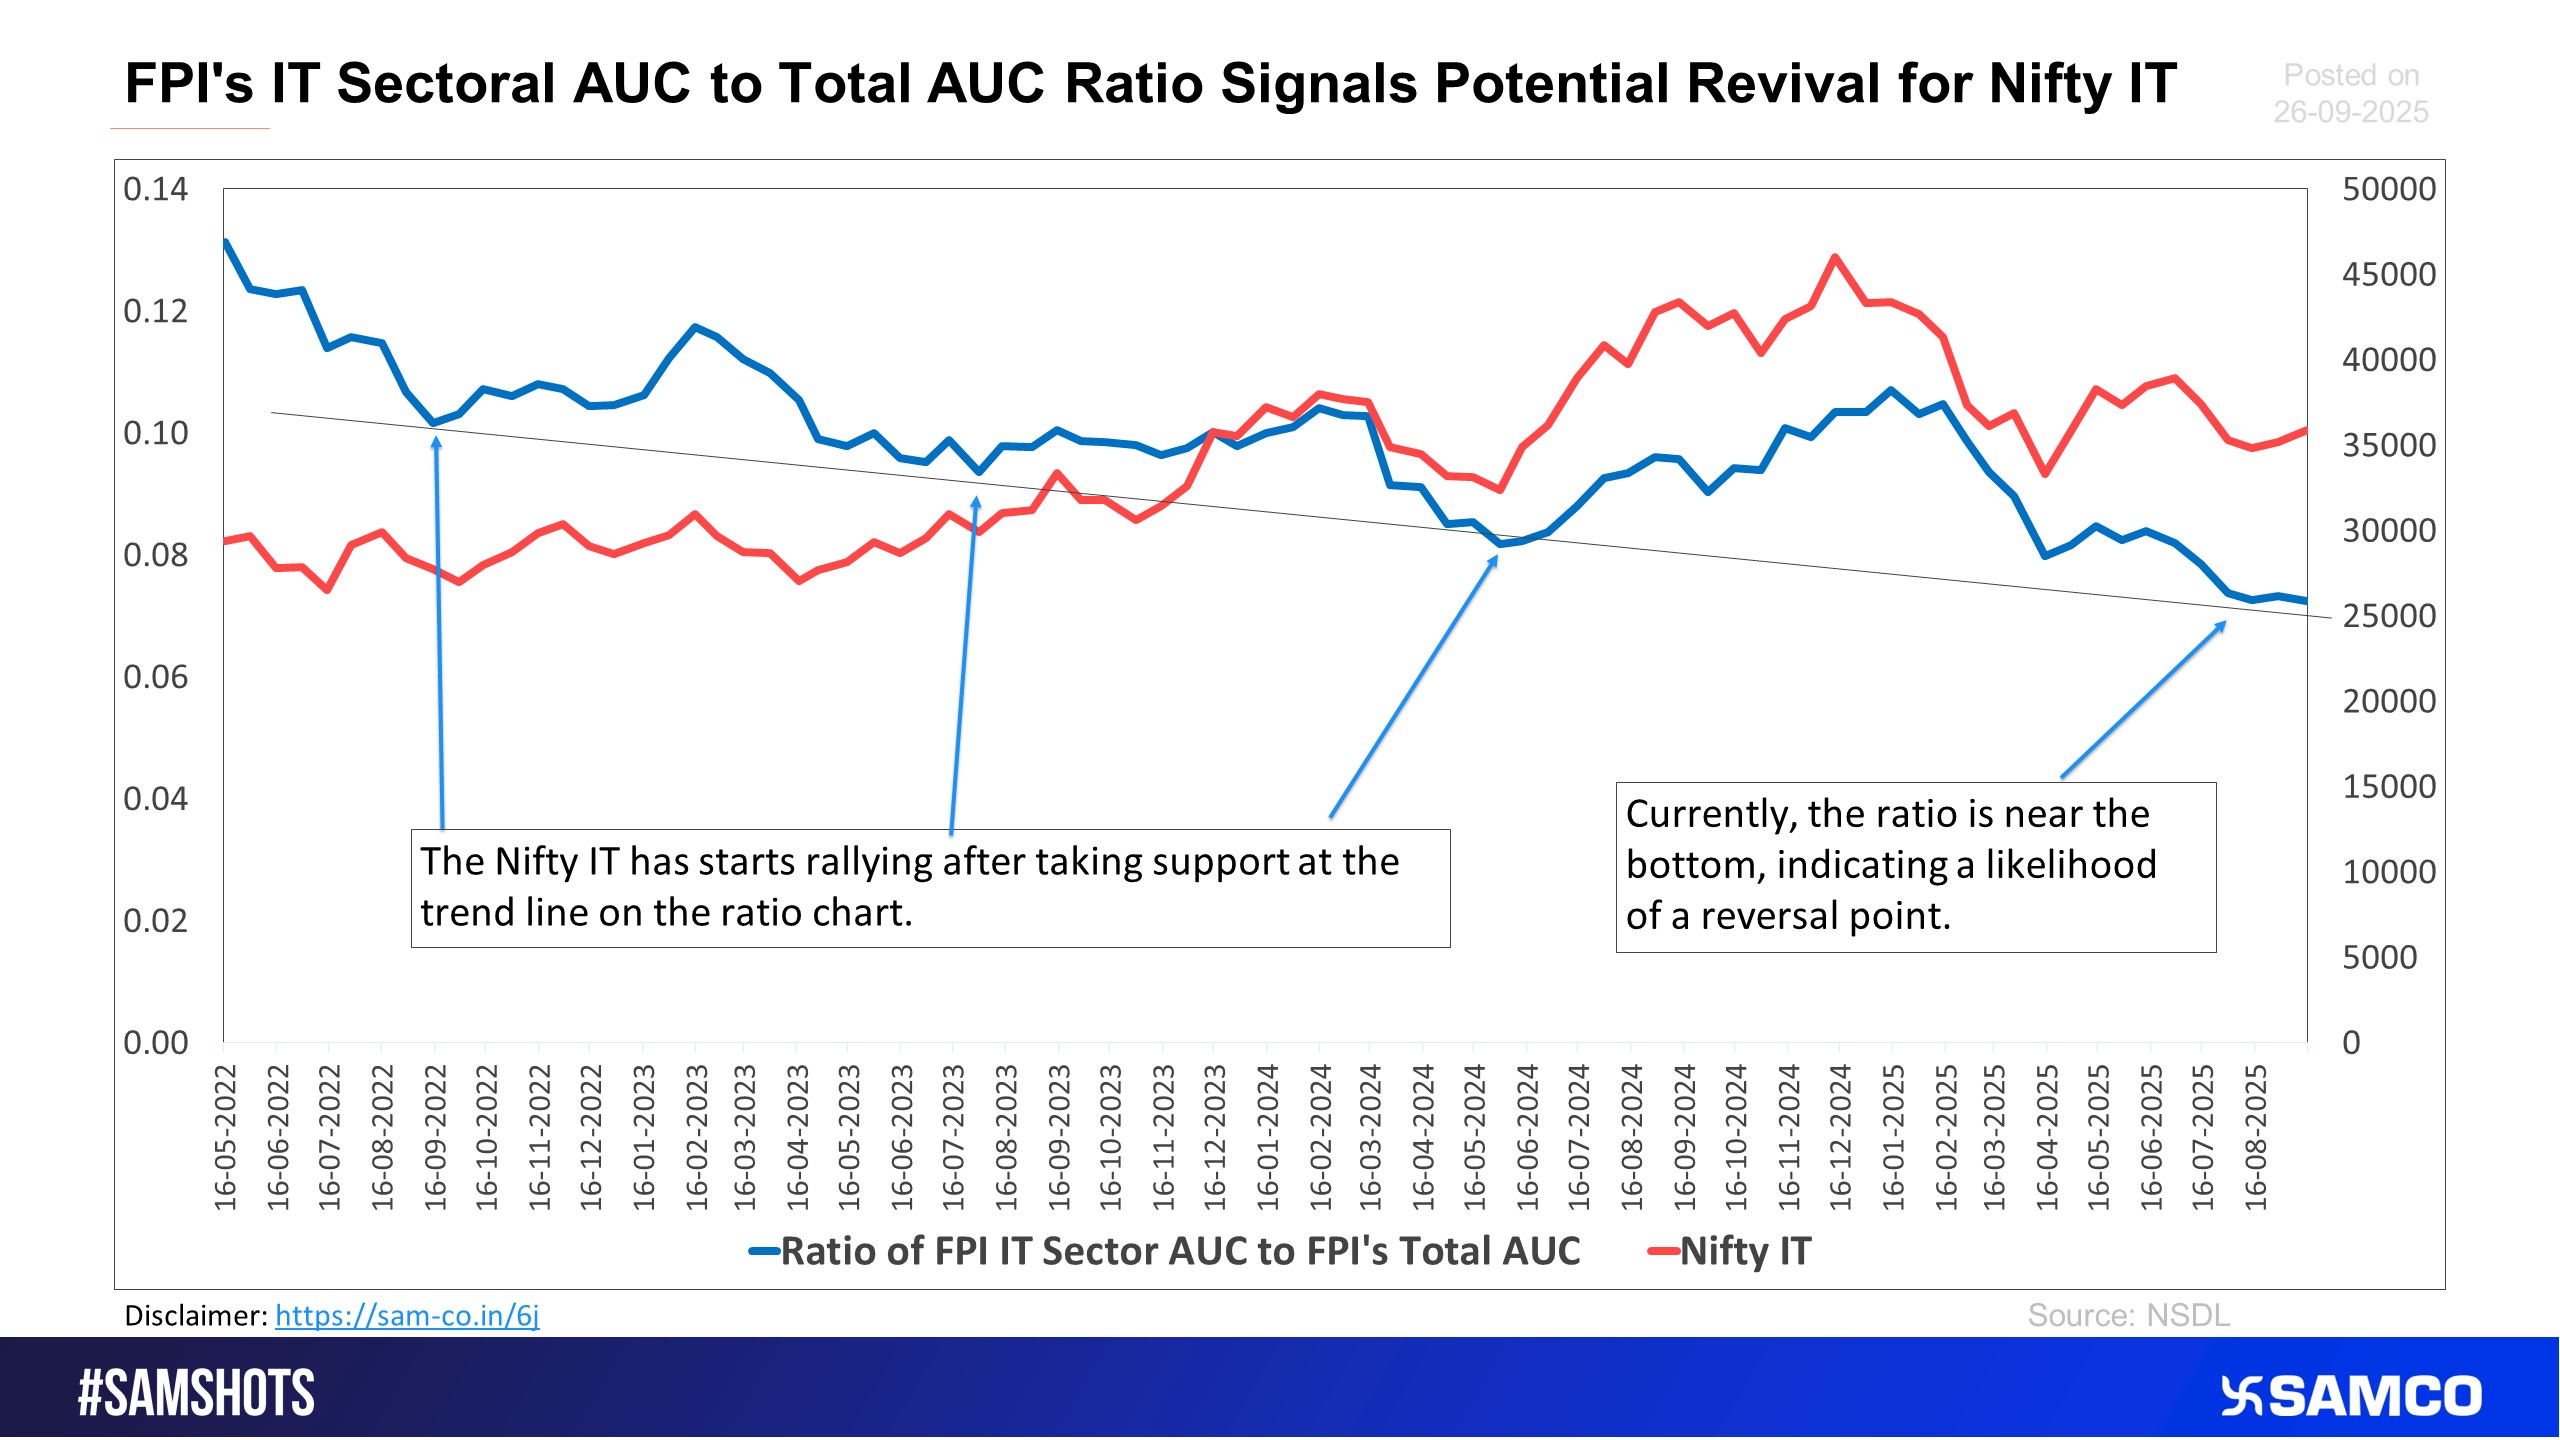
The chart below shows how Nifty IT bounce back from the support level of the ratio chart of FPI’s IT Sectoral AUC to FPI total AUC
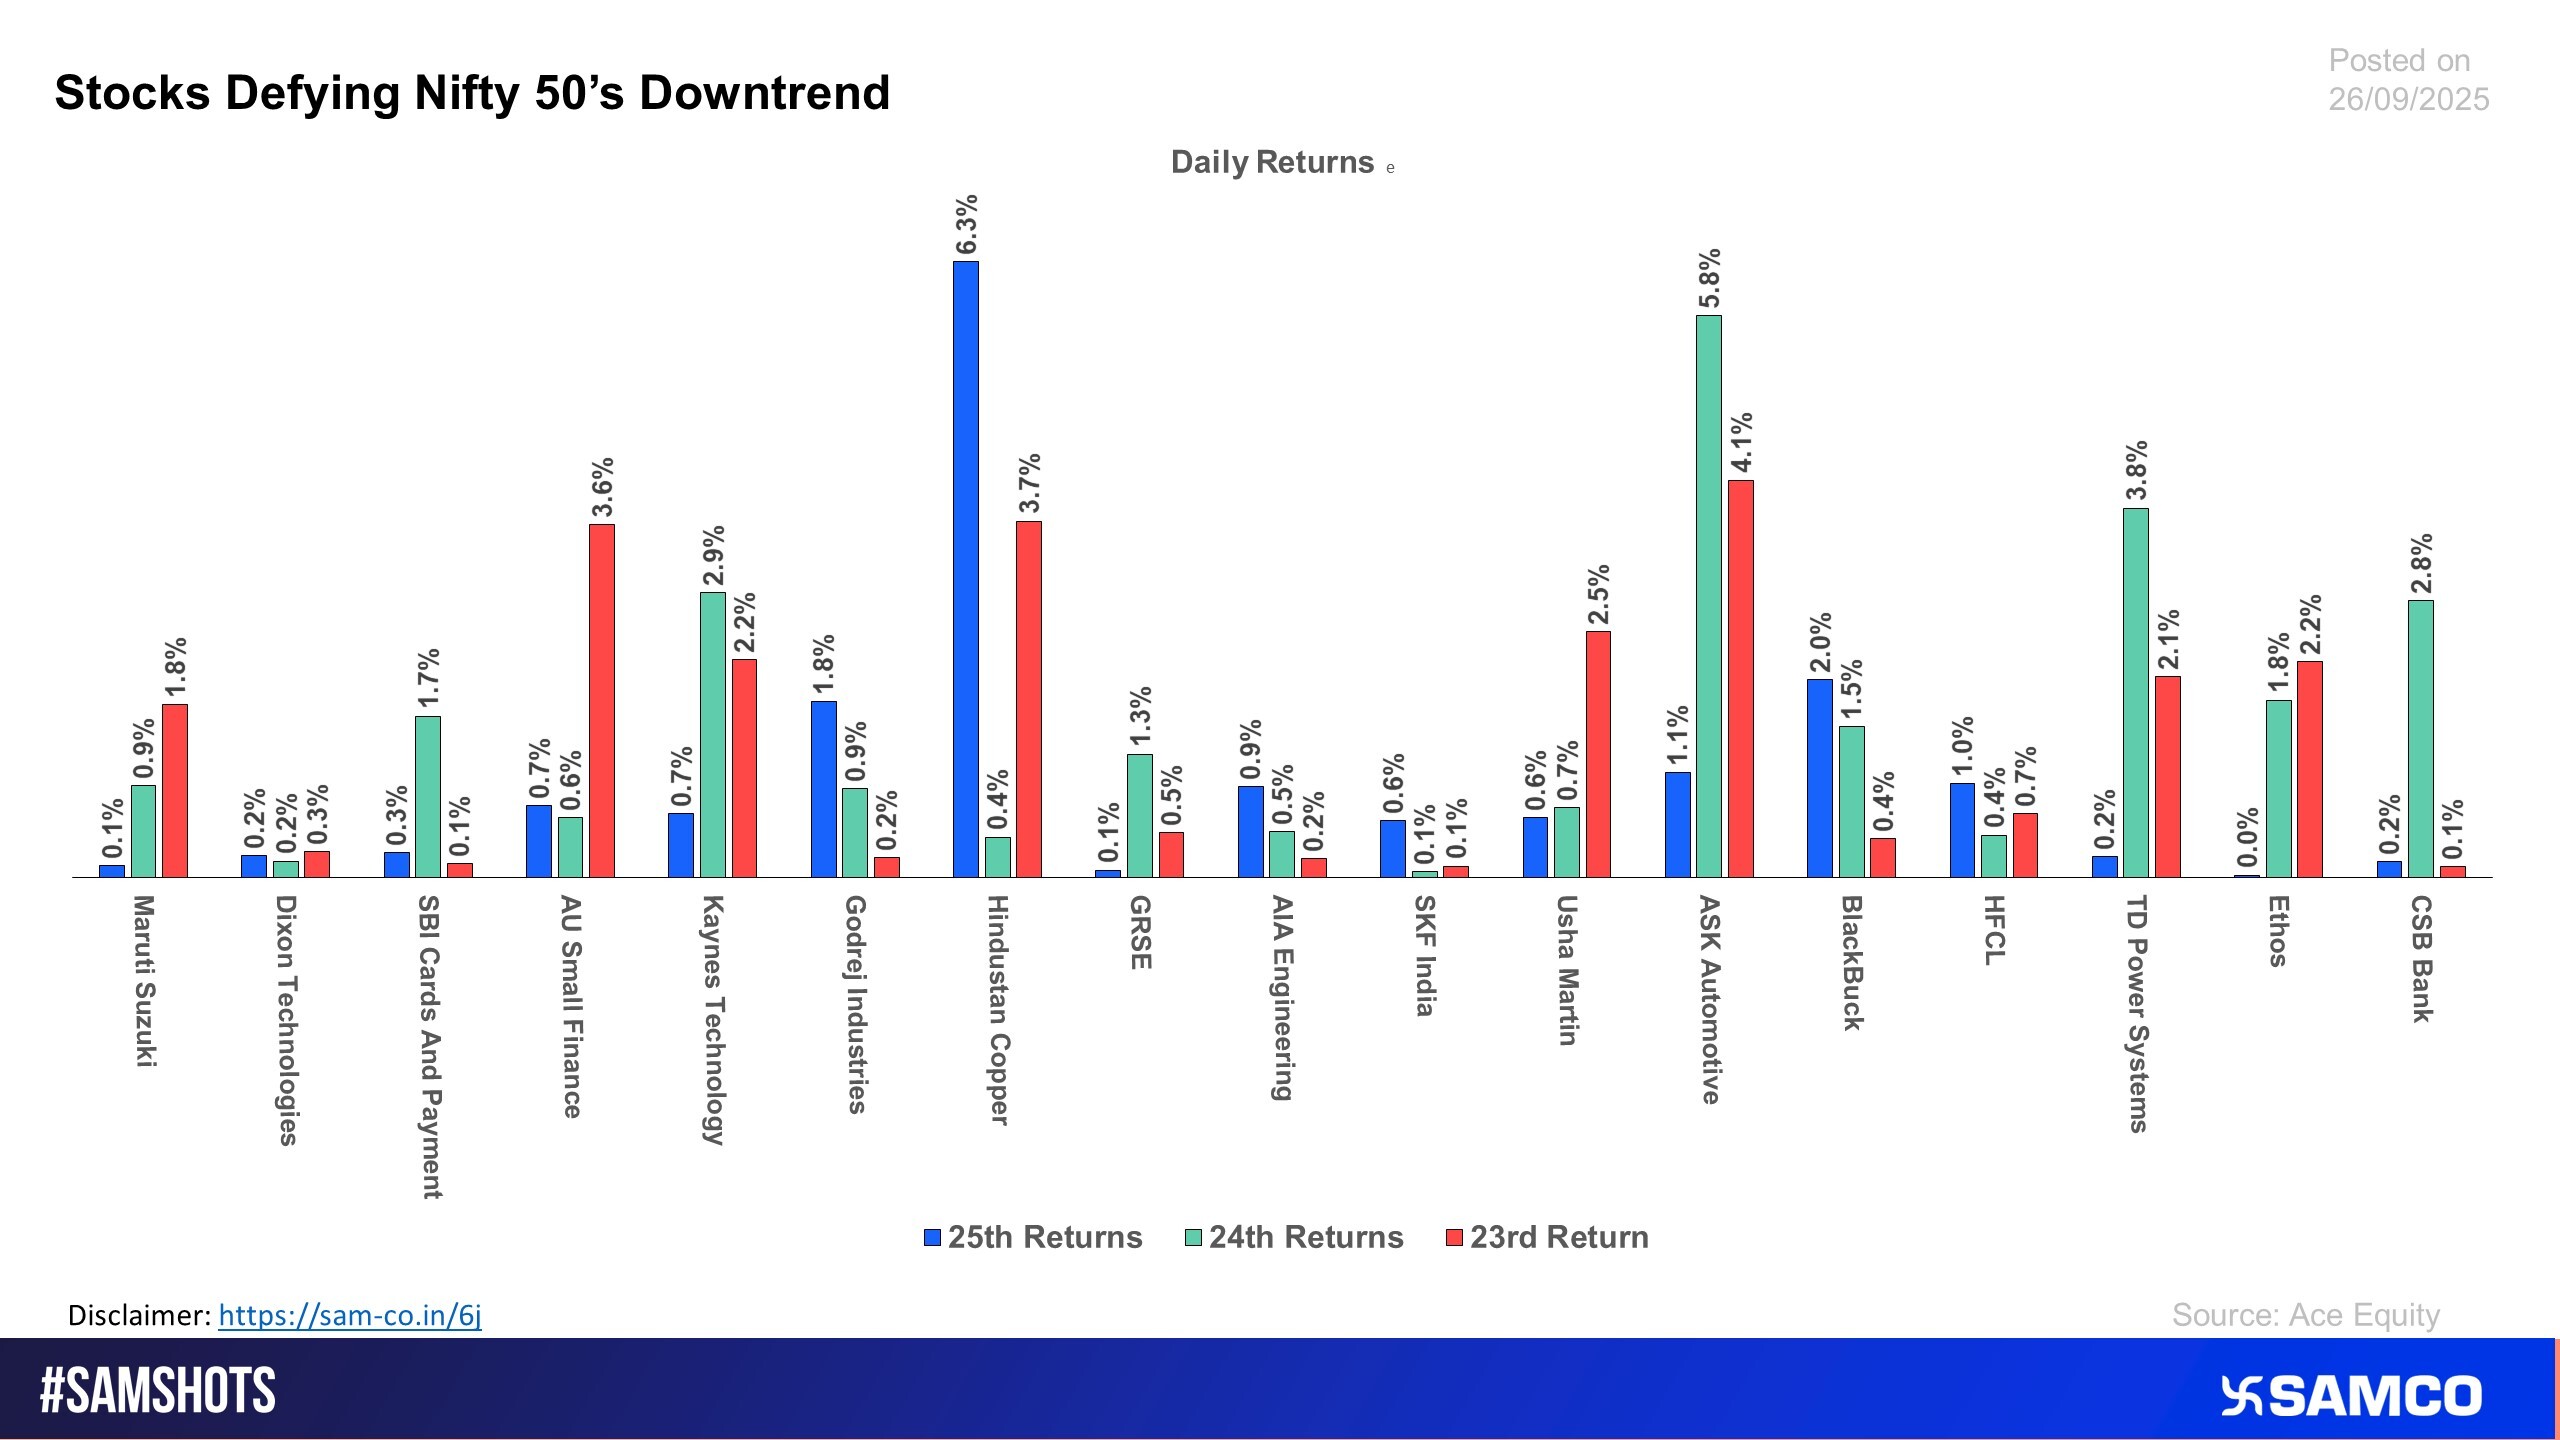
The chart lists down stocks which are constantly rising during the current week in spite of the Nifty 50 fall
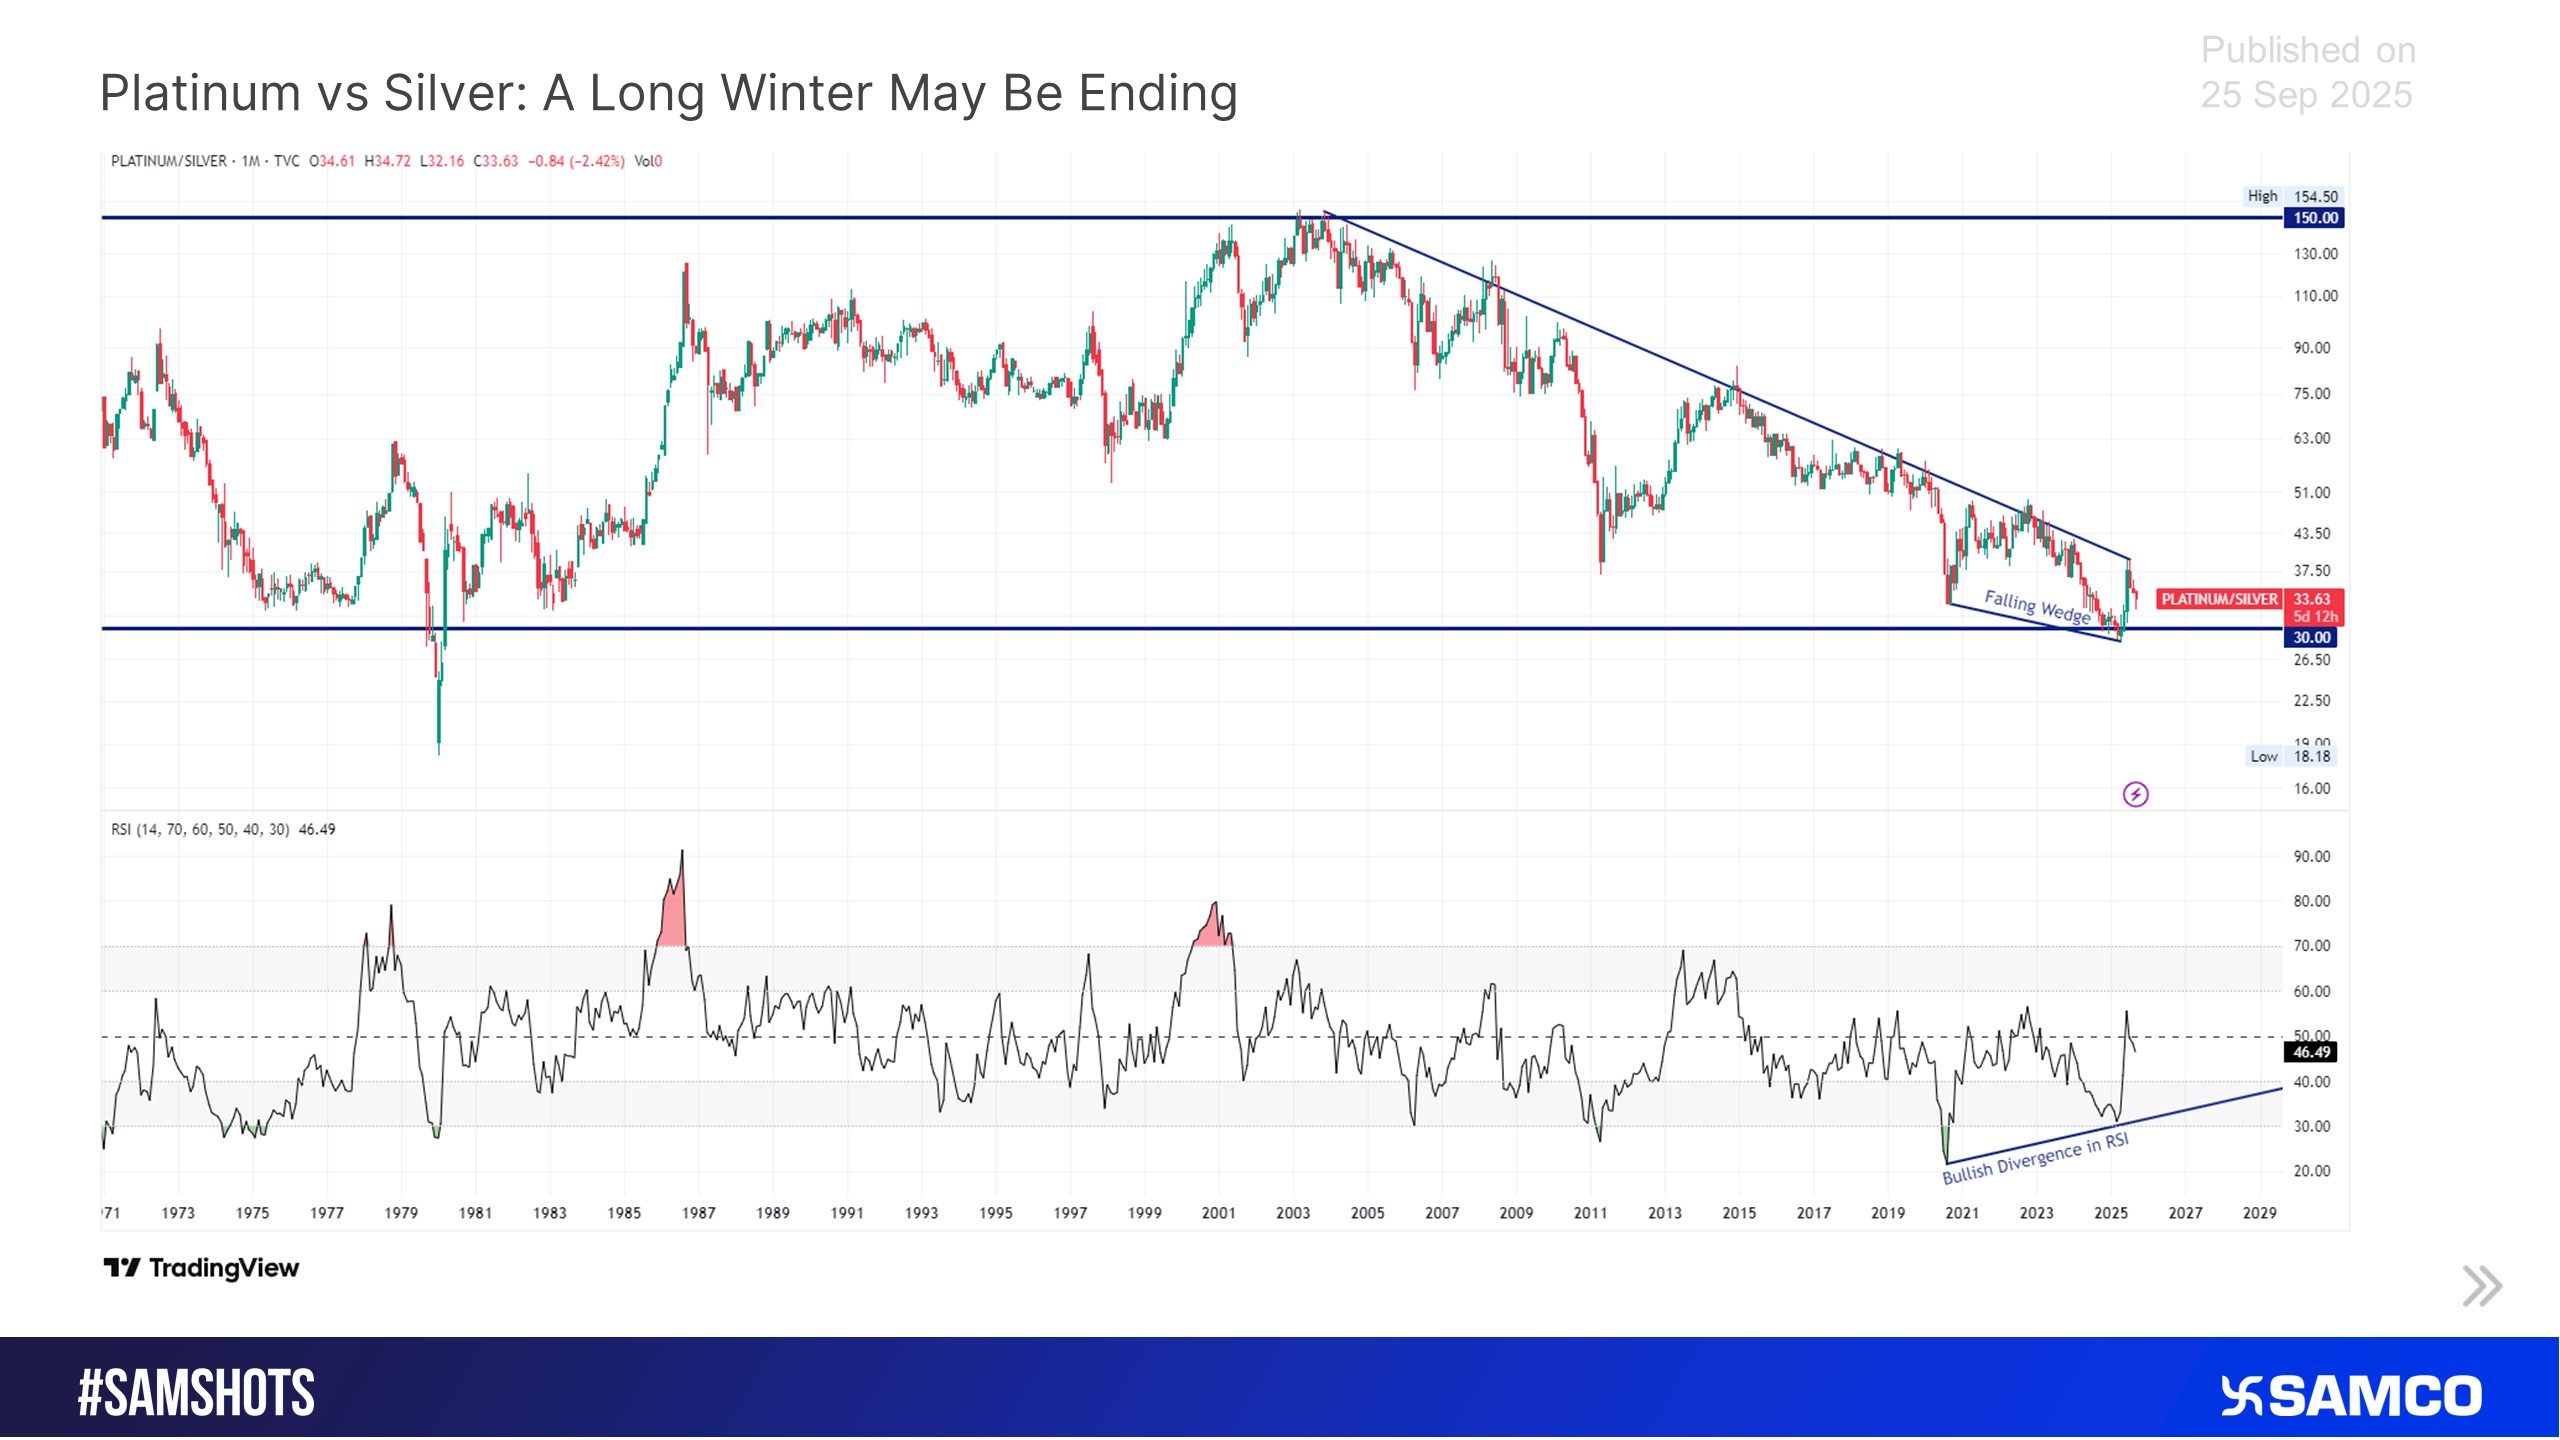
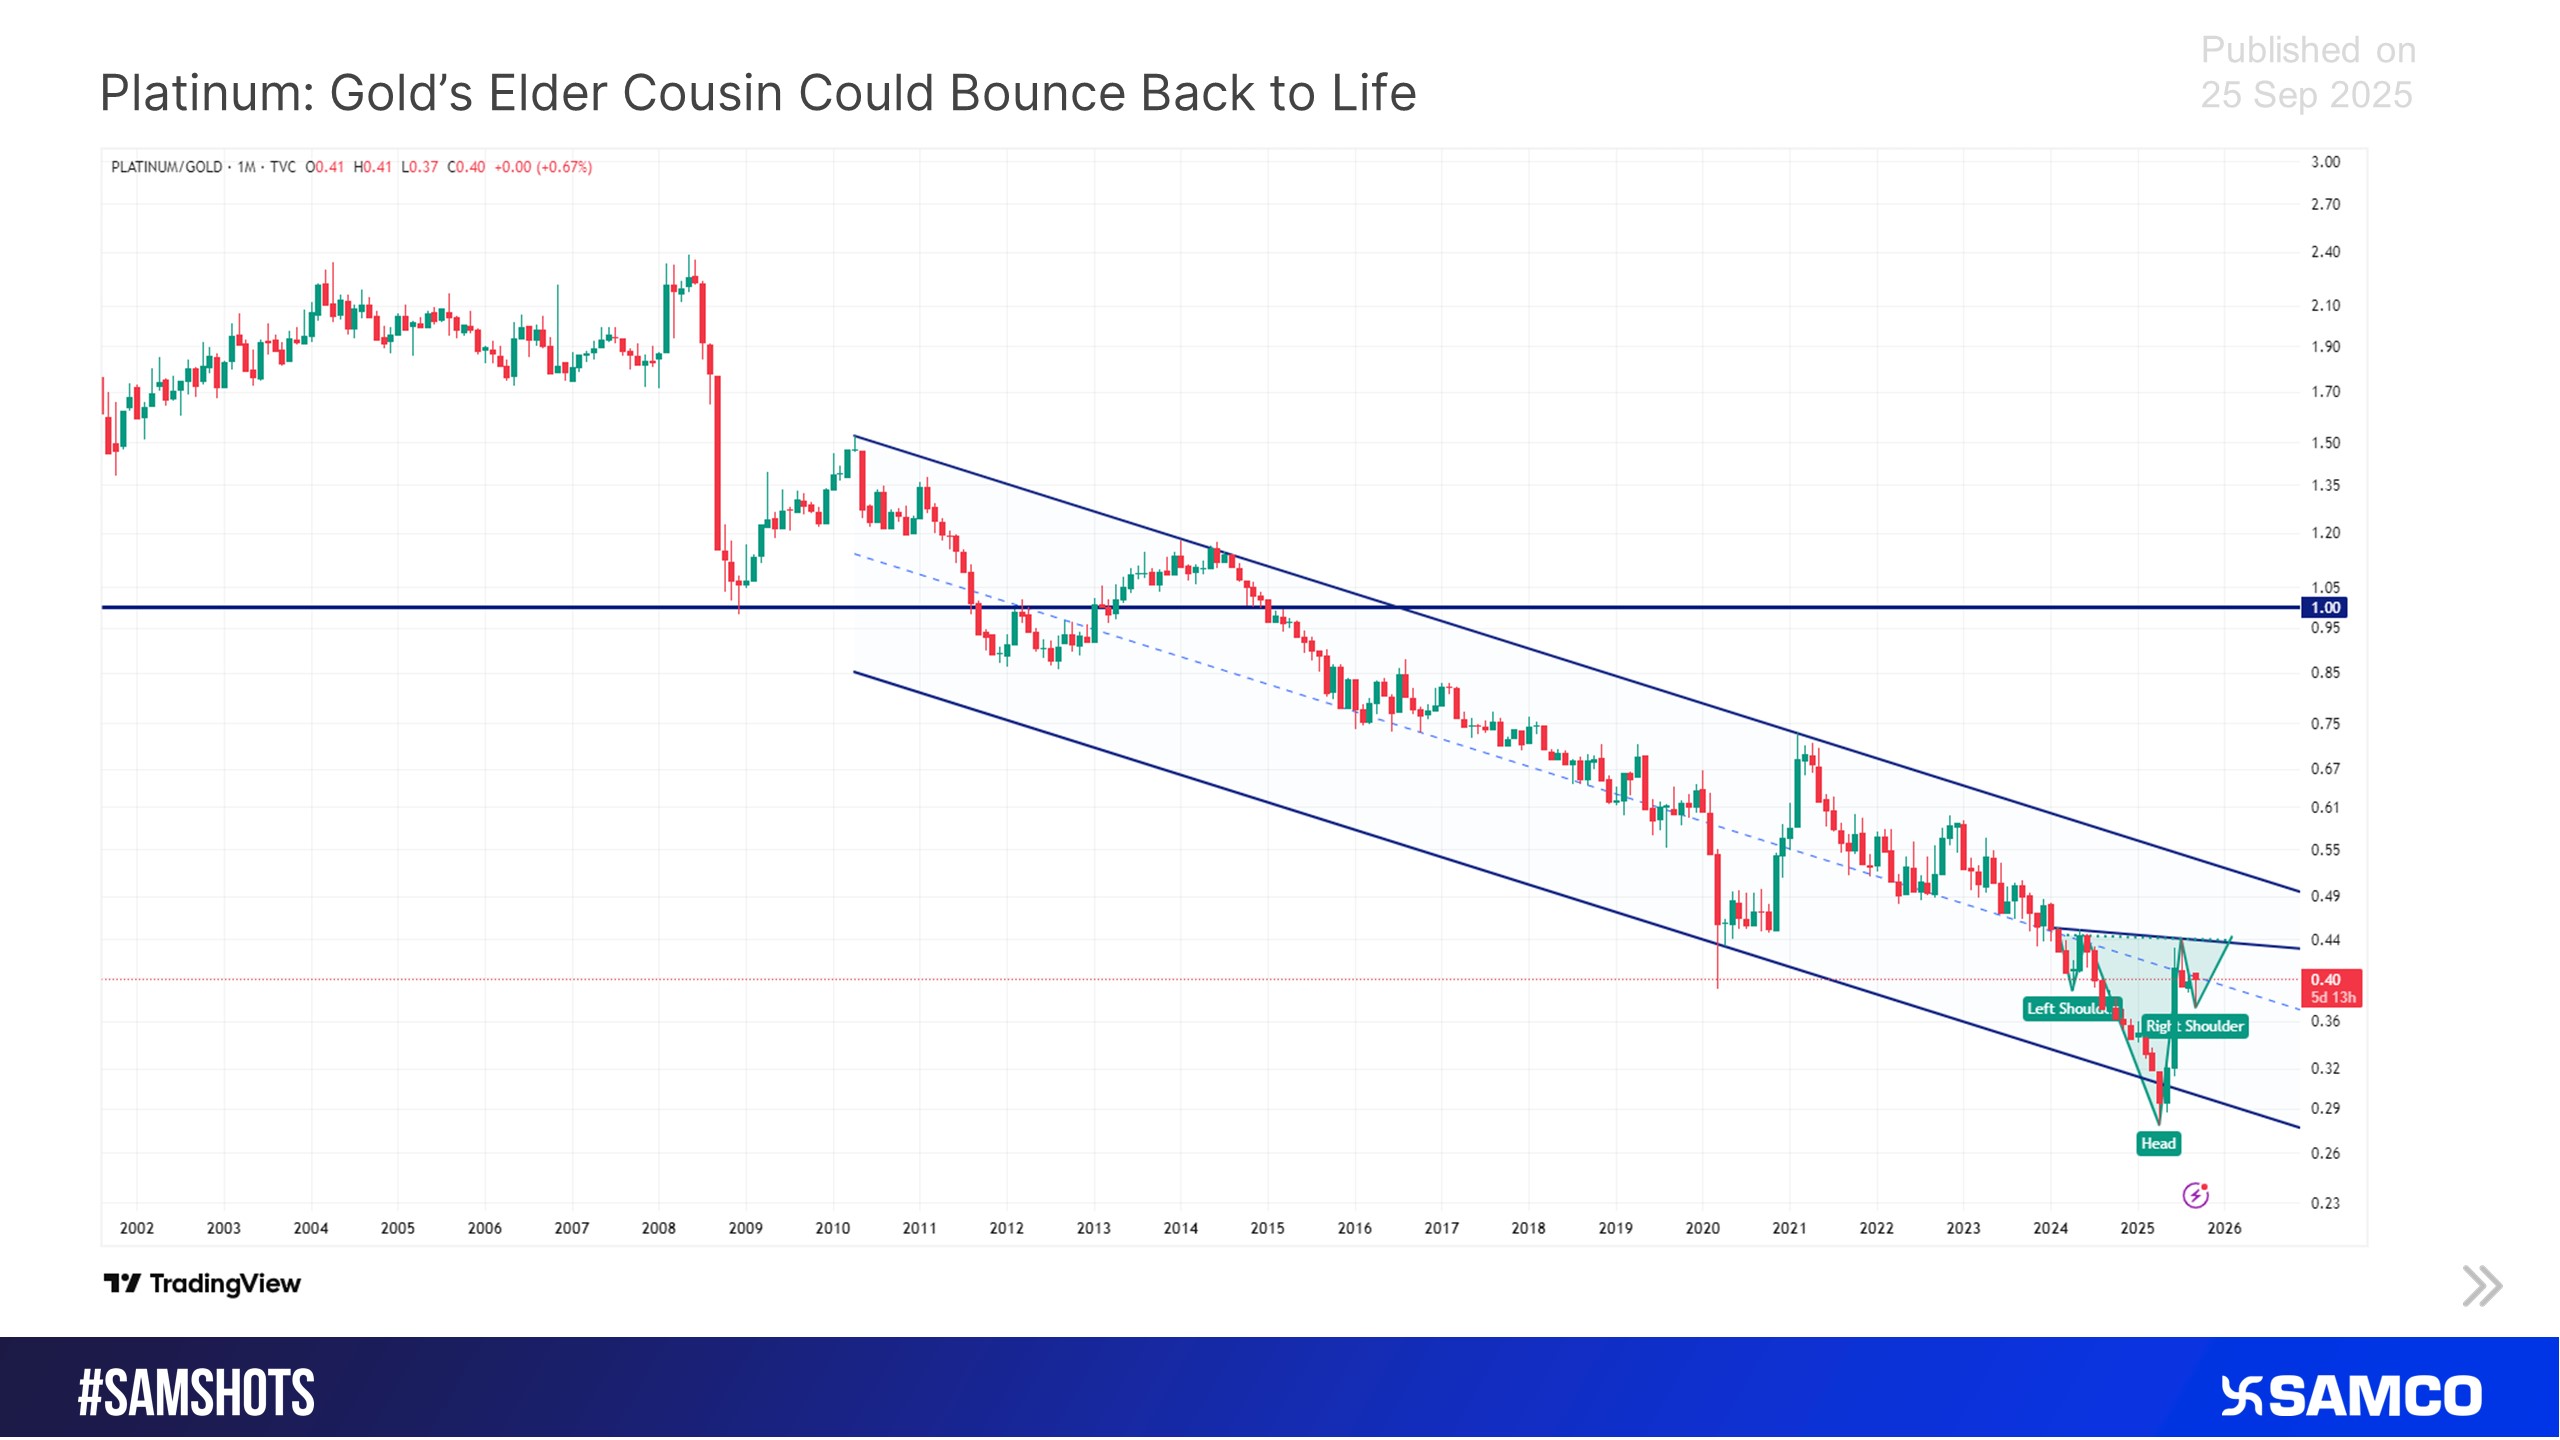
Platinum vs Silver: Signs the Prolonged Downturn Could Be Nearing Its End
Platinum: Gold’s Older Sibling Poised for a Revival
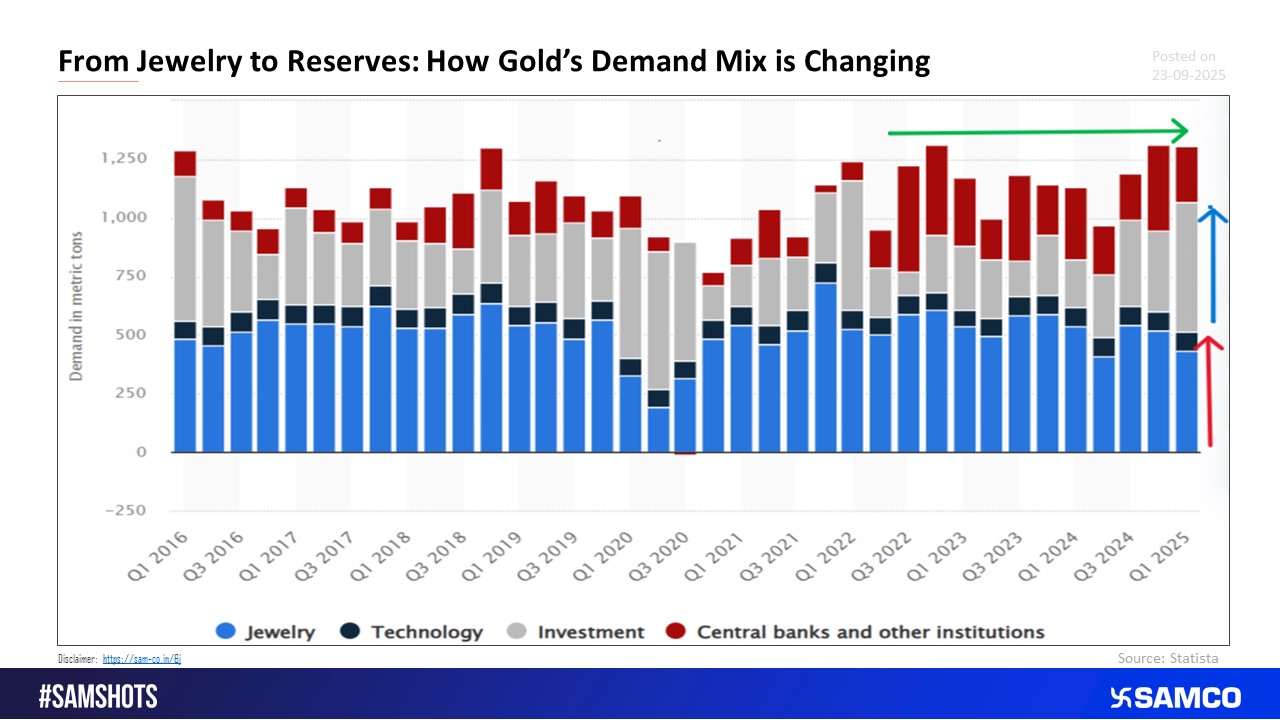
Gold Demand Dynamics: Central Bank Purchases Surpass Domestic Consumption Trends
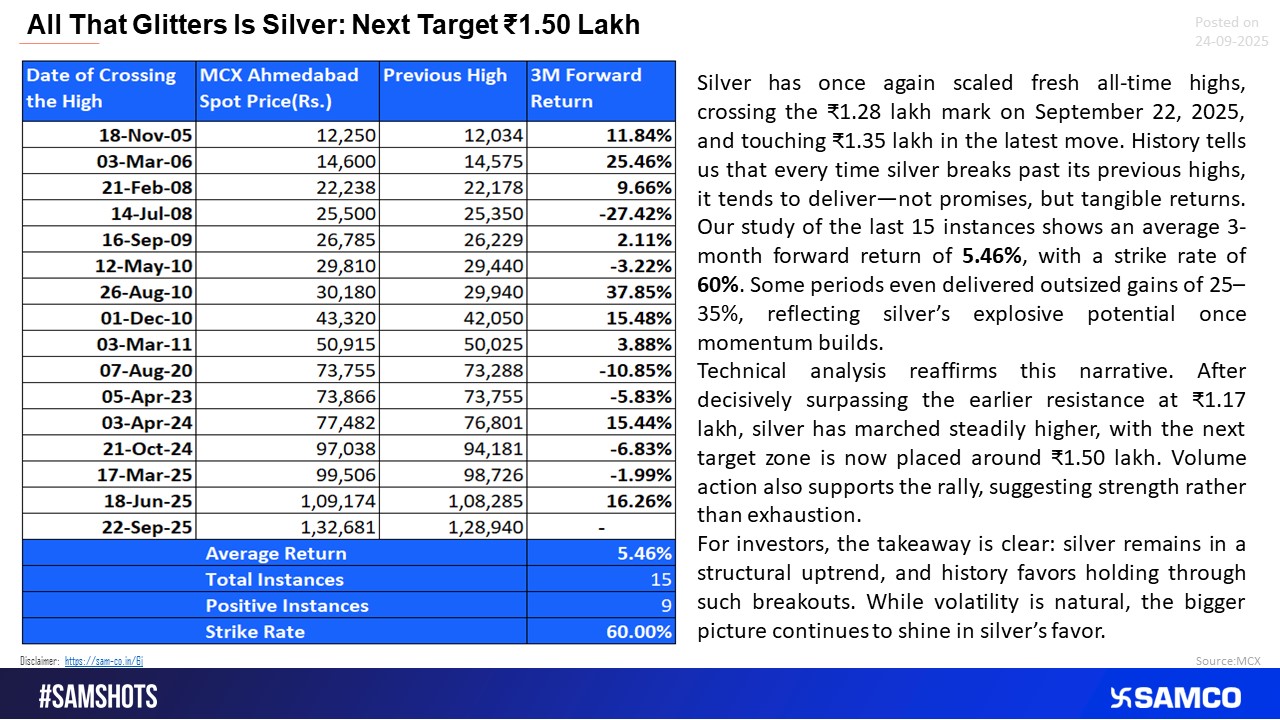
Silver Shines Bright: Eyeing the ?1.50 Lakh Mark
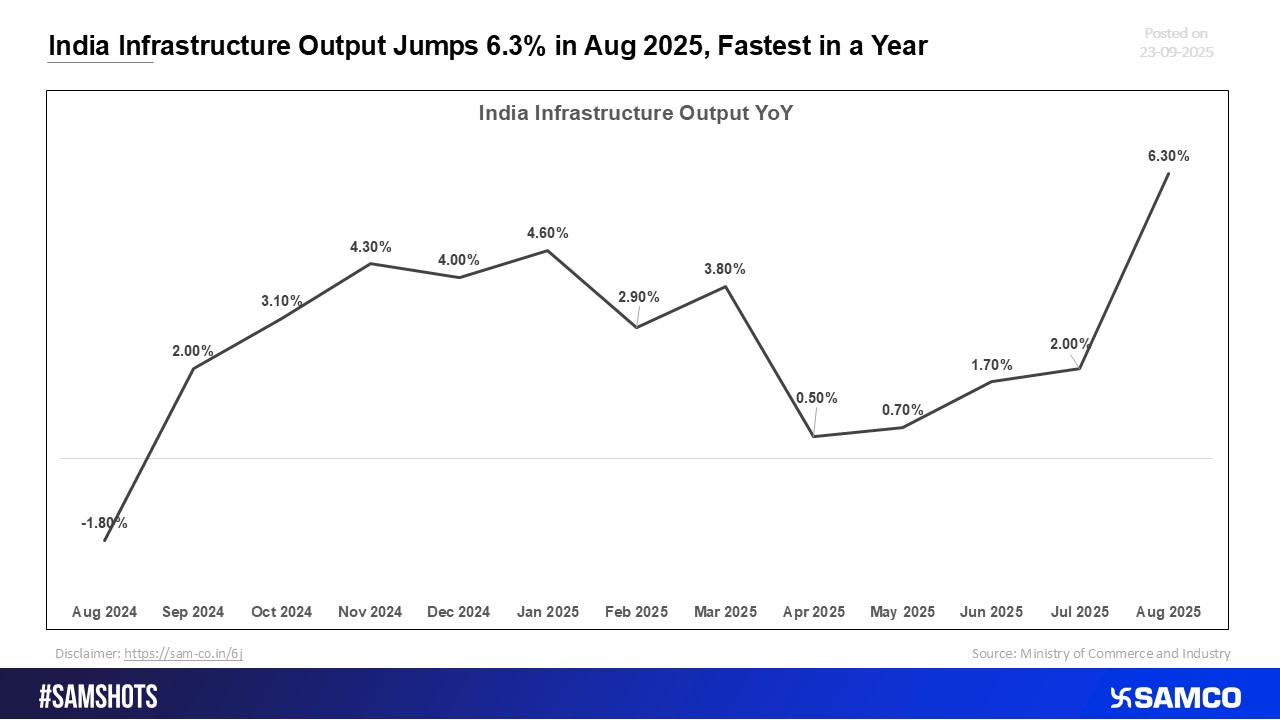
India’s infrastructure output surged 6.3% in August 2025, marking its strongest growth in a year.
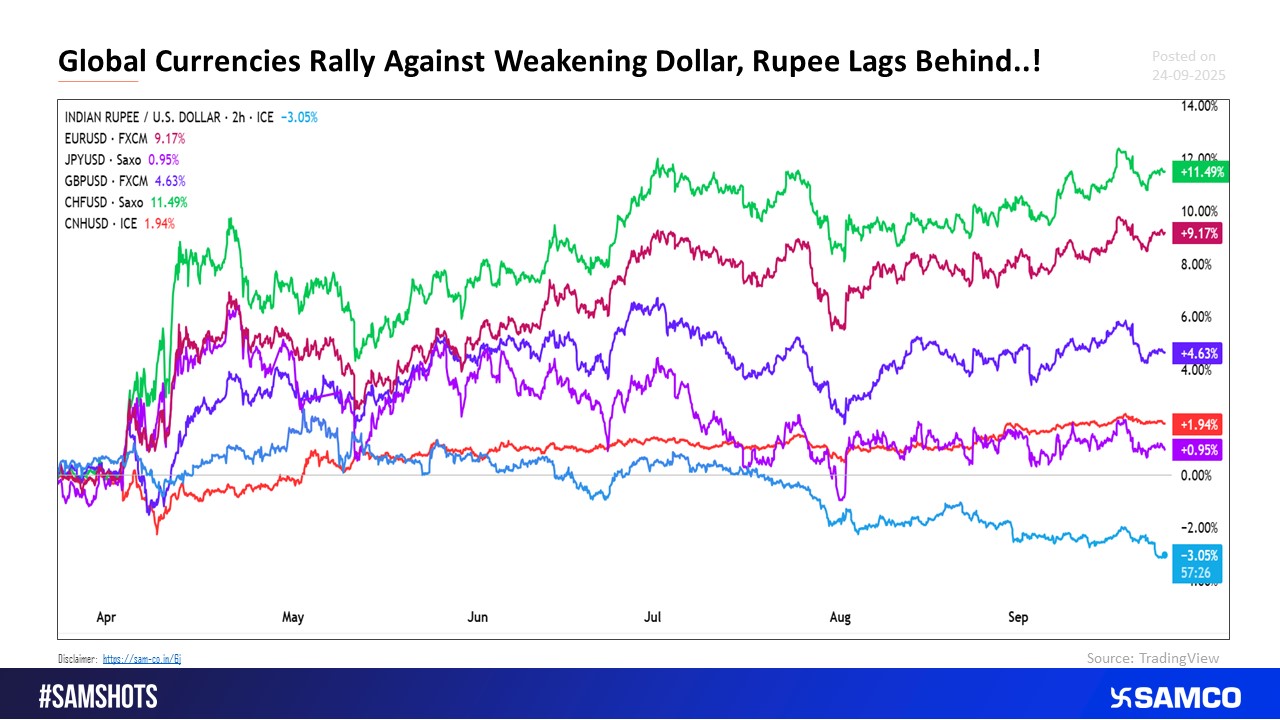
A Look at the Rupee’s Decline Against Major Currencies
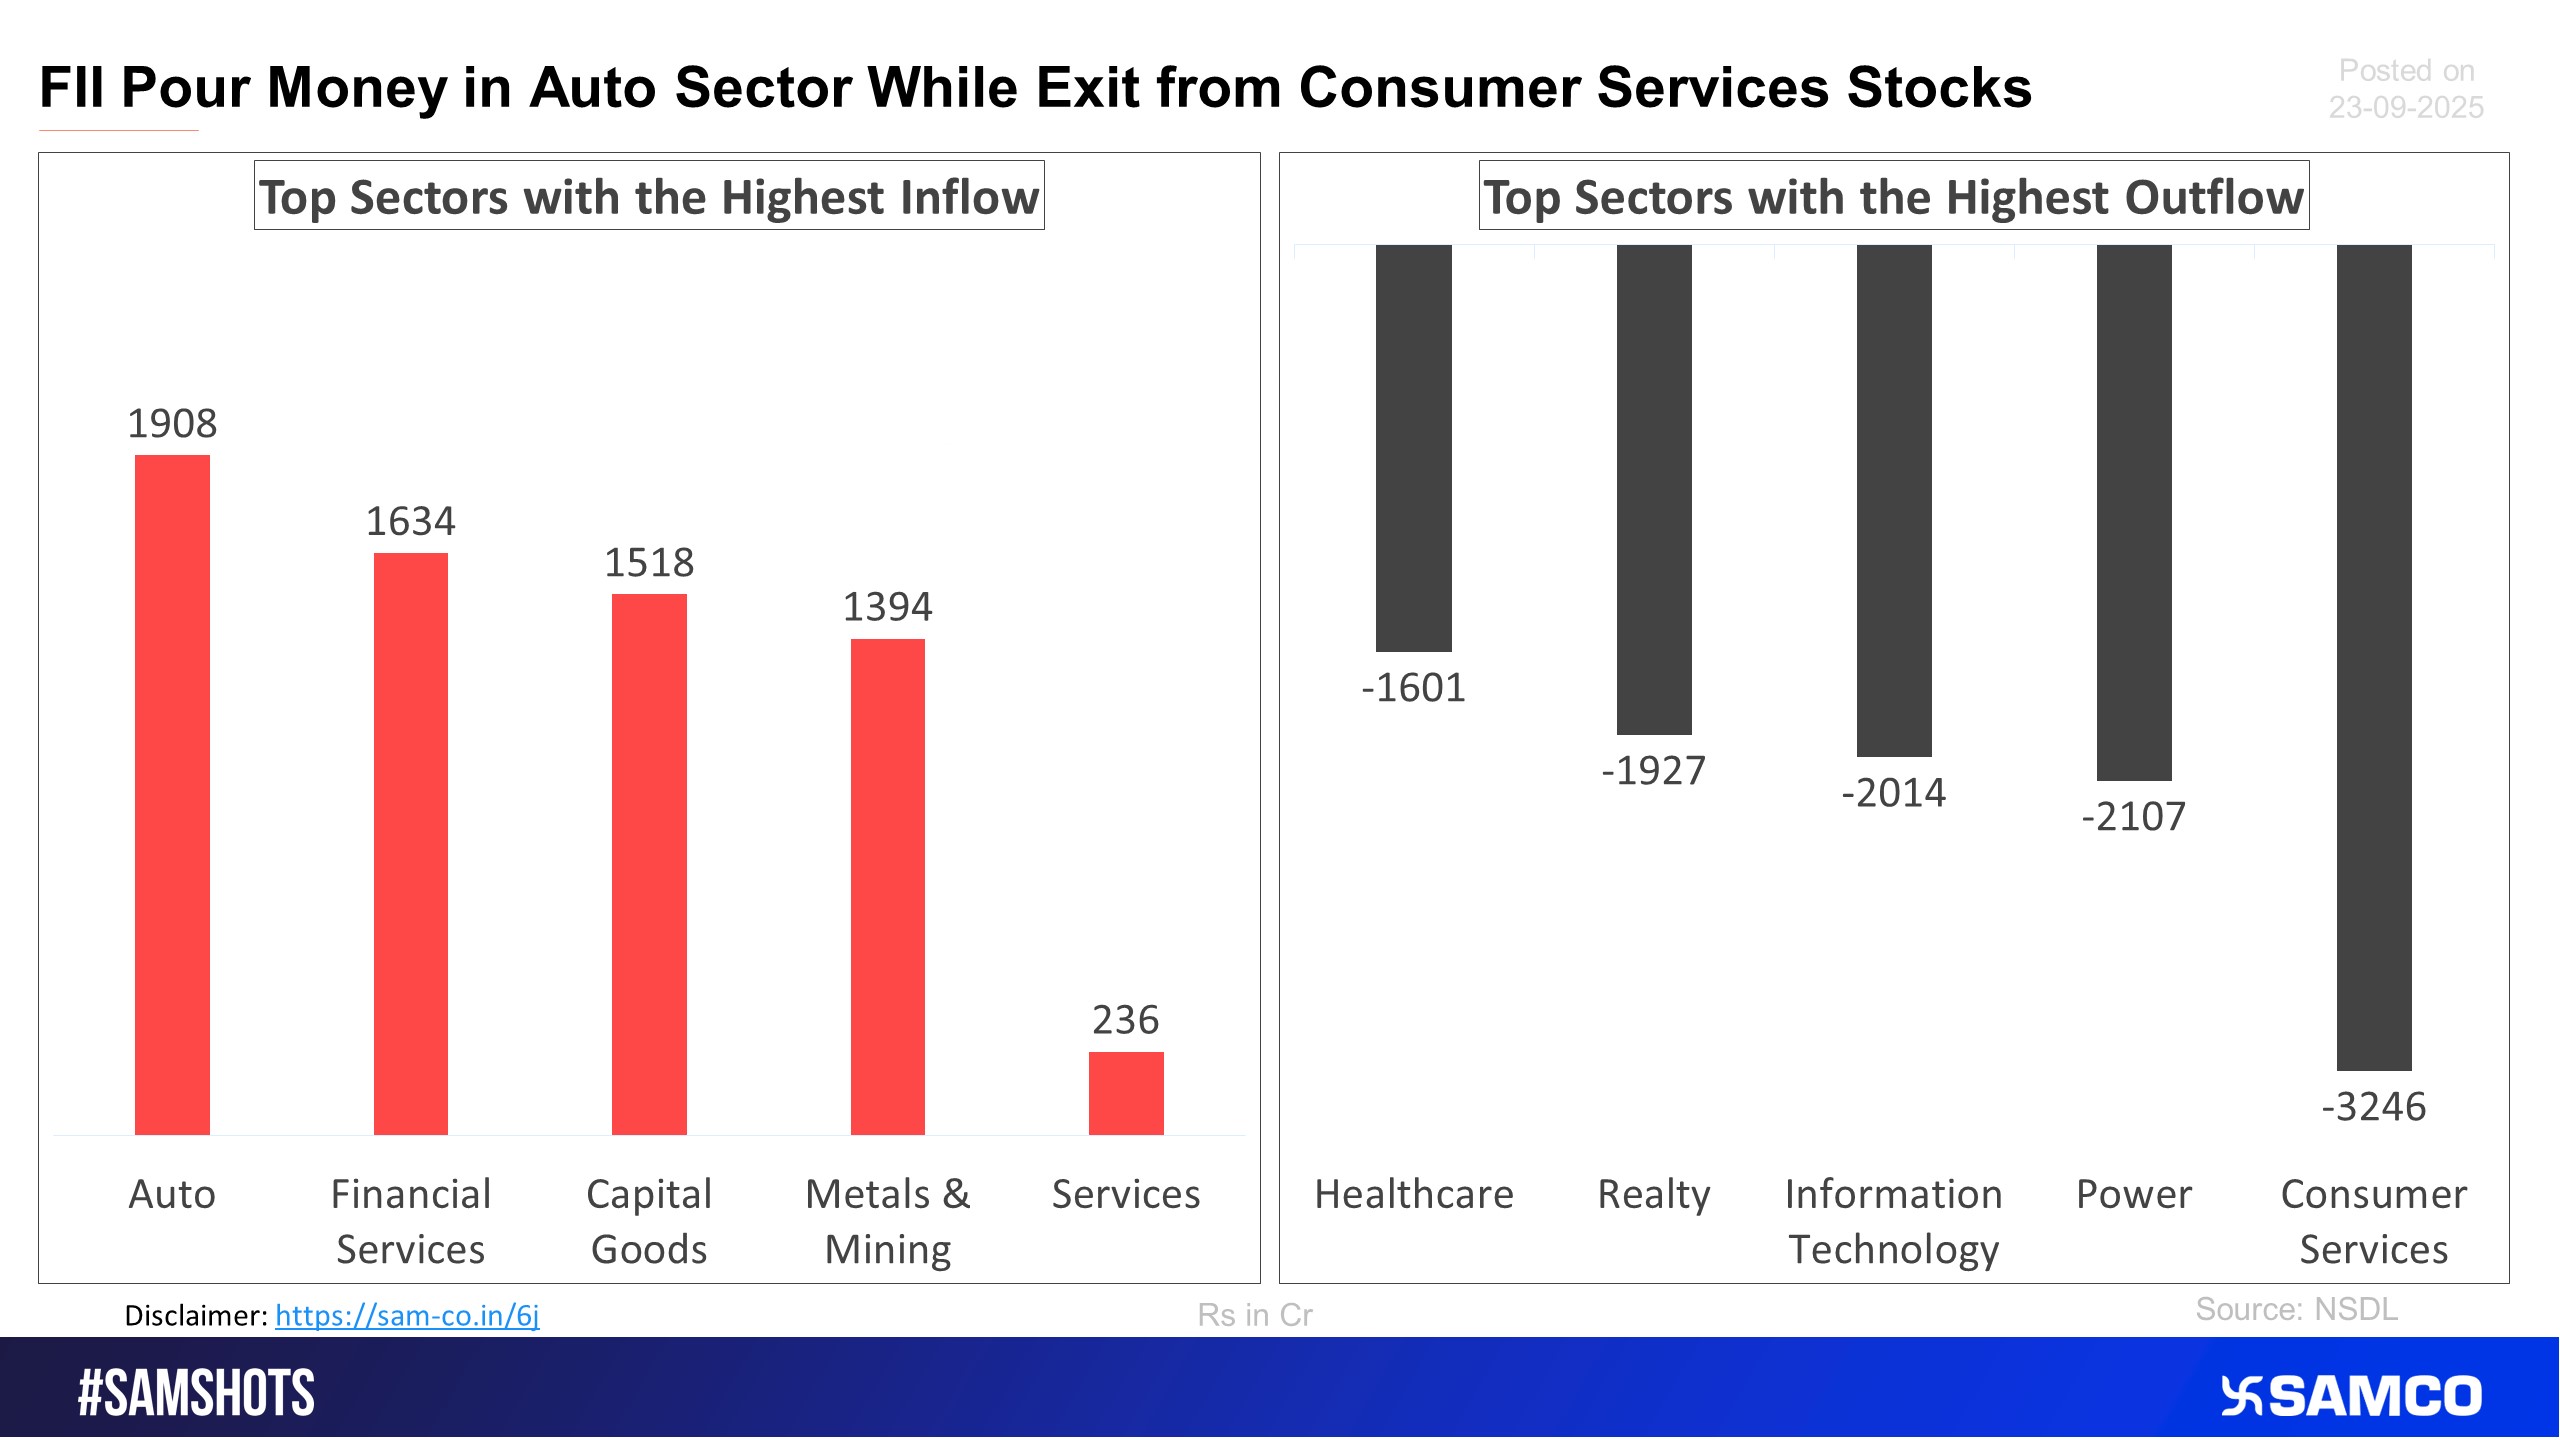
The accompanying chart shows the top 5 sectors that witnessed FPI’s highest inflow and outflow in the latest quarter.
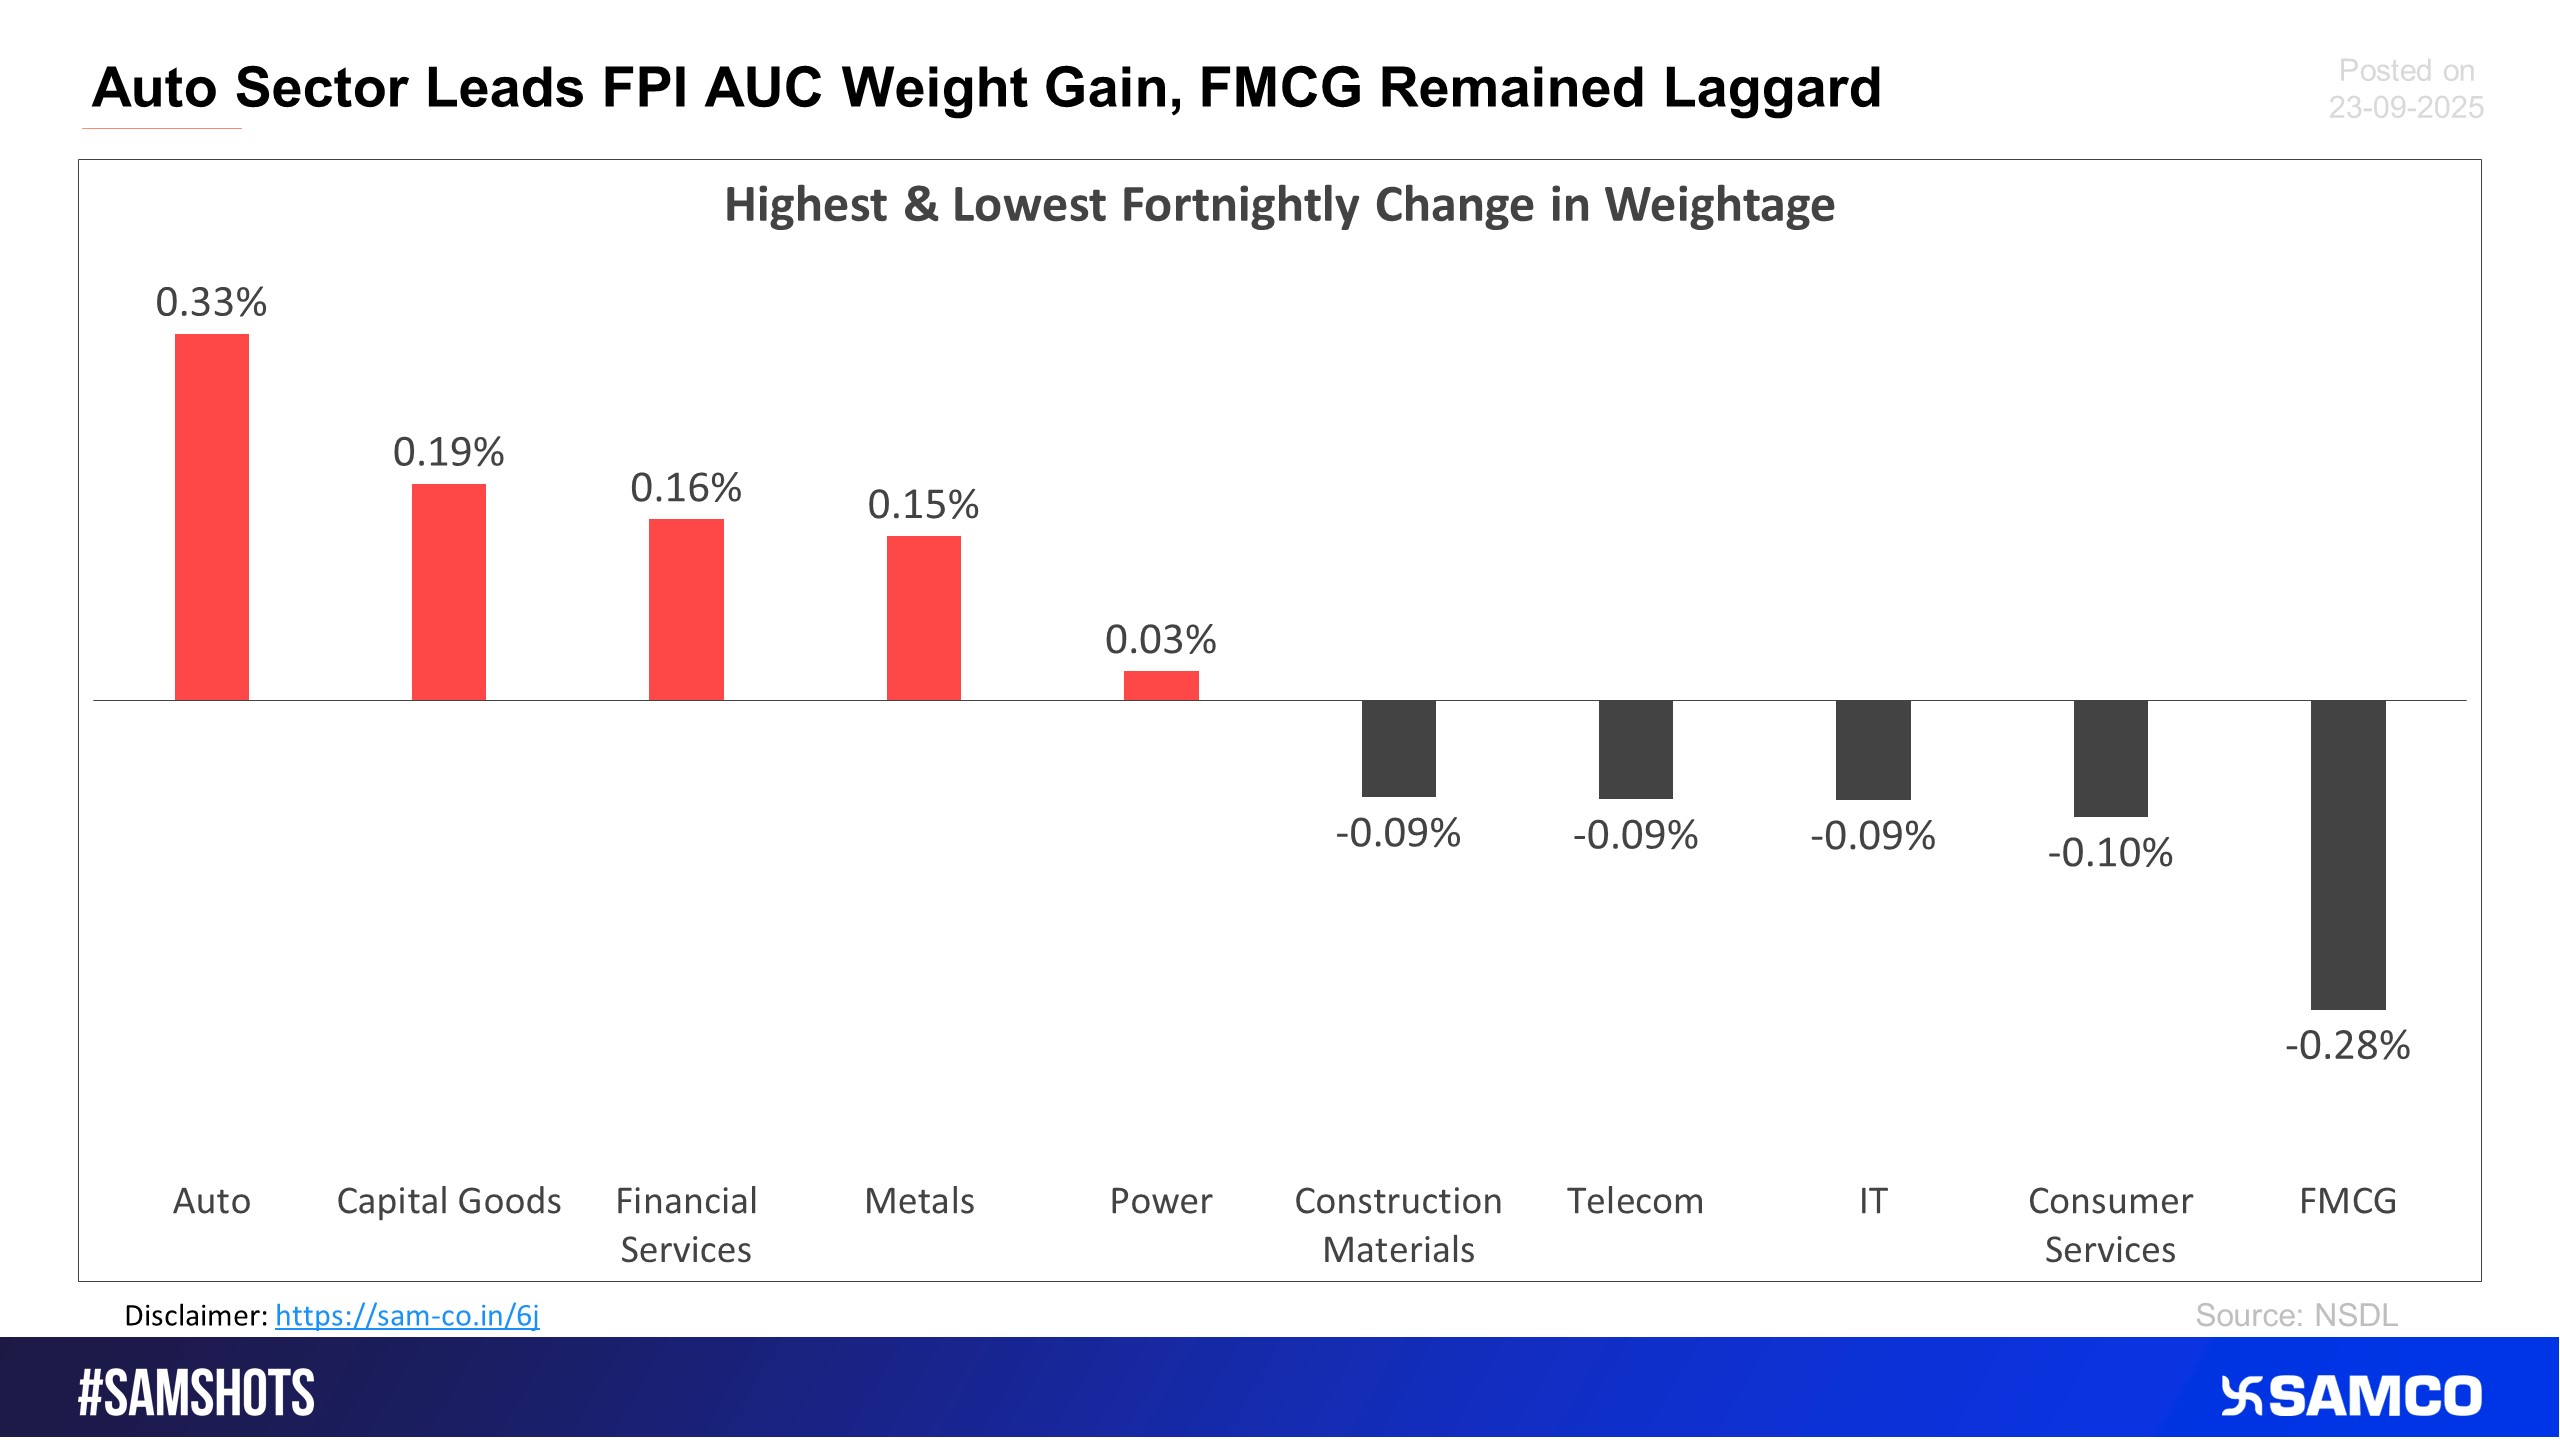
The chart below displays sectors that witnessed the highest and lowest change in the weightage of sectoral FPI holdings to the total FPI holdings compared to the previous fortnight.
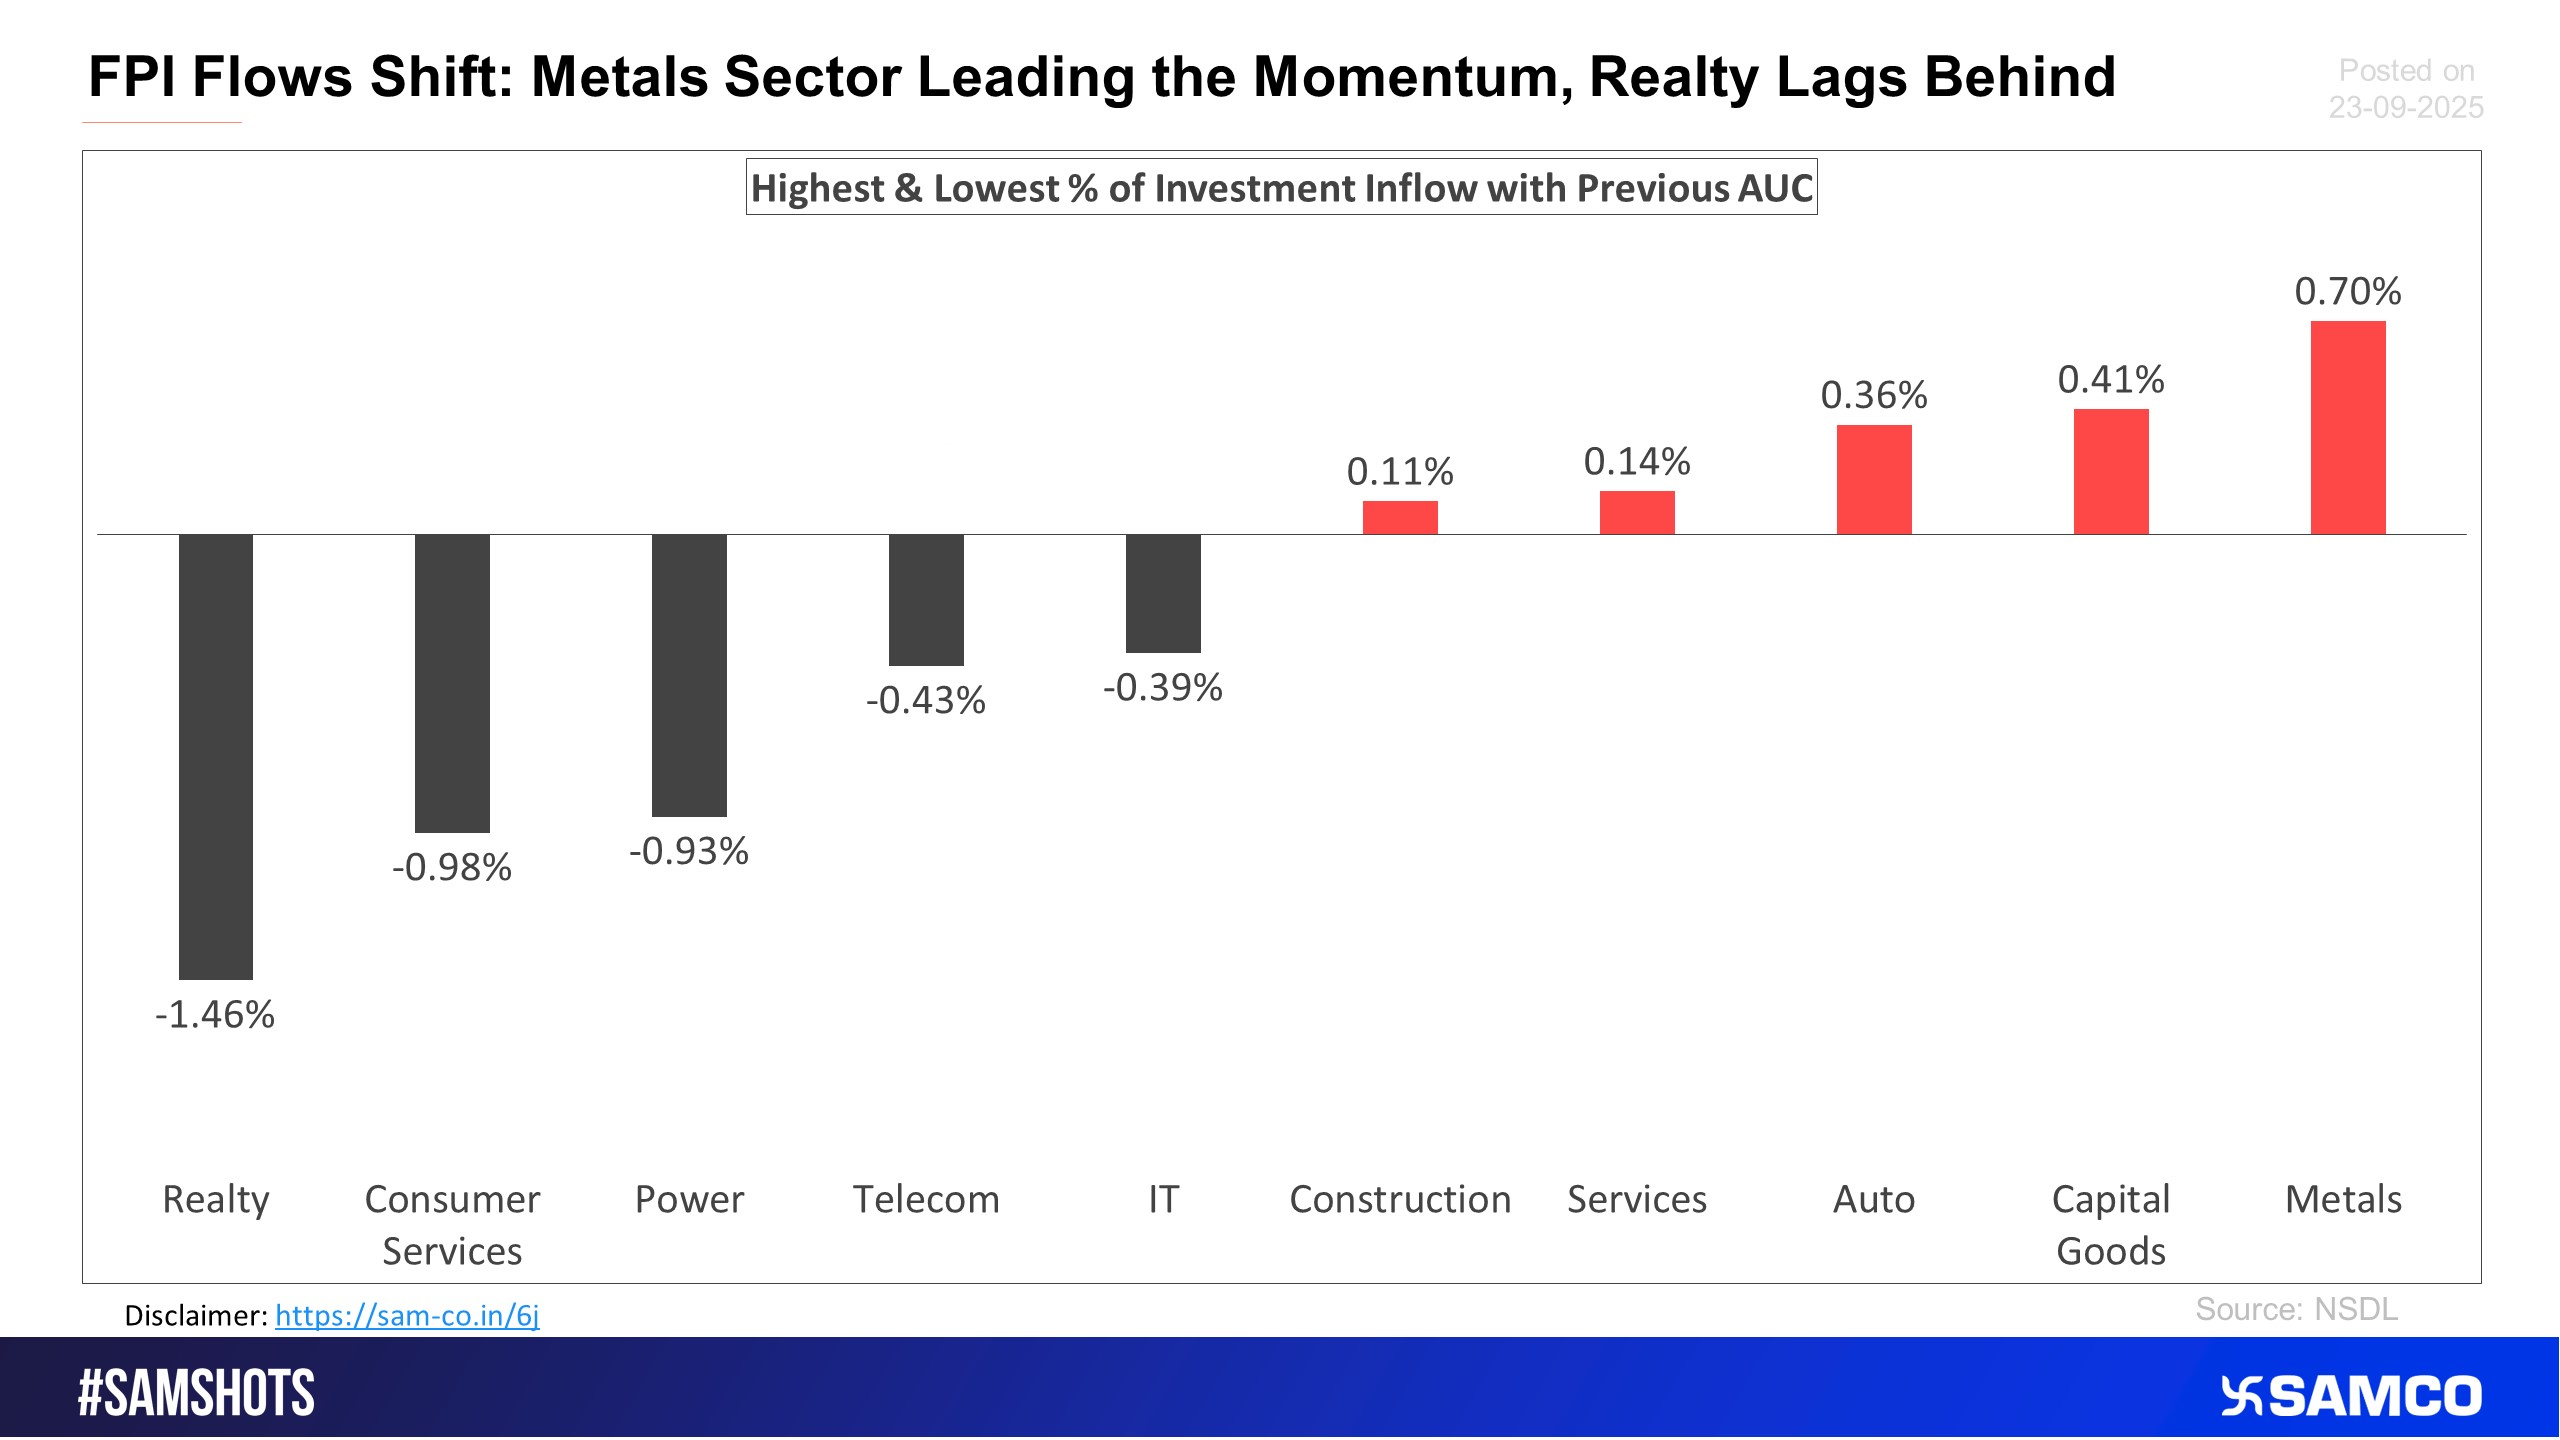
The below chart presents the highest & lowest percentage inflow of investment in the latest fortnight compared to the previous period AUC (Asset Under Custody) of FPI.
Nifty Pharma slips into pressure as rally momentum fades
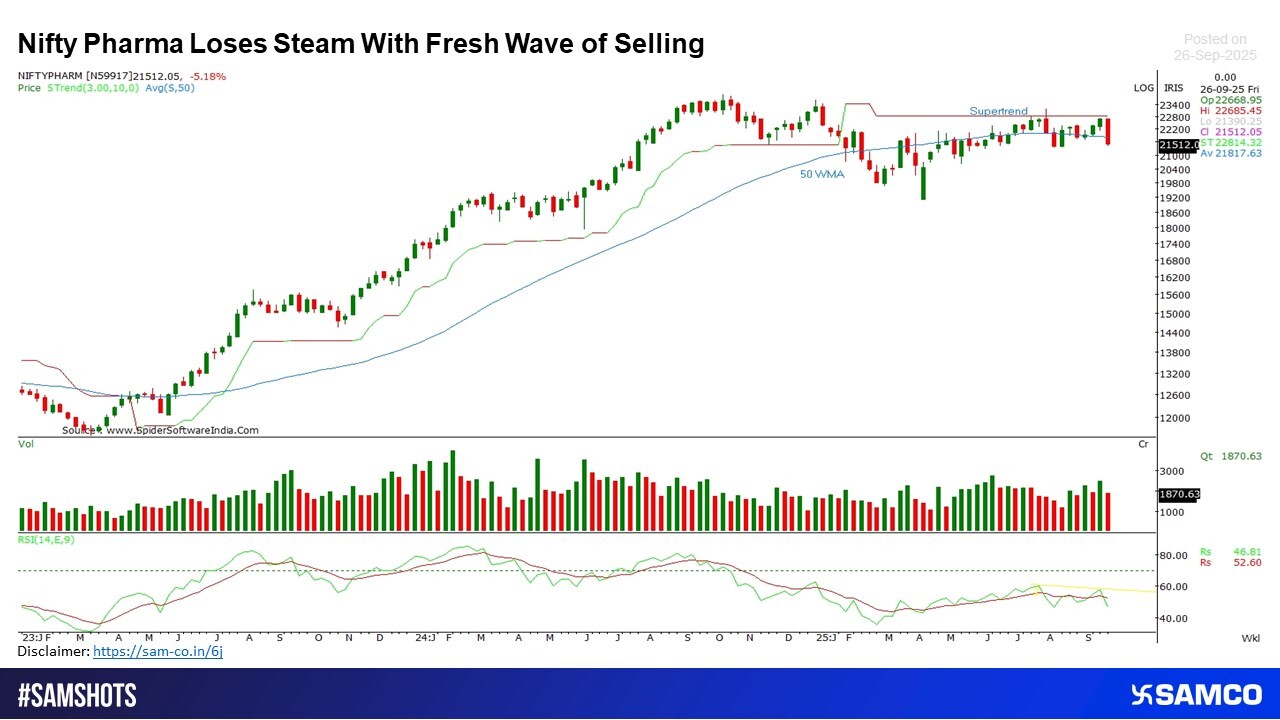
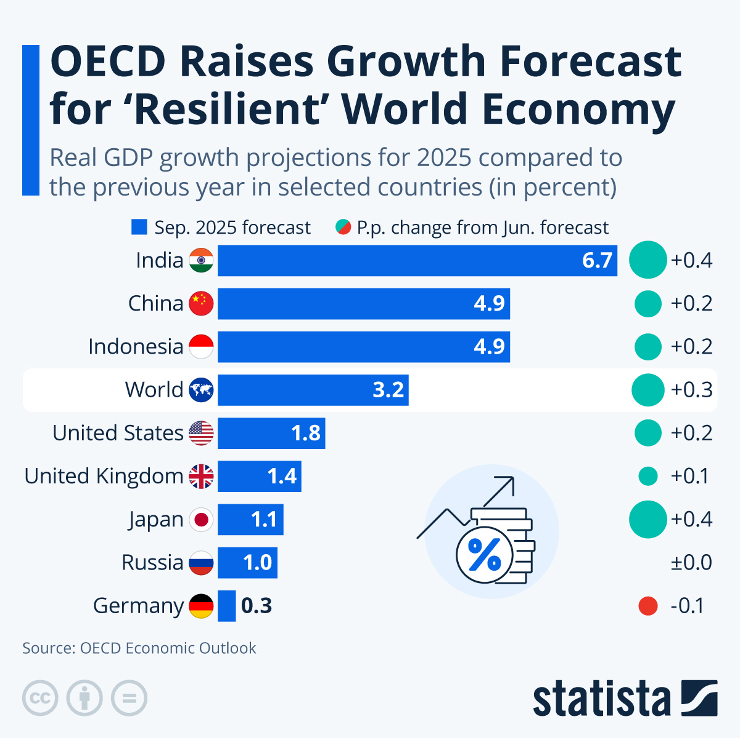
Image Source: @StatistaCharts (Statista.com)
 Easy & quick
1. Register on SCORES portal
2. Mandatory details for filling complaints on SCORES
Name | PAN | Address | Mobile | Number | E-mail ID
3. Benefits
Effective Communication
Speedy redressal of the grievances
