Last week was quite a rollercoaster ride in the Indian stock market. Both the Nifty Smallcap 100 index and the Nifty Midcap 100 index took a tumble, dropping by 5.49% and 4.66% respectively.
All the major indices ended in red during the week, except for Nifty IT. Nifty PSE, CPSE, and Realty bore the brunt of the downturn, emerging as the worst-hit indices. On a brighter note, data analysis suggests that Bank Nifty might be gearing up for a bull rally in the next three months, offering a glimmer of hope for investors. However, there's a cloud looming over the horizon as the rising US 10-year bond yield puts pressure on the Indian markets. Further, it looks like the down ride for small caps and midcaps might not be over just yet.
Nifty ended the week 2.09% lower at 22,023. Nifty IT surged the most with a gain of 1.08%.
Scroll down to understand more of such market news and perspectives for the week gone by in easily understandable charts.
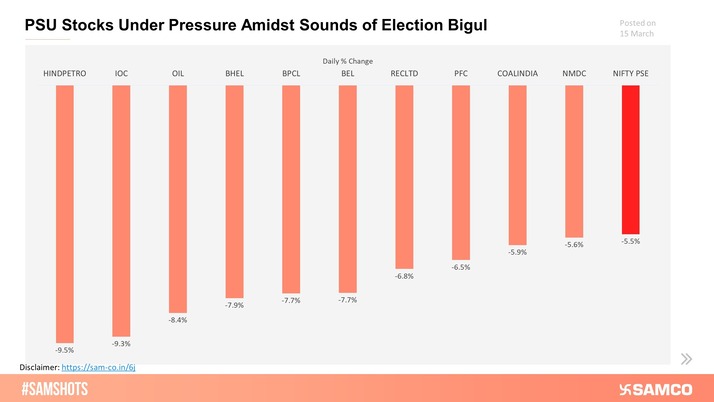
PSU Stocks were among the worst affected stocks on Friday!


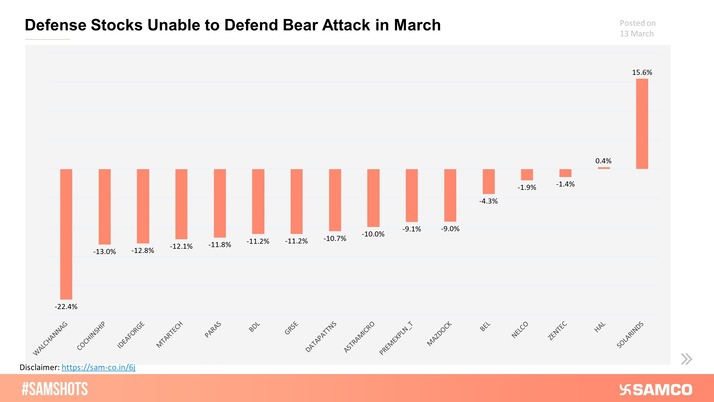
The share prices of defense stocks tumbled on Wednesday as the bloodbath continues in small and midcaps.
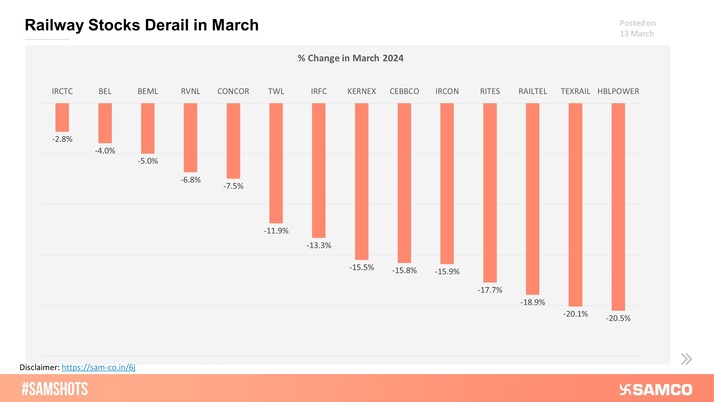
Railway stocks which created a buzz in the bull market witnessed a significant decline during March 2024.
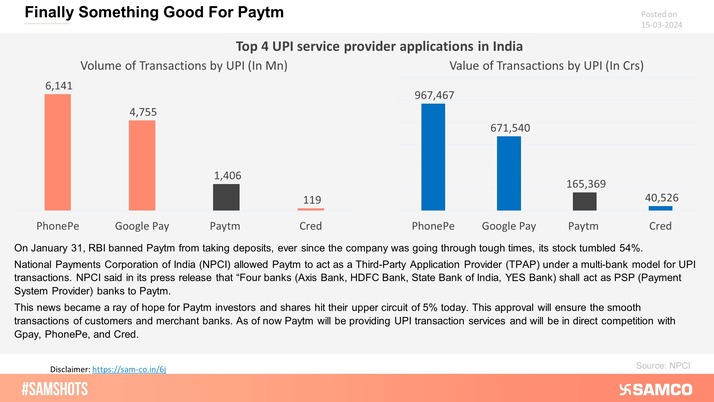
Here’s why Paytm Hit Upper Circuit today!
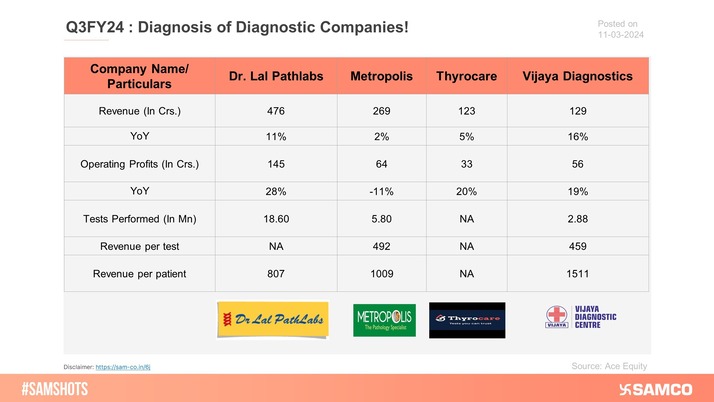
Here’s how the diagnostic companies performed during the quarter ending Q3FY24!
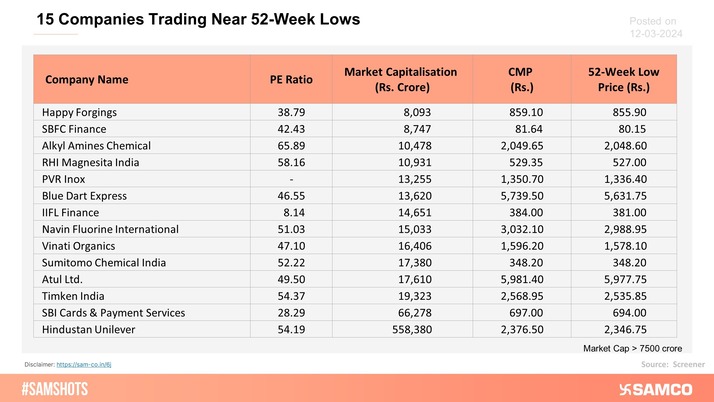
The table comprises a list of stocks trading near their 52-week lows.
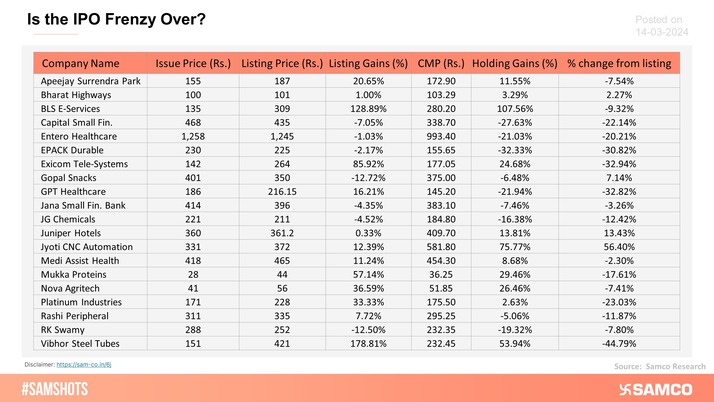
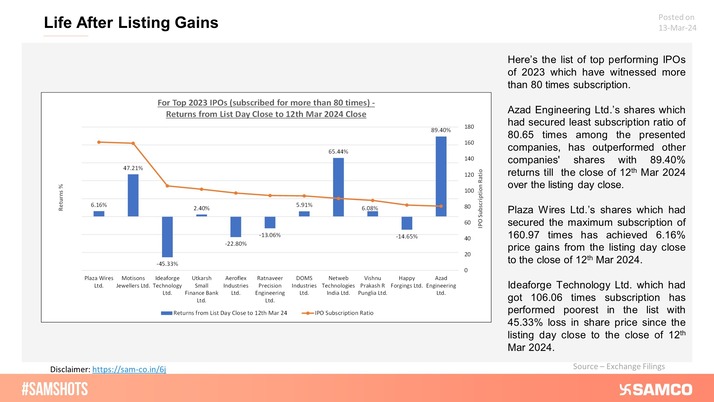
The accompanying chart describes the performance of the recent IPOs!
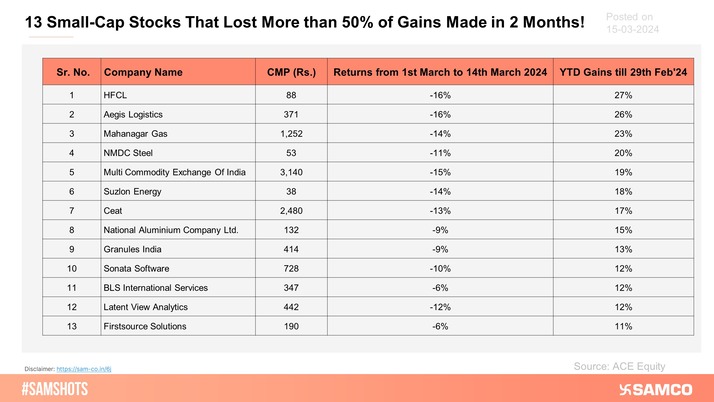
Here are 13 stocks that lost more than 50% of gains made in 2 months within 15 days!
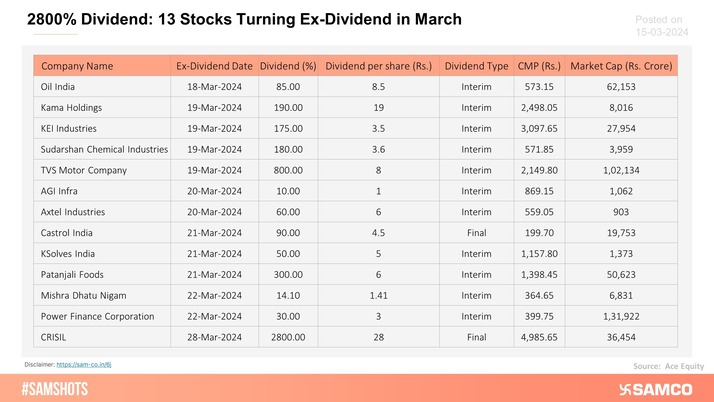
The table below covers 13 stocks that will turn ex-dividend in March.
Whether superhit IPOs continue to perform well after giving listing gains? Let’s analyze this for the top 11 IPOs of 2023 which had crossed 80 times the subscription ratio:
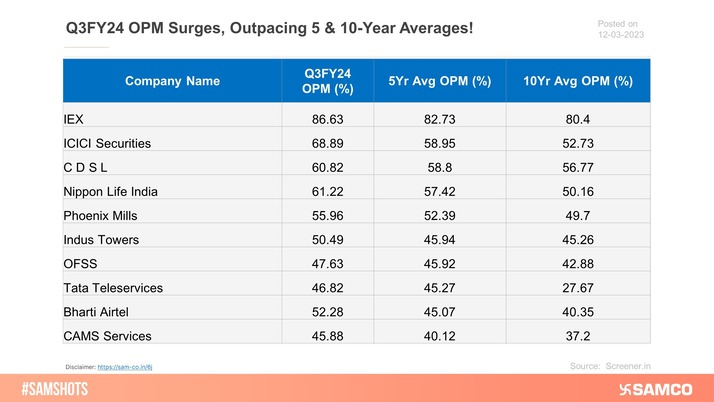
The Operating Margins of Companies in Q3FY24 that outpaced their average OPM in 5-year & 10-year periods:
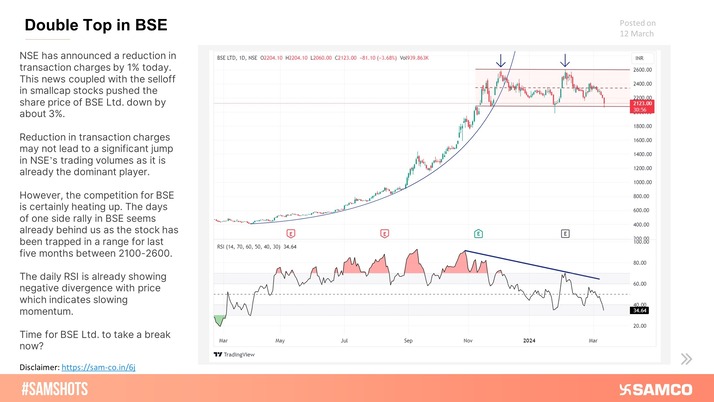
Double Top in BSE
Empirical data reveals that Bank Nifty is set for a bull rally over the next 3 months.

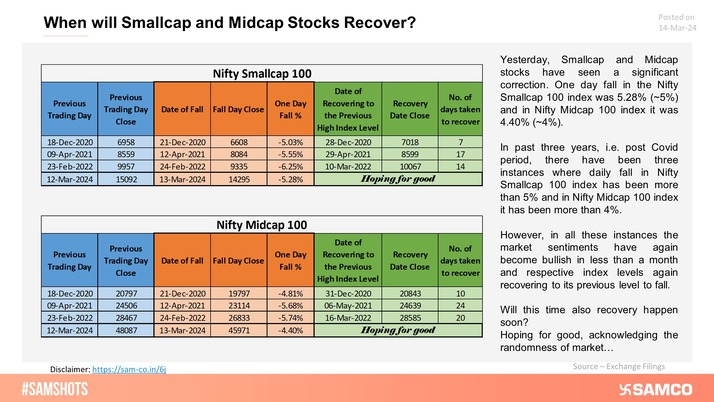
The market does not move in a straight path. Take a look at the time it takes to reach the original level after a major single-day fall:
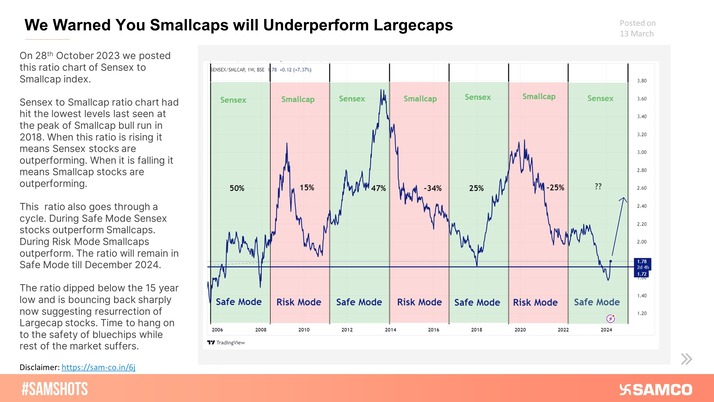
The below chart refers back to our insight published on 28th October 2023 where we expected the outperformance of largecaps over smallcaps.
Here’s why down ride for small caps might not be over yet!
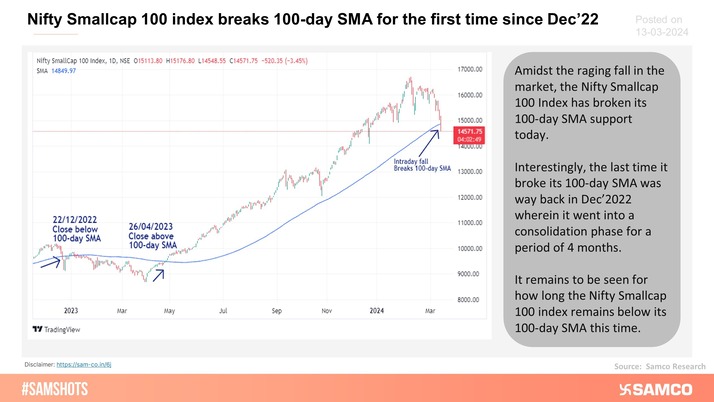
The Nifty Smallcap 100 index broke its 100-day Simple Moving Average (SMA) on Wednesday when the market saw a brutal fall.
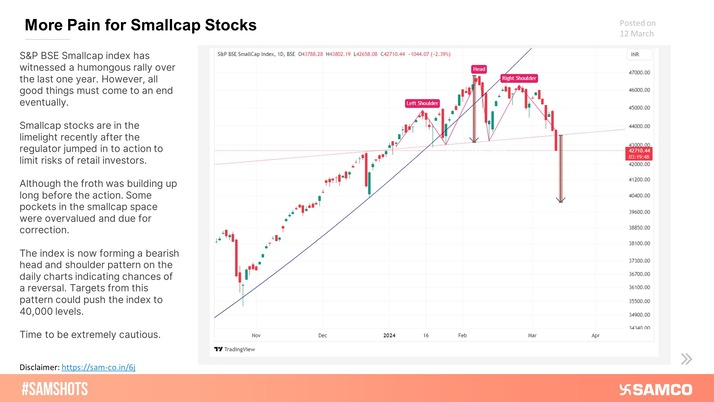
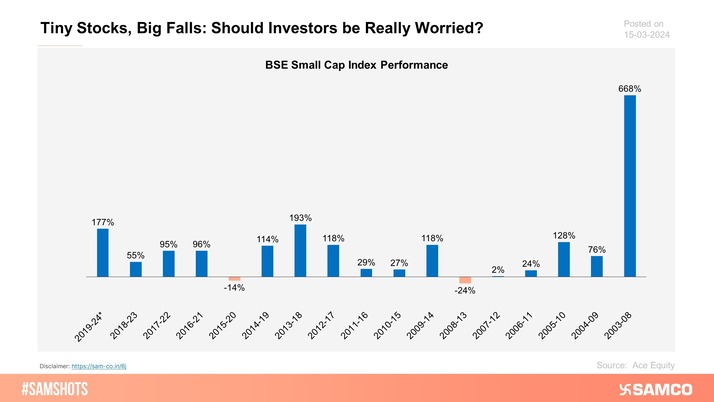
The below chart represents the performance of BSE Small Cap Index since its inception.
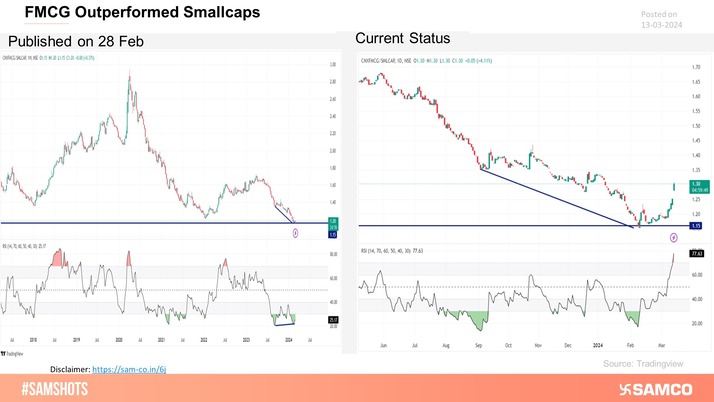
As we informed earlier the FMCG outperformed Smallcaps from 28th Feb-24.
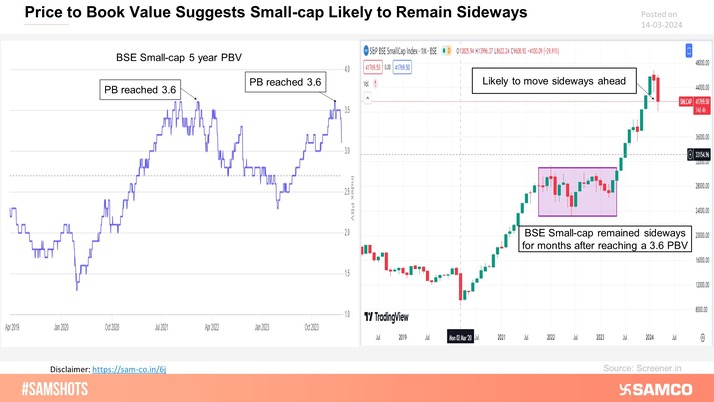
A snapshot of price-to-book value suggesting that the small-cap would likely to remain sideways.
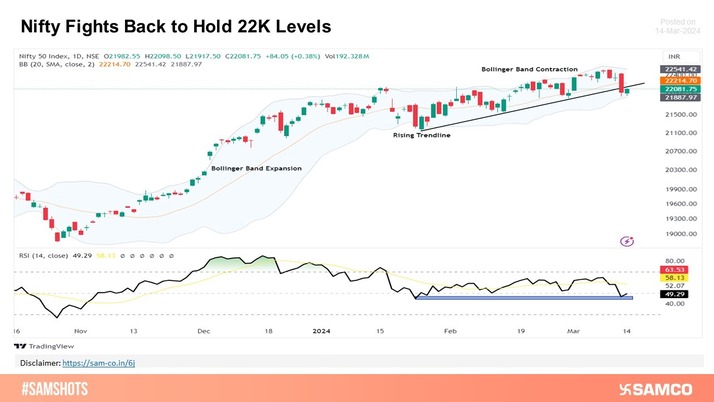
Watch out how Nifty sustains 22K levels!
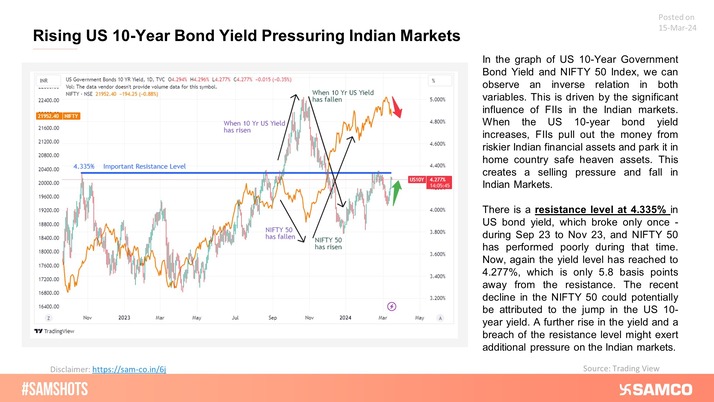
Whether US risk-free rate affect the Indian equity market? Here’s an attempt to answer the same and also provide a depiction of the inverse movement of both variables:
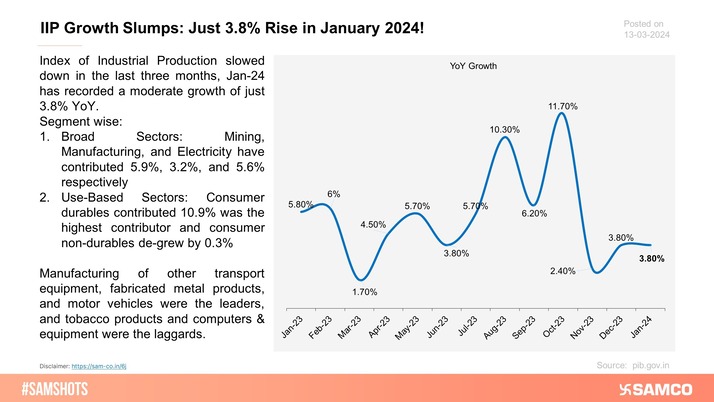
Data on the Index of Industrial Production for the month of January 2024!
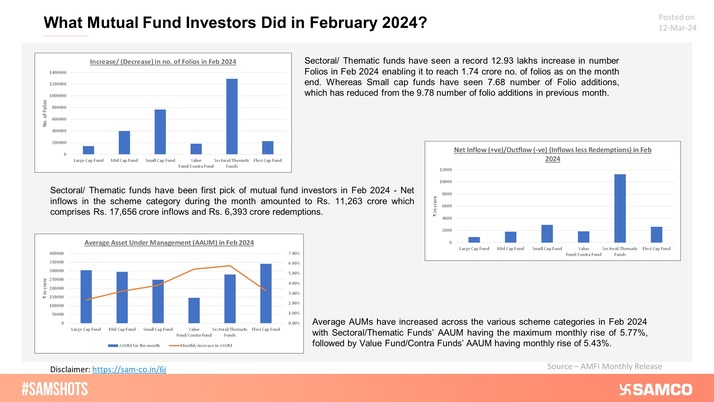
For Mutual Fund Schemes - Increase in number of folios, Net inflow of funds, and Average AUM for February 2024
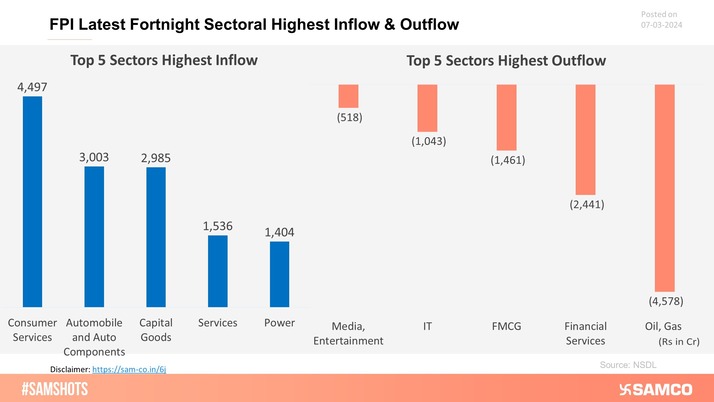
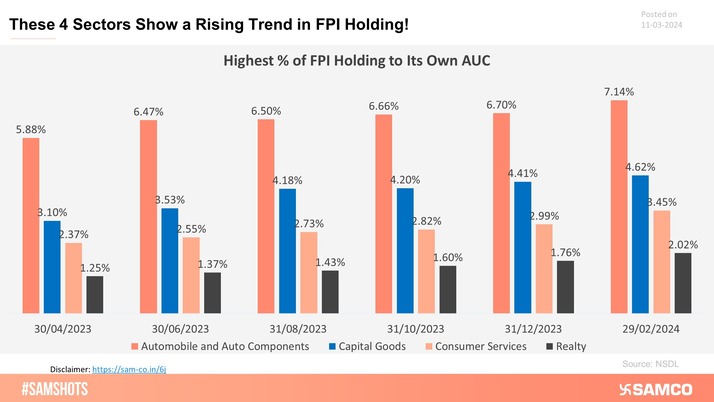
Sectoral Highest Inflow & Outflow by FPI in Latest Fortnight.
The below chart discloses the rising trend of the Assets Under Control in these sectors.
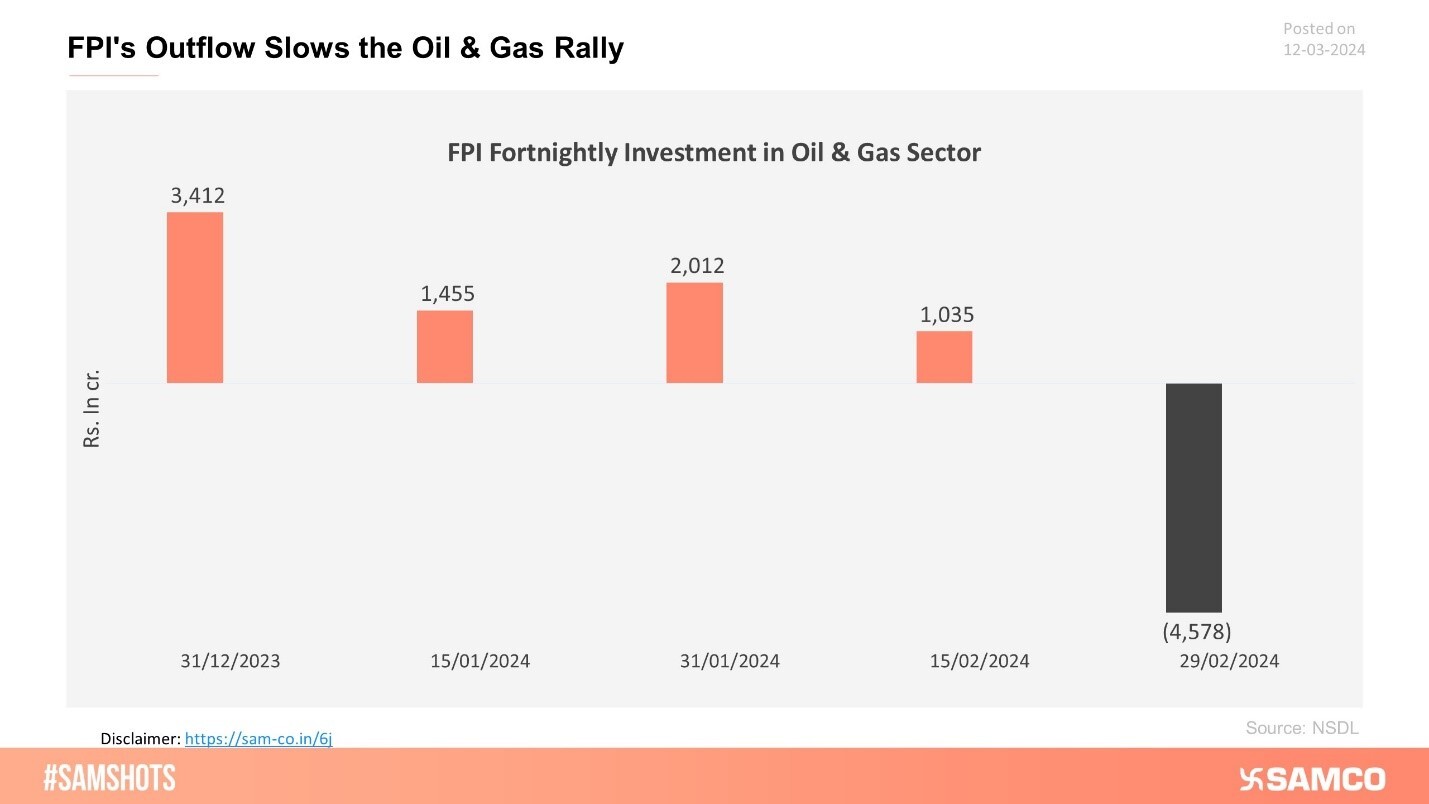
Here’s the quick view of outflow by FPI in the Oil & Gas sectors as per the latest fortnight release.
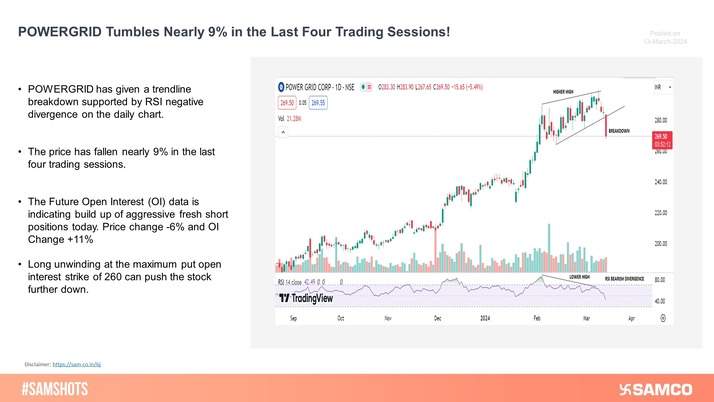
POWERGRID has given a trendline breakdown supported by RSI bearish divergence on the daily chart
NMDC is down 20% in the last five trading sessions. The fall intensified after the price broke the trendline and 50 DEMA on the daily chart earlier this week.
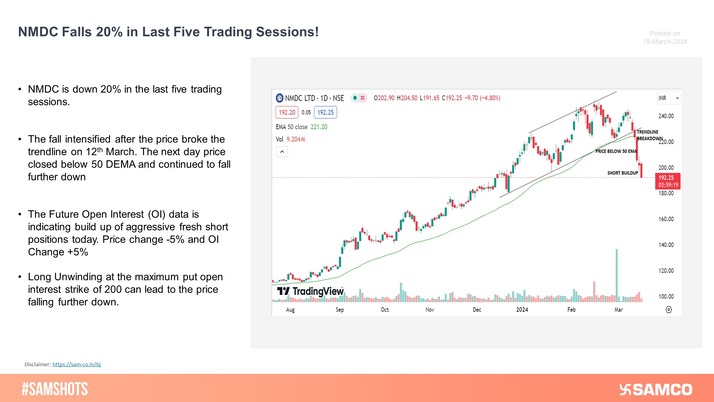
Image Source: @VCElements (Twitter)


 Easy & quick
1. Register on SCORES portal
2. Mandatory details for filling complaints on SCORES
Name | PAN | Address | Mobile | Number | E-mail ID
3. Benefits
Effective Communication
Speedy redressal of the grievances
