The past week featured significant developments at both the company and economy levels. Major banking institutions unveiled their quarterly financial results, with HDFC, the largest private sector bank, presenting a mixed set of figures. This led to a substantial 4.28% decline in the Bank Nifty on Wednesday. In the week gone by bank nifty witnessed its biggest weekly fall in a year. Despite the Nifty reaching an all-time high of 22,124 on Tuesday, it faced setbacks due to the Bank Nifty's performance. On the macroeconomic front, India's trade deficit exhibited positive performance, hitting a three-month low. The Nifty50 concluded the week with a 1.47% decline. Overall, the financial landscape witnessed fluctuations driven by corporate reports and macroeconomic indicators, influencing market indices and trading sentiments throughout the week.
Scroll down to understand more of such market news and perspectives for the week gone by in easily understandable charts.
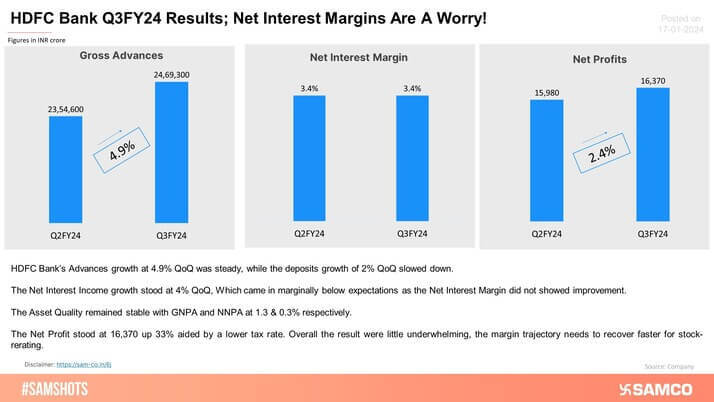
Mixed Bag for HDFC Bank in Q3FY24!


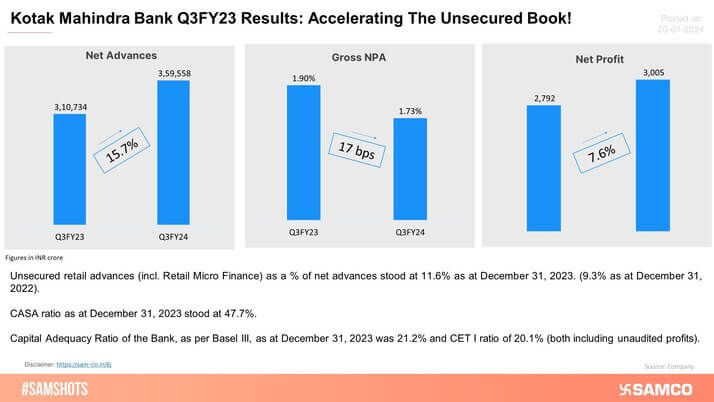
Kotak Bank Reports its Q3FY24 results!
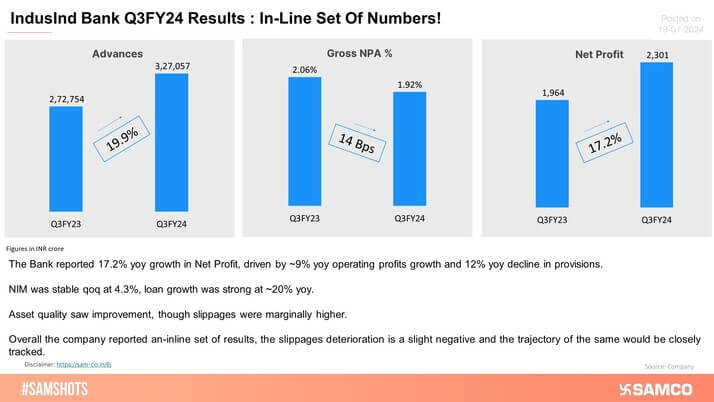
IndusInd Bank Q3 Results: Higher Slippages Cautions Market!
The accompanying chart presents the P&L breakup of HUL for the Quarter ending 30th Dec. 2023.
_ep13.jpg)
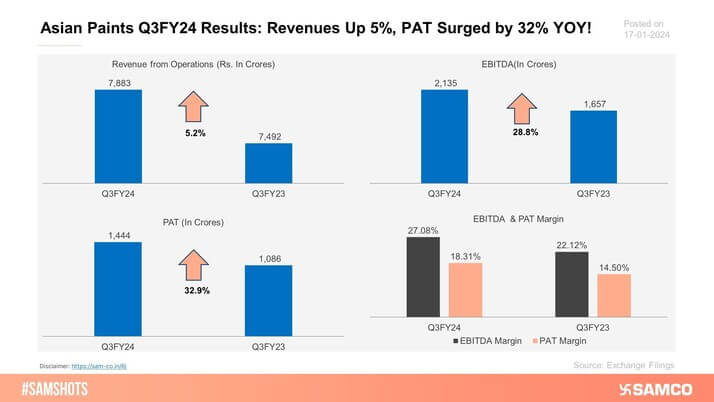
Here’s how Asian Paints performed for the quarter ending 30th Dec 2023
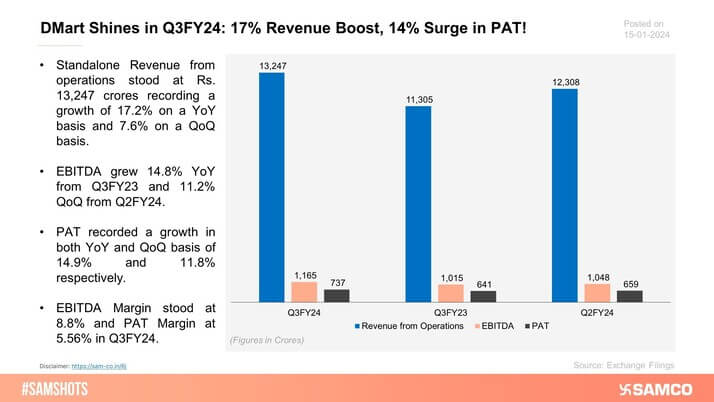
The below chart represents the performance of DMart in Q3FY24.
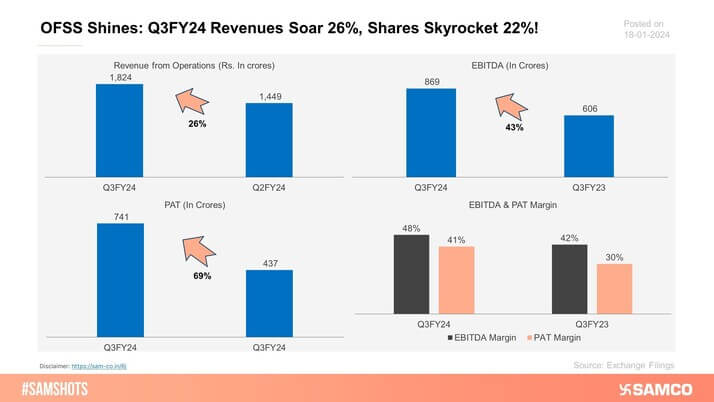
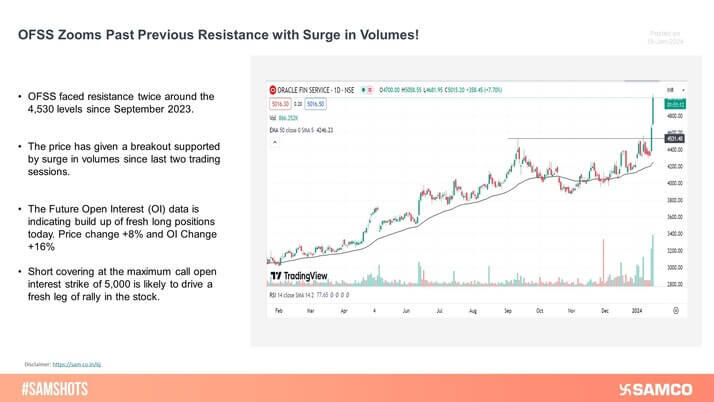
Here are the results of OFSS for Q3FY24.
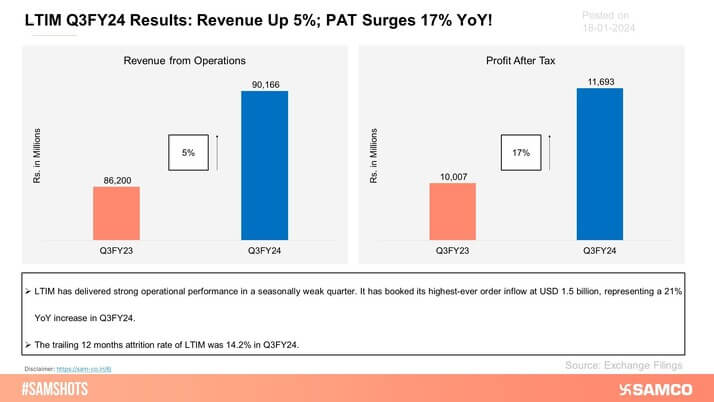
Here’s how LTIM performed during Q3FY24!
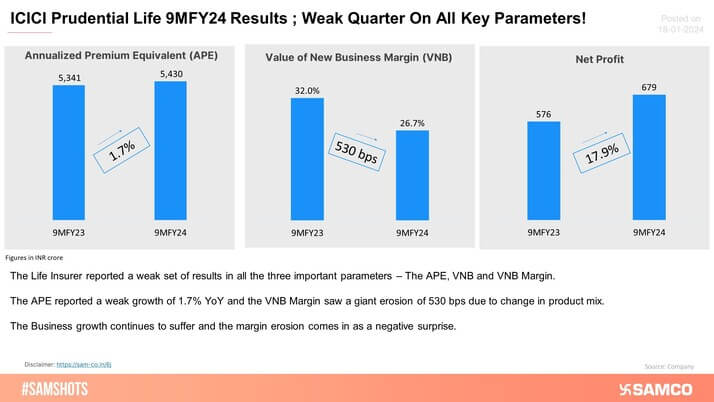
ICICI Pru Life 9MFY24 Results; The Weak Show Continues!
The accompanying chart represents the performance of Himadri Specialty Chemicals Ltd during Q3FY24.
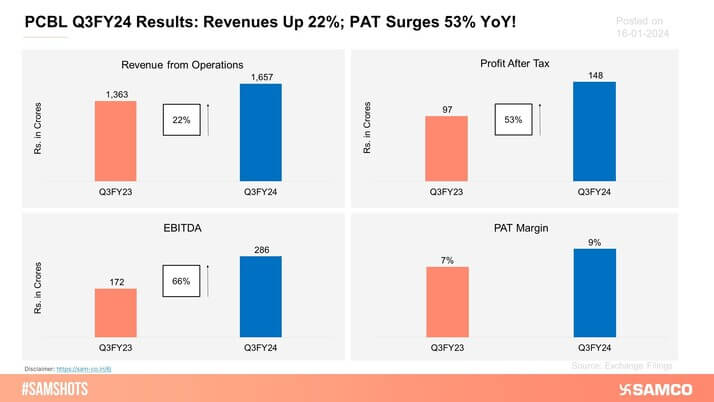
PCBL has reported strong Q3FY24 results!
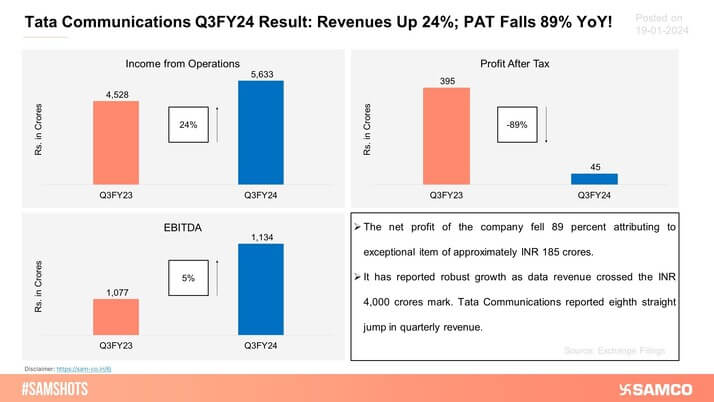
The below chart indicates the financial performance of Tata Communications Ltd. during Q3FY24.
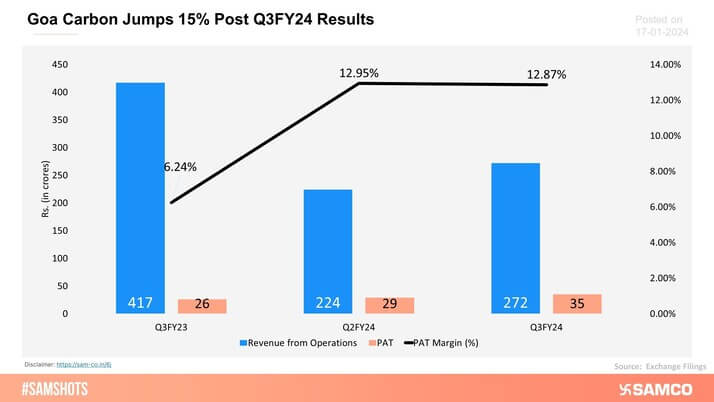
The chart below shows Goa Carbon’s Q3FY24 results.
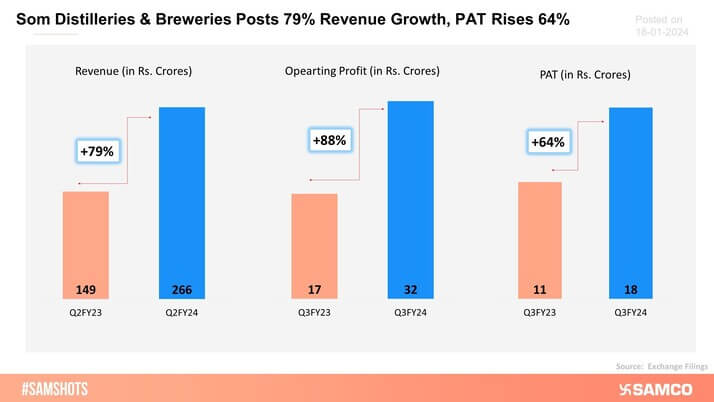
Som Distilleries & Breweries posted an excellent set of Q3FY24 results.
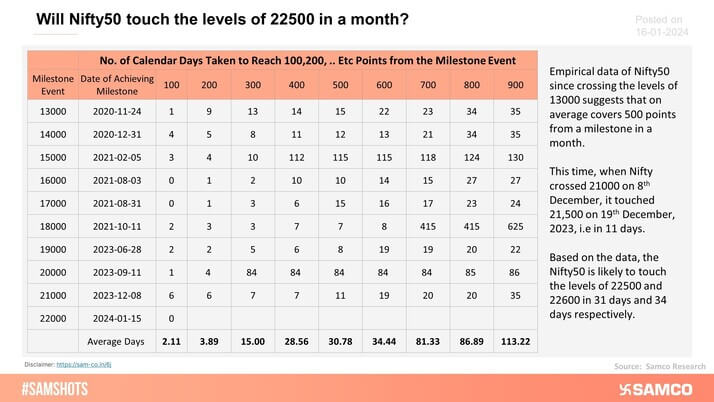
The historical data below touches upon the concept of whether Nifty can cross the levels of 22500 in a month.
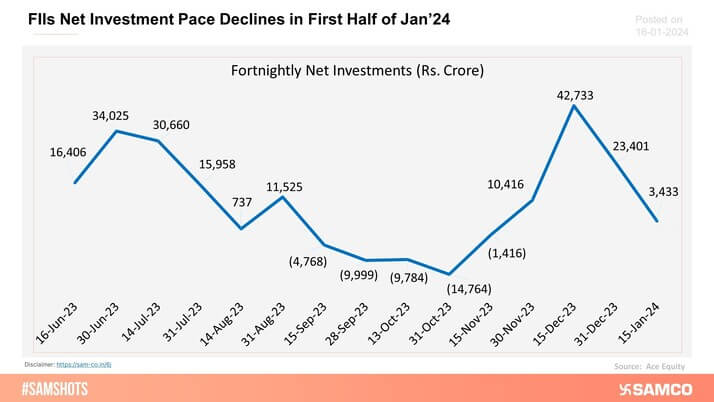
Foreign Institutional Investors (FIIs) net invested Rs.3,433 crore in the first half of Jan’24. The investment pace has seen a decline when compared to the past 3 fortnightly investments.
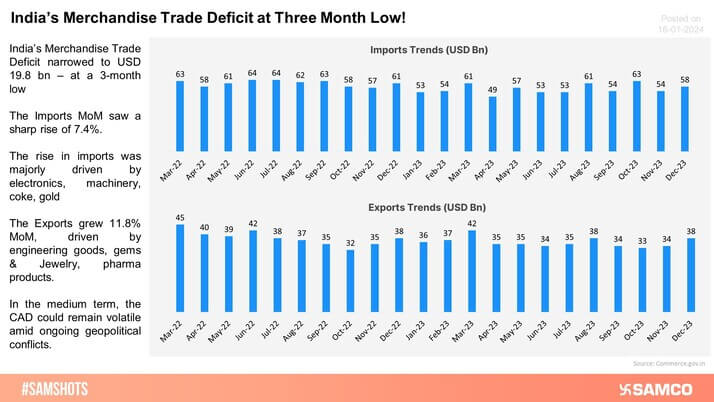
India's Trade Deficit At 3 Month Low!
OFSS has zoomed past its previous resistance supported by surge in volumes and long buildup in Future Open Interest (OI) data.
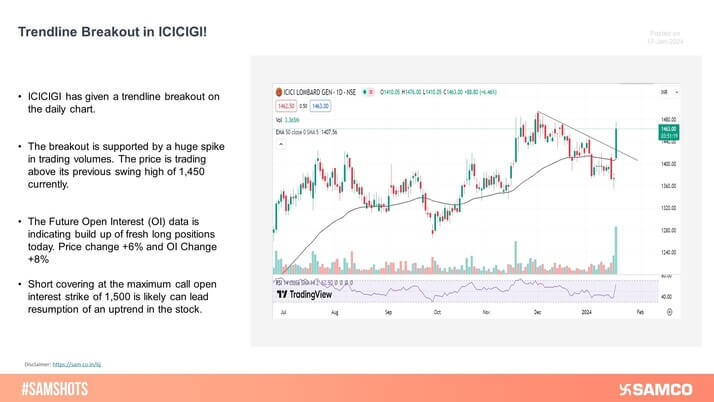
ICICIGI has given a trendline breakout on the daily chart. The price retested the trendline support and bounced back.
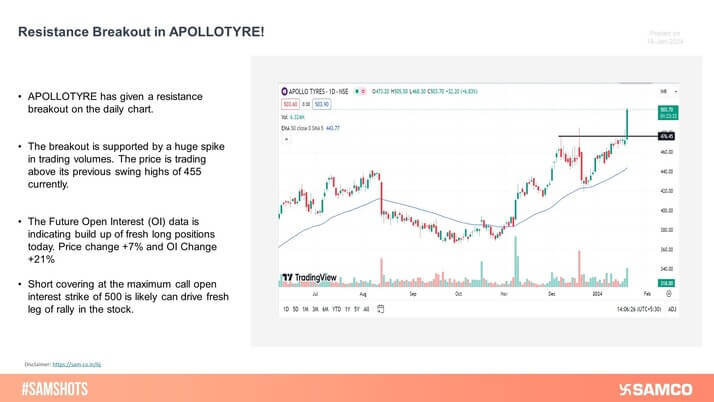
APOLLOTYRE has given a resistance breakout on the daily chart. The level of 475 is likely to act as strong support for the stock.
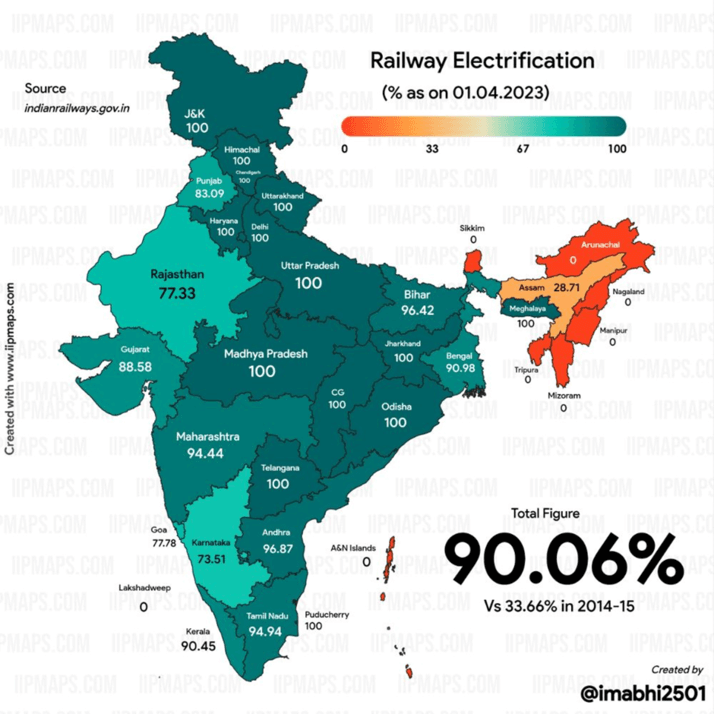
Source: iipmaps


 Easy & quick
1. Register on SCORES portal
2. Mandatory details for filling complaints on SCORES
Name | PAN | Address | Mobile | Number | E-mail ID
3. Benefits
Effective Communication
Speedy redressal of the grievances
