Indian equity markets ended the week on a mixed note, with benchmark indices showing mild gains amid earnings-driven volatility and selective sector rotation. The Nifty 50 and Sensex inched higher, but the broader trend signalled consolidation. Metals (+2.71%), Small caps (+1.75%), and Capital Goods (+0.91%) led market strength, indicating a shift toward cyclical sectors. Meanwhile, PSU Banks (-0.84%), IT (-0.31%), and Pharma (-0.29%) witnessed profit booking as investors reduced exposure to recent outperformers.
In the commodities market, precious metals dominated the headlines.
Gold reached an all-time high of approximately ?1.39 lakh per 10g this week, driven by safe-haven demand, central bank buying, and expectations of global rate cuts. Silver also surged to ?2.35 lakh per kg, briefly touching lifetime levels. Despite intraday swings, sentiment remains bullish as macro conditions continue to support bullion.
On the policy front, the RBI maintained liquidity support, injecting nearly ?2,00,000 crore via OMO operations to manage money market stability without compromising on inflation control. The move reinforces a balanced “Goldilocks” stance, neither tight nor overly loose, helping banking system liquidity and short-term credit flow.
Overall, markets remain selectively strong, with cyclicals outperforming as heavyweights consolidate.
Scroll down to understand more of such market news and perspectives for the week gone by in easily understandable charts.
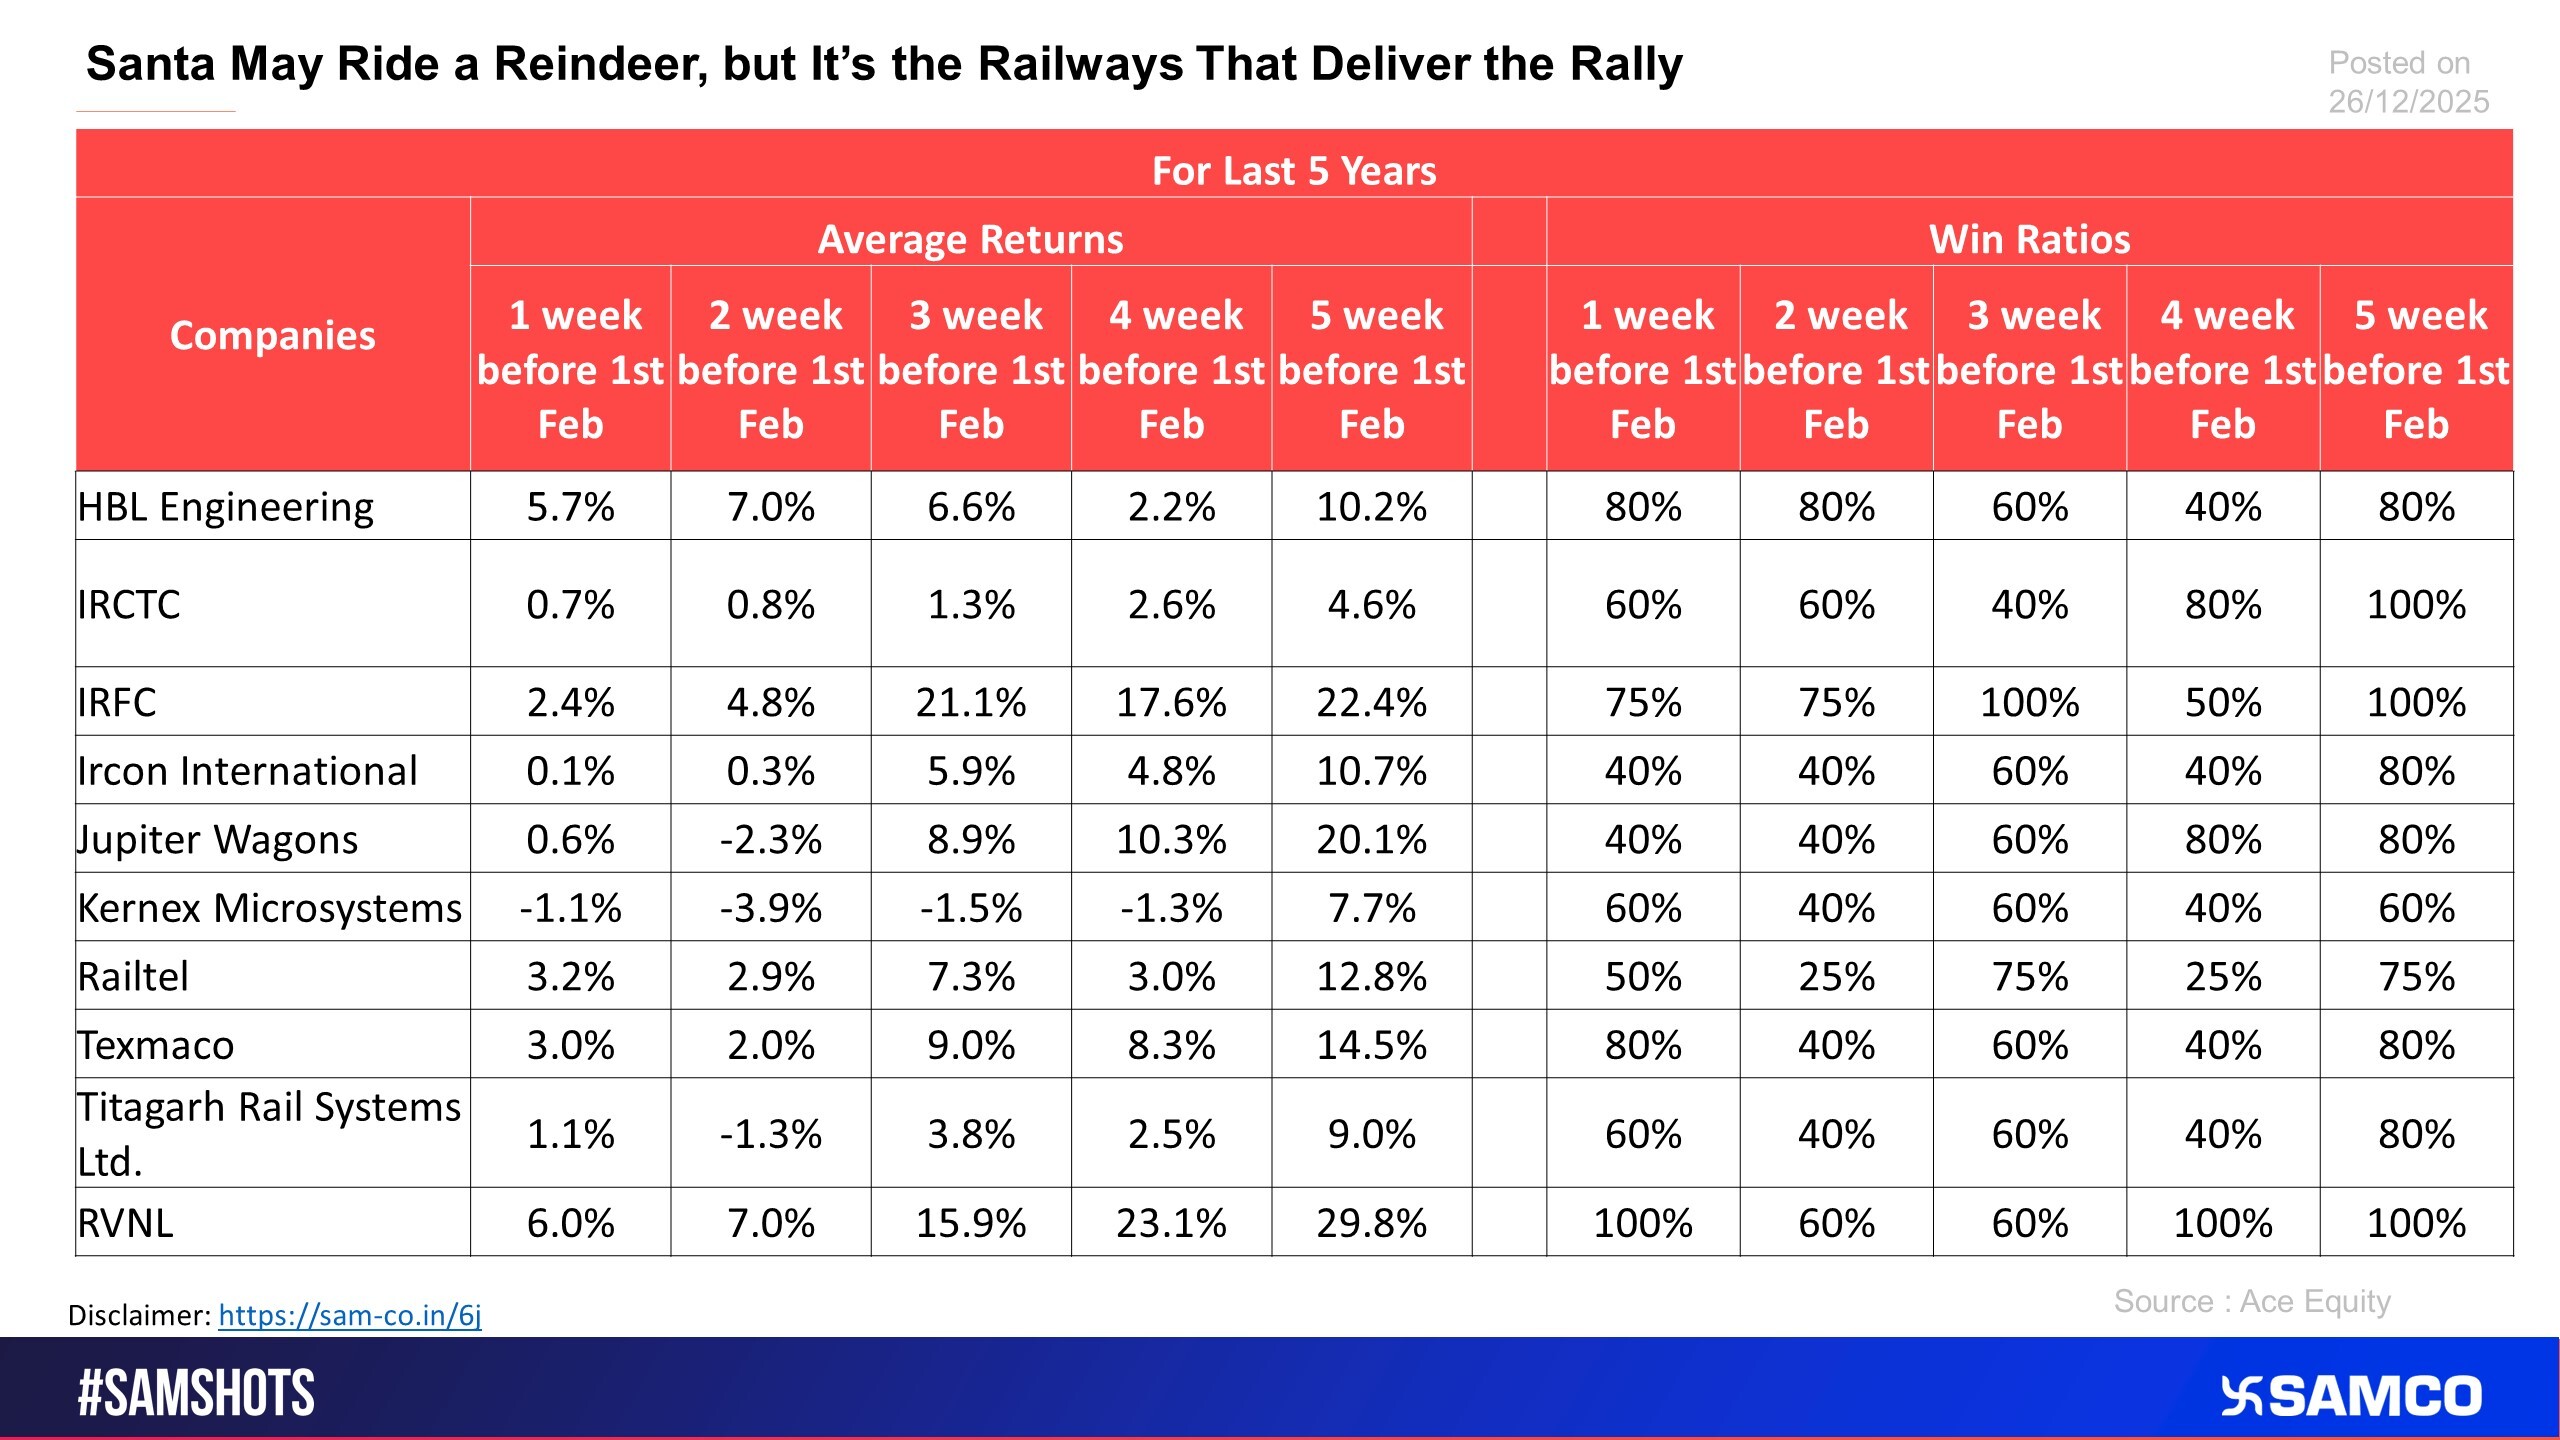
The table evaluates the pattern seen in railway stocks before the budget


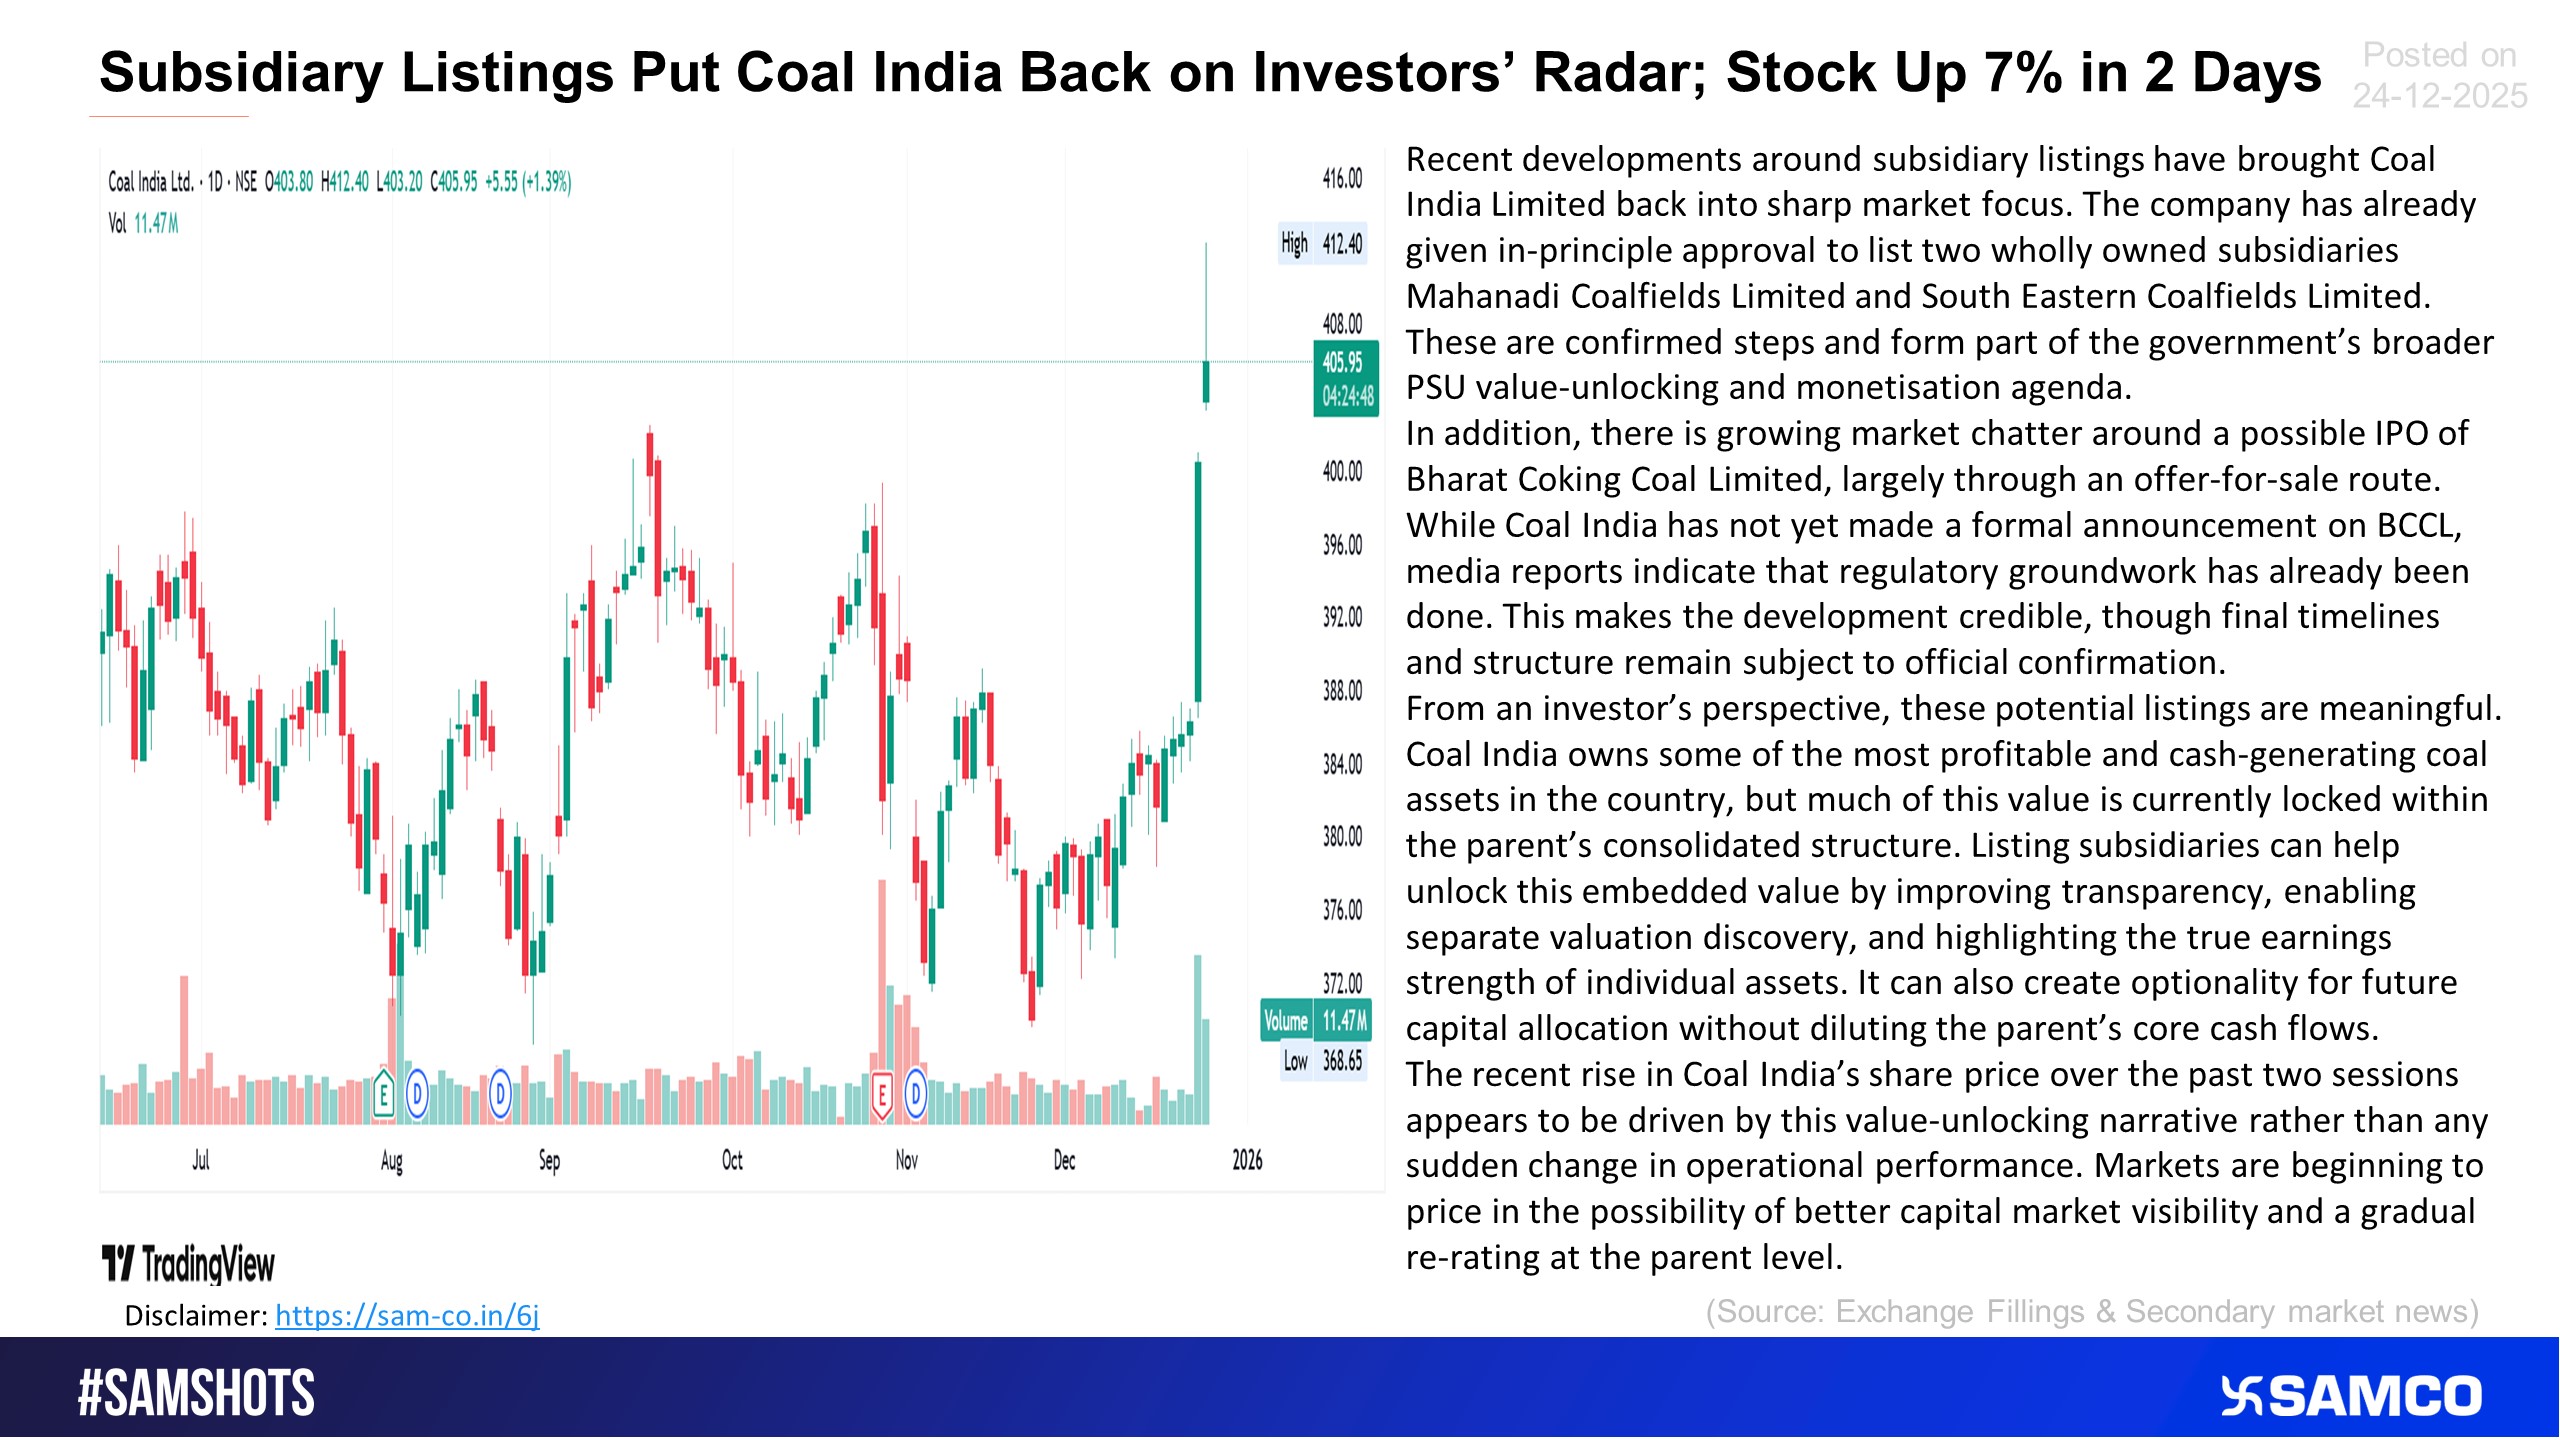
Here’s why Coal India remained in the limelight this week.
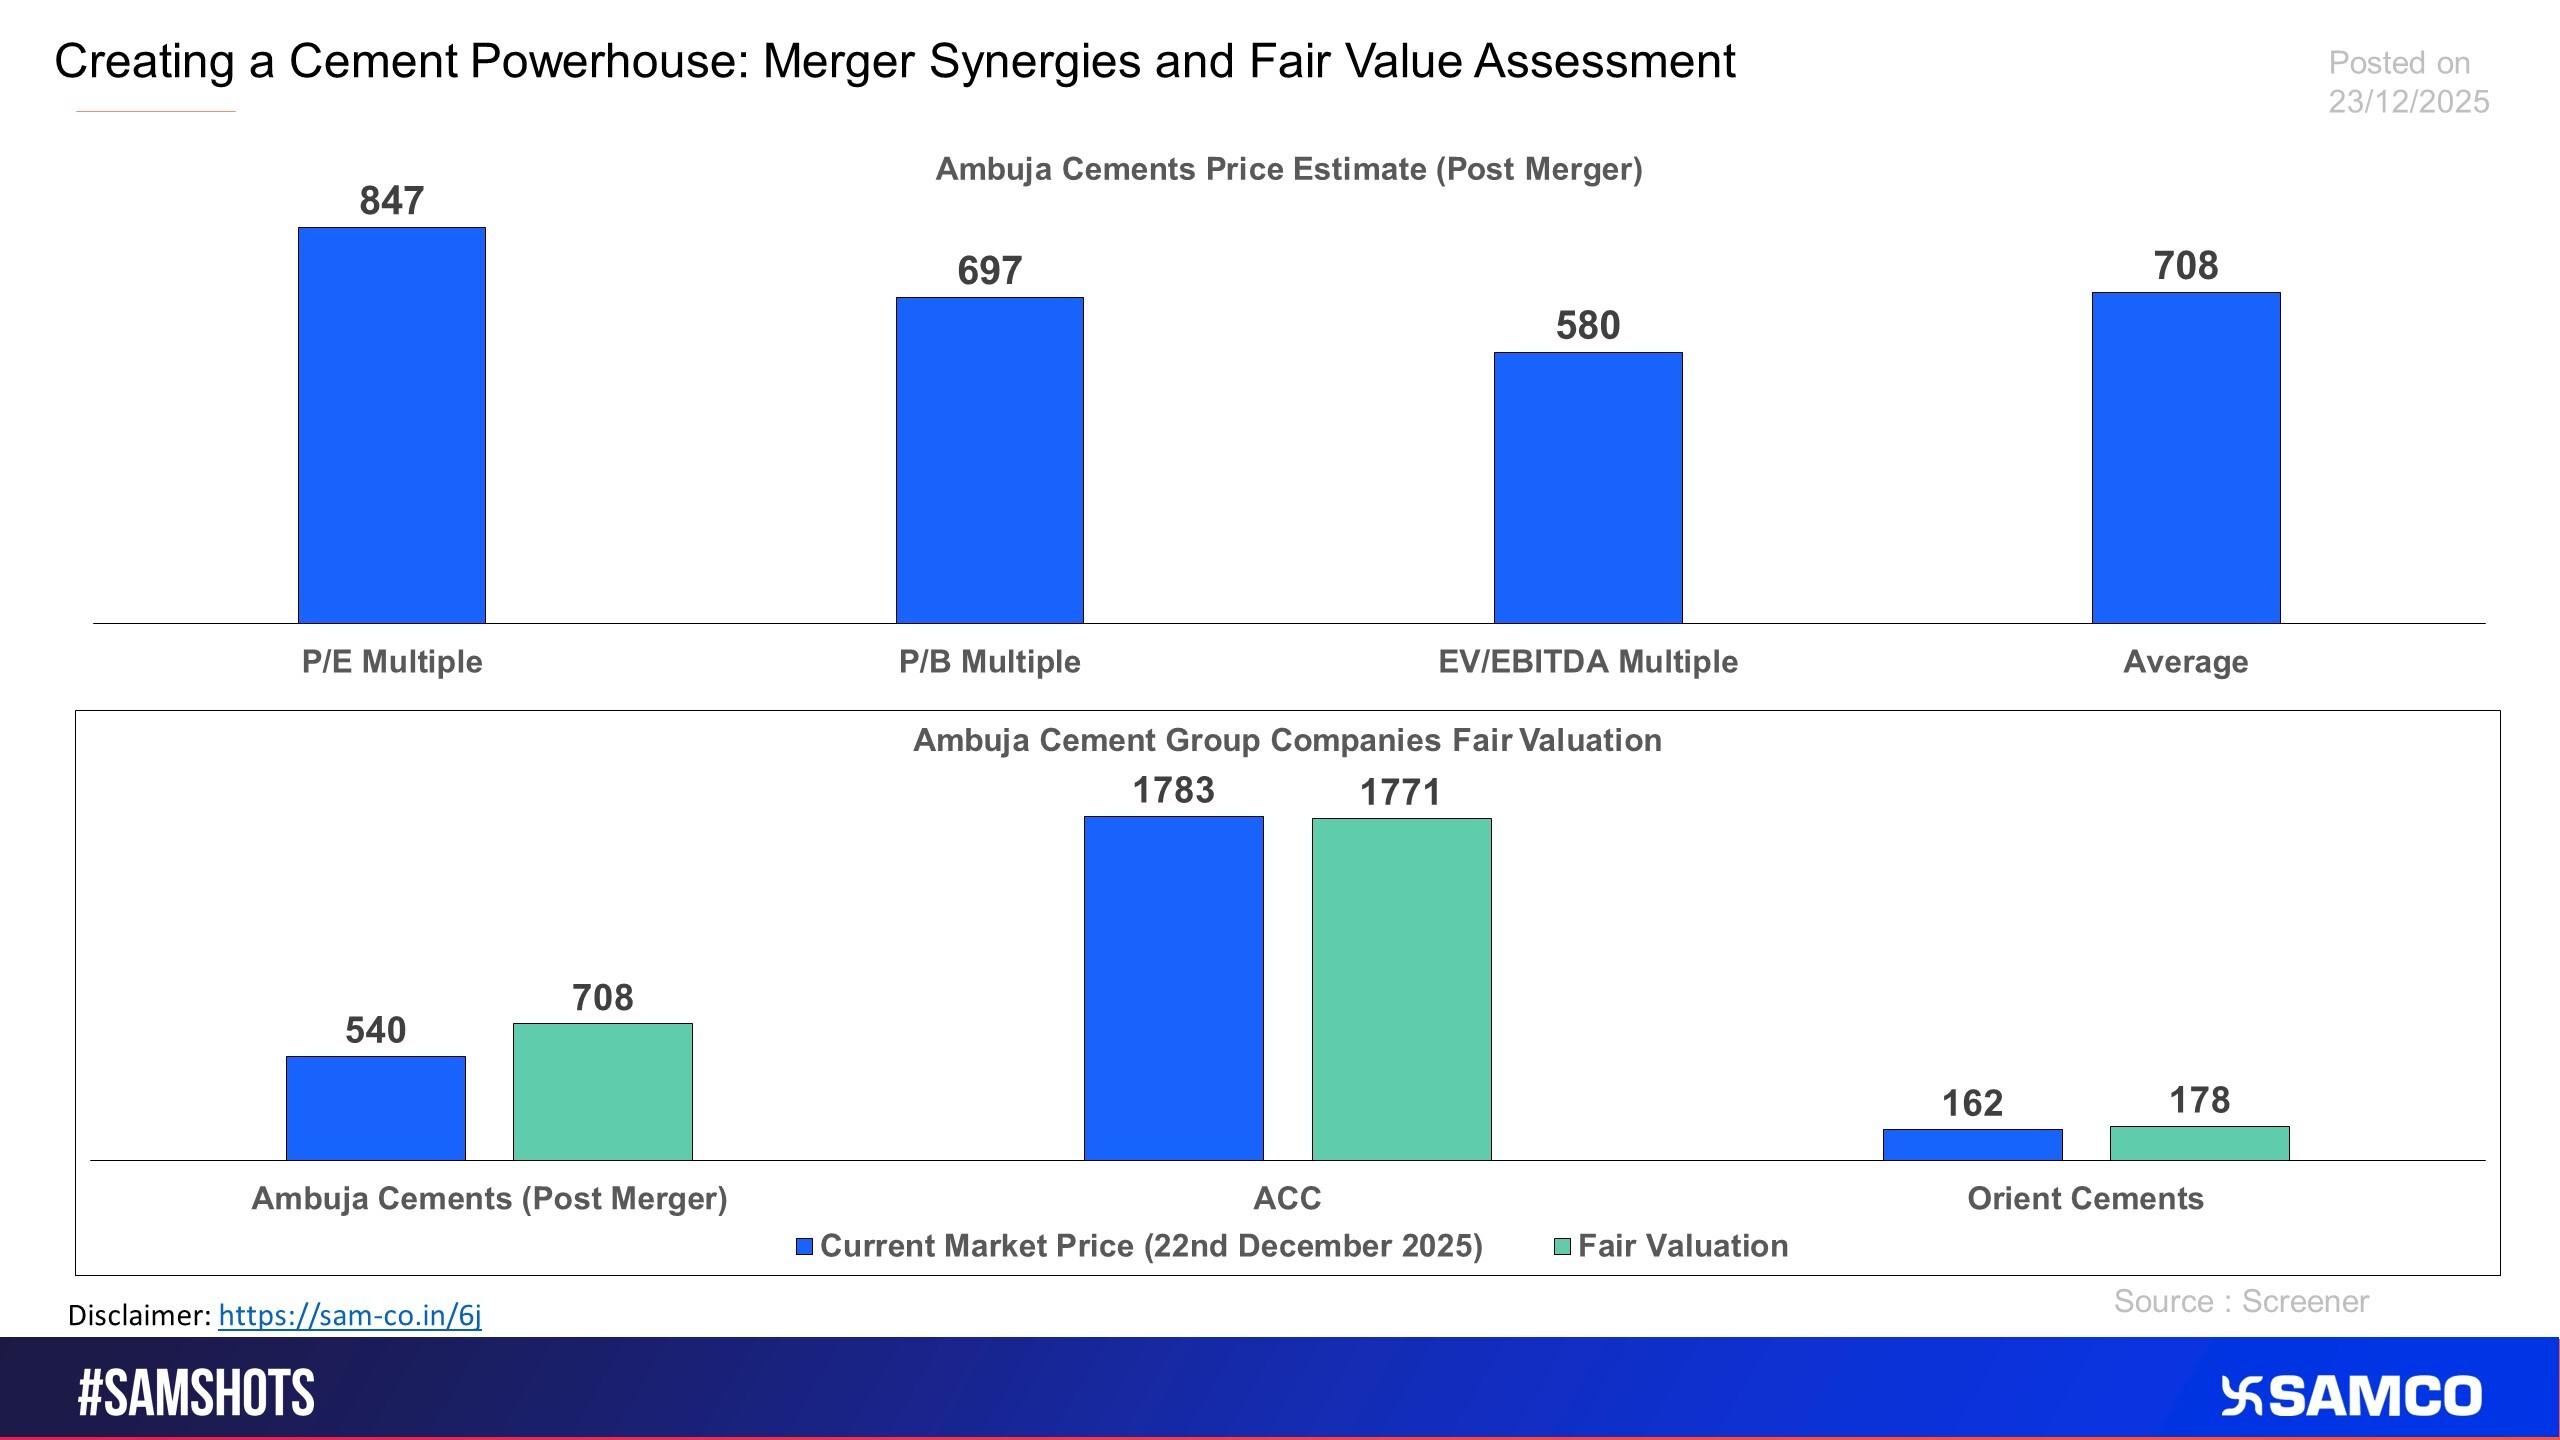
The chart analyses the potential impact on the merger of ACC and Orient into Ambuja
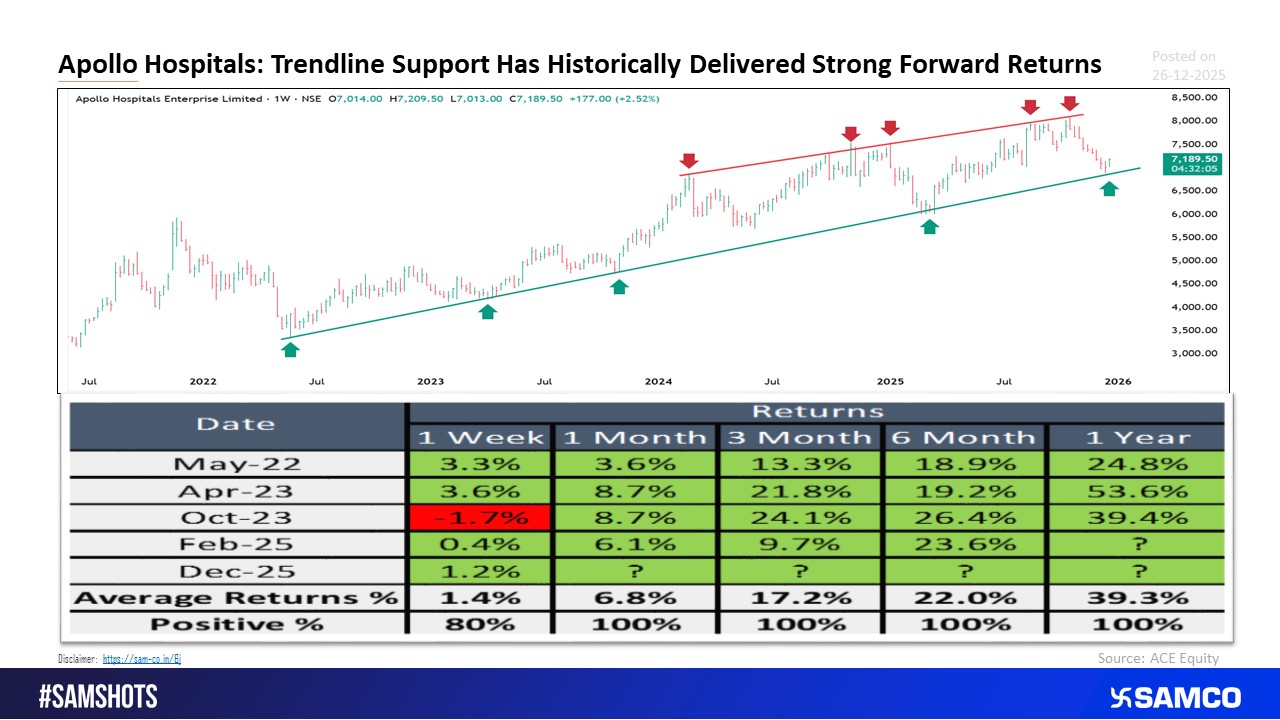
Apollo Hospital Pullback to Long-Term Trendline: Will History Repeat?
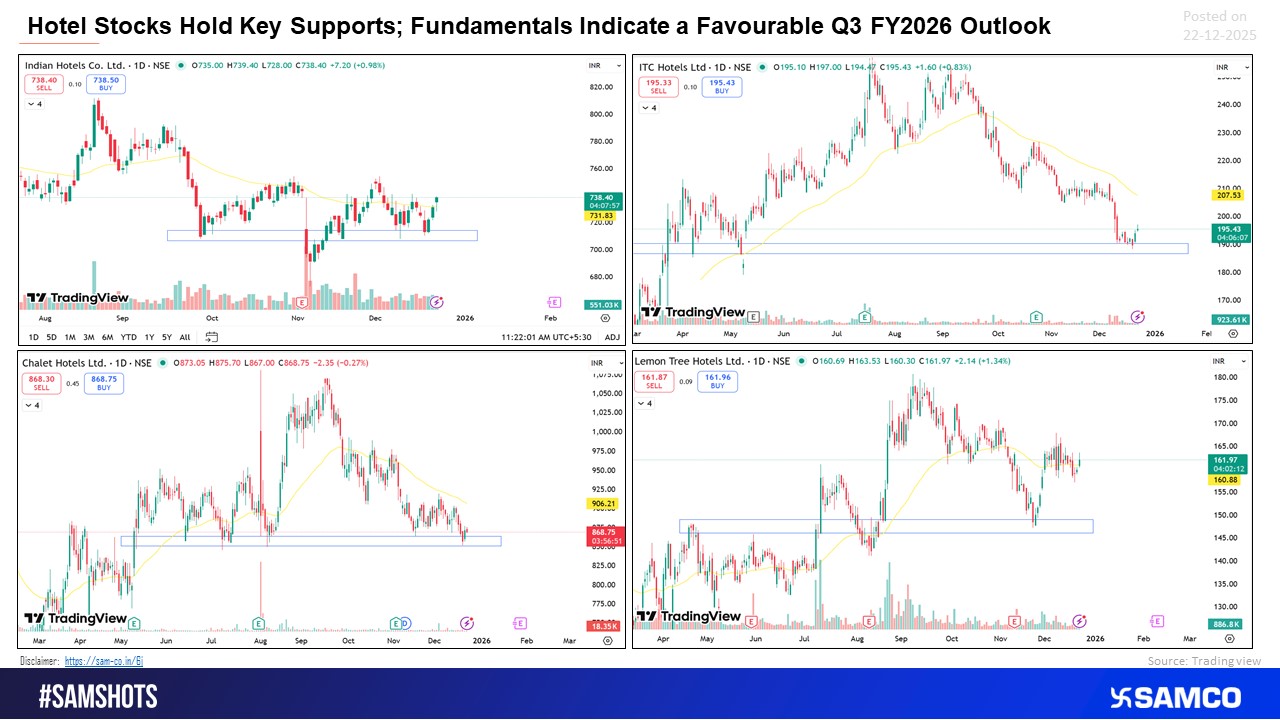
Hotel stocks are holding key supports - technical stability meets a strengthening Q3 demand outlook.
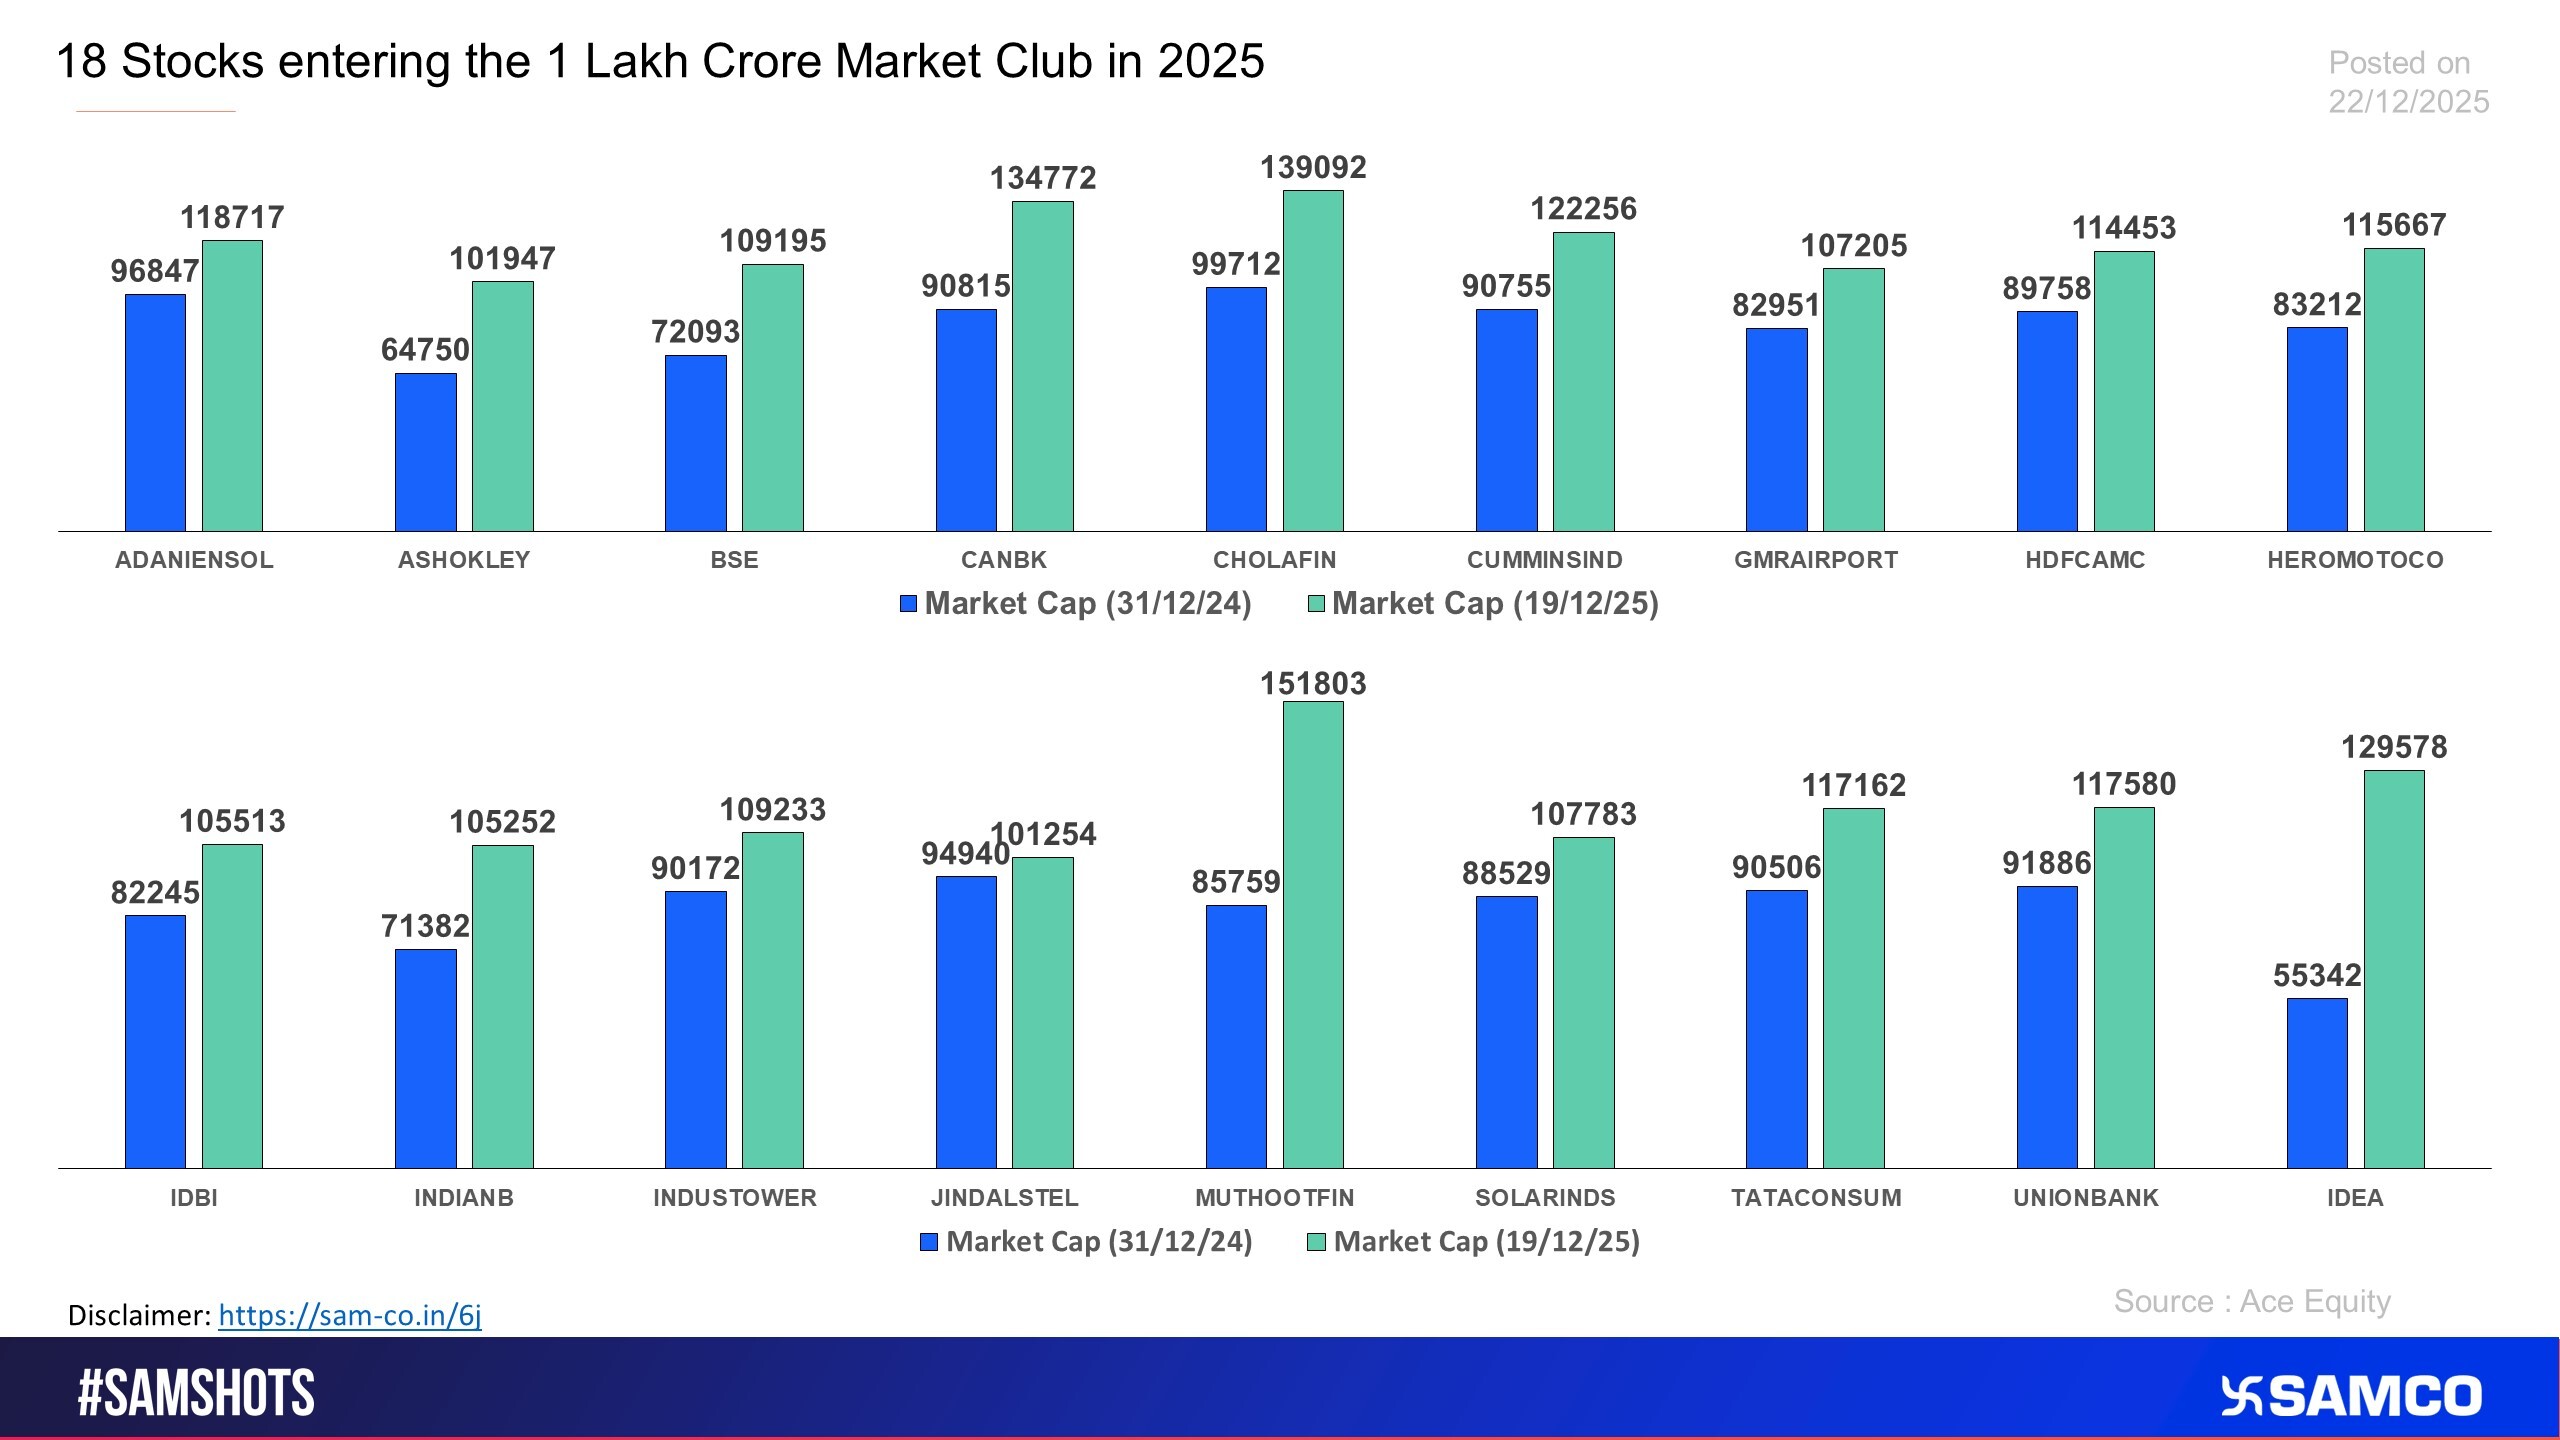
The chart lists stocks entering the 1 Lakh crore market club in 2025
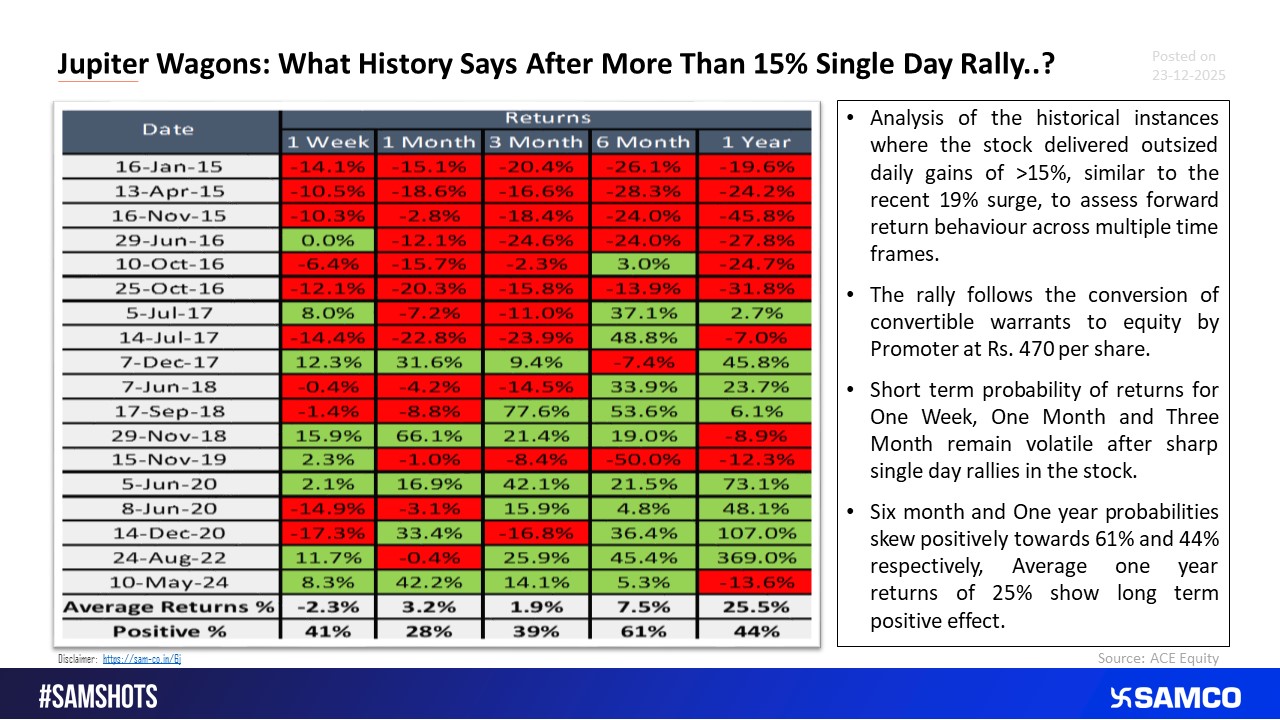
Forward Returns for Jupiter Wagons After 19% Rally In A Single Day.
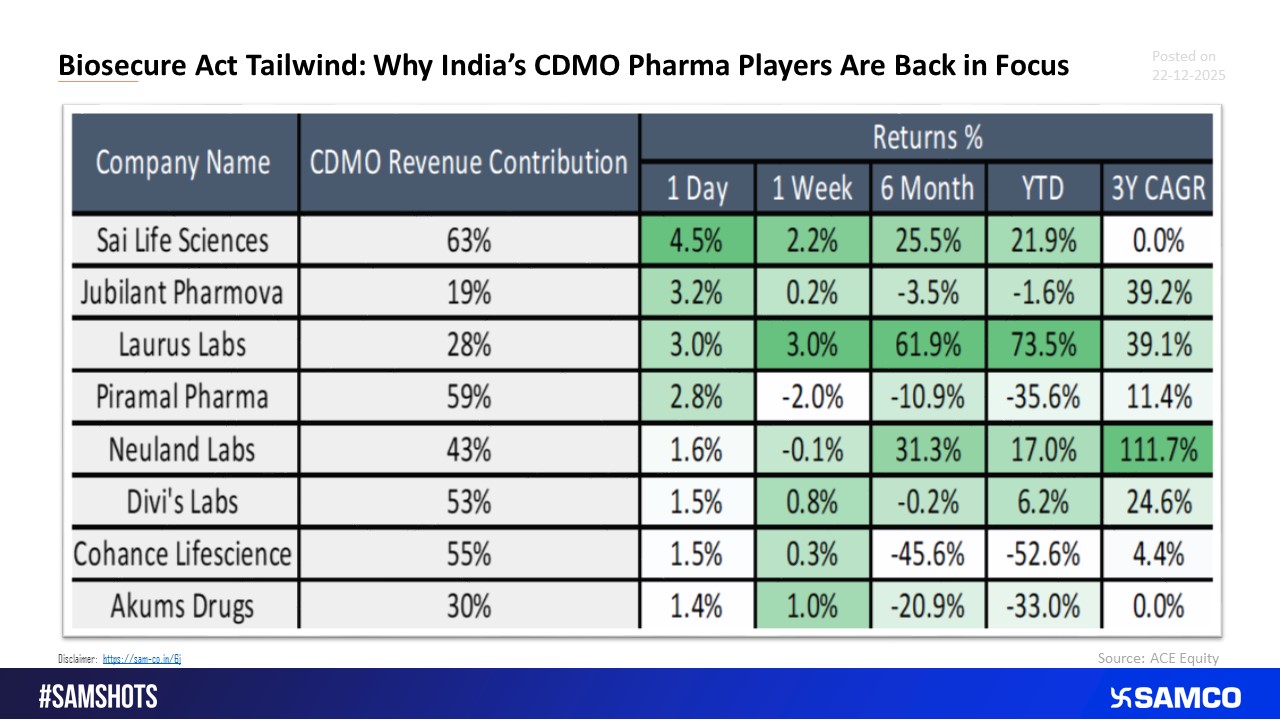
CDMO Companies Gain on Passing of Bio secure Act.
Metals and small caps led the week, while banks and IT underperformed.

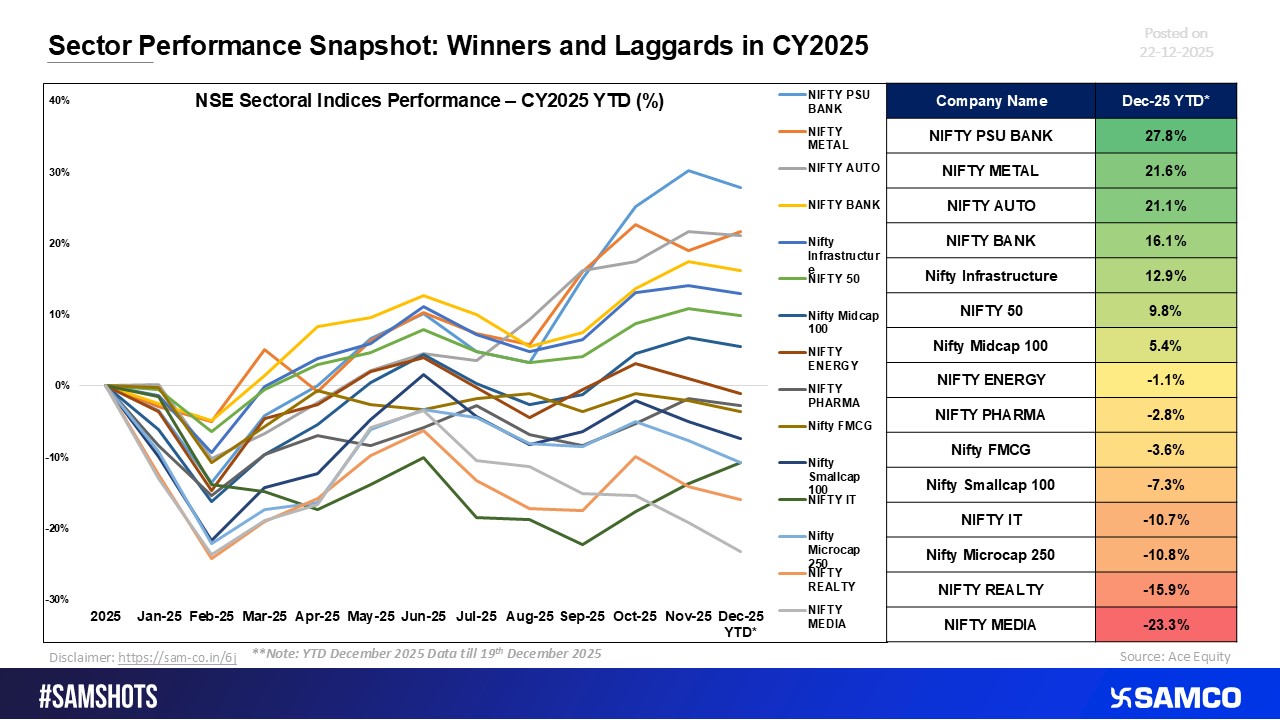
CY2025 Sector Scorecard: Outperformers vs. Underperformers
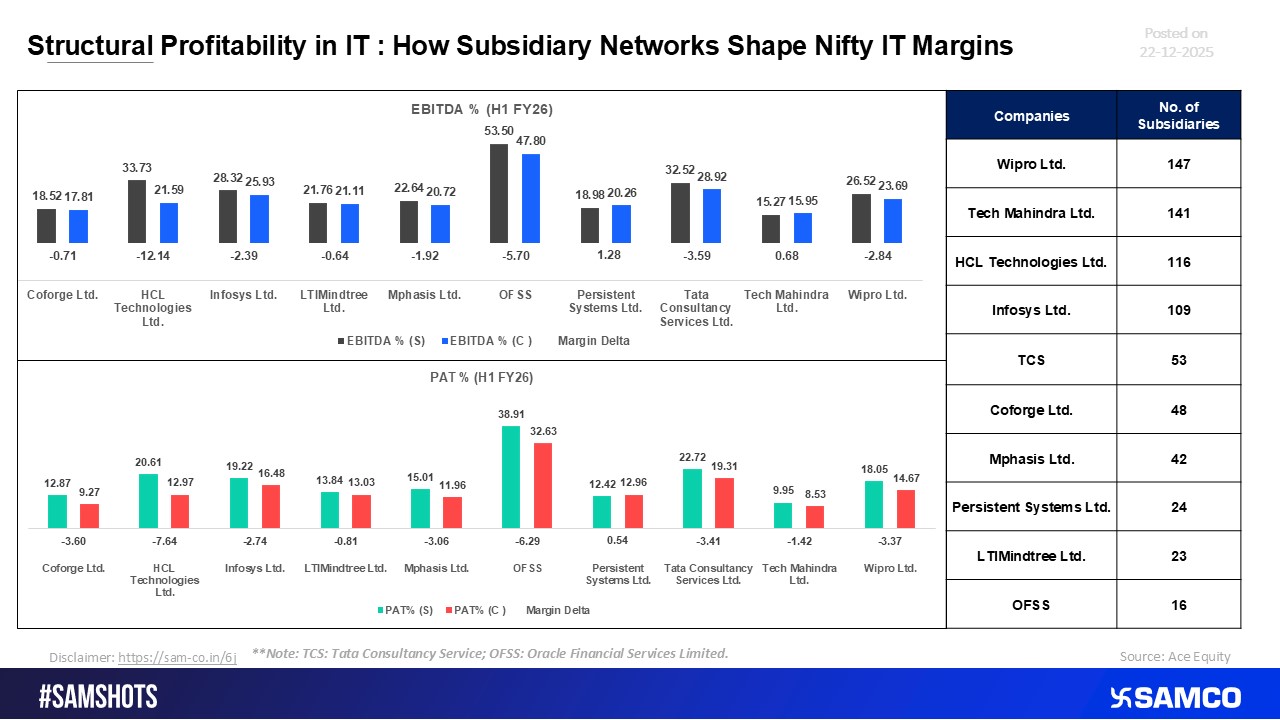
Subsidiaries & Margins: The Core of Nifty IT Profitability
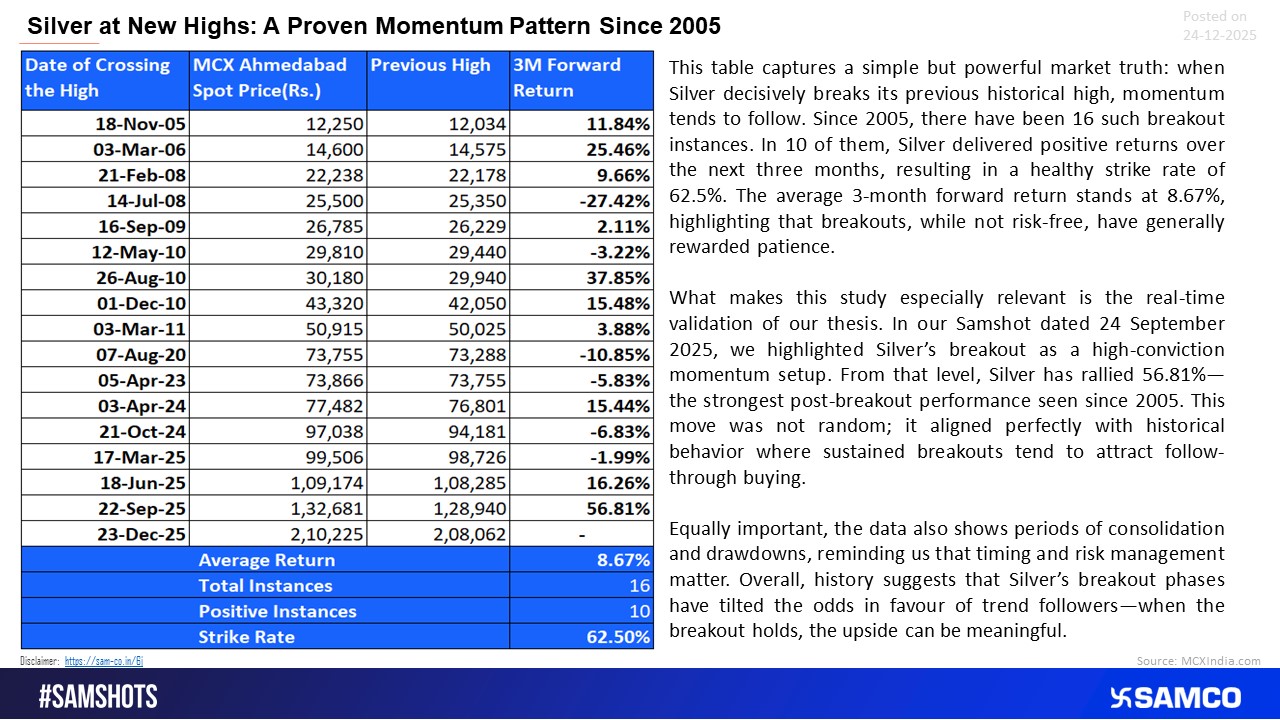
Silver’s new high isn’t a coincidence - history shows breakouts have repeatedly rewarded momentum traders.
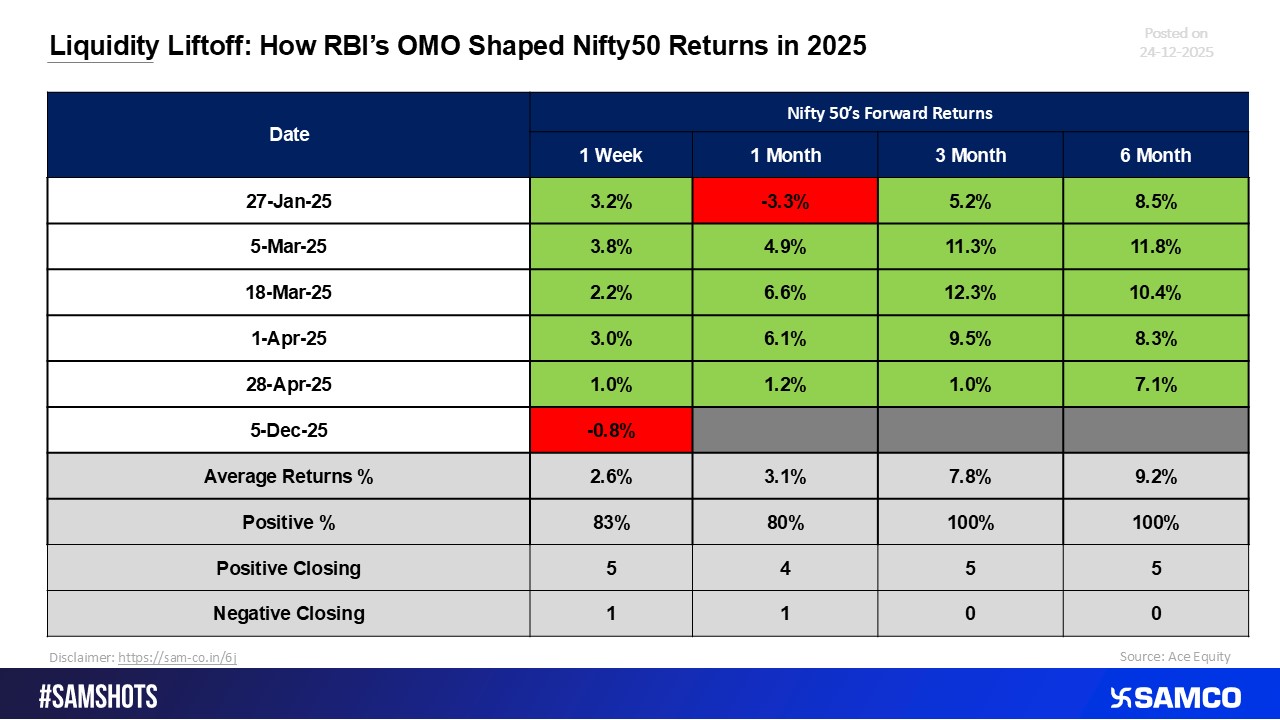
Liquidity & Returns: Assessing the Nifty50 Response to RBI’s OMO Actions in 2025
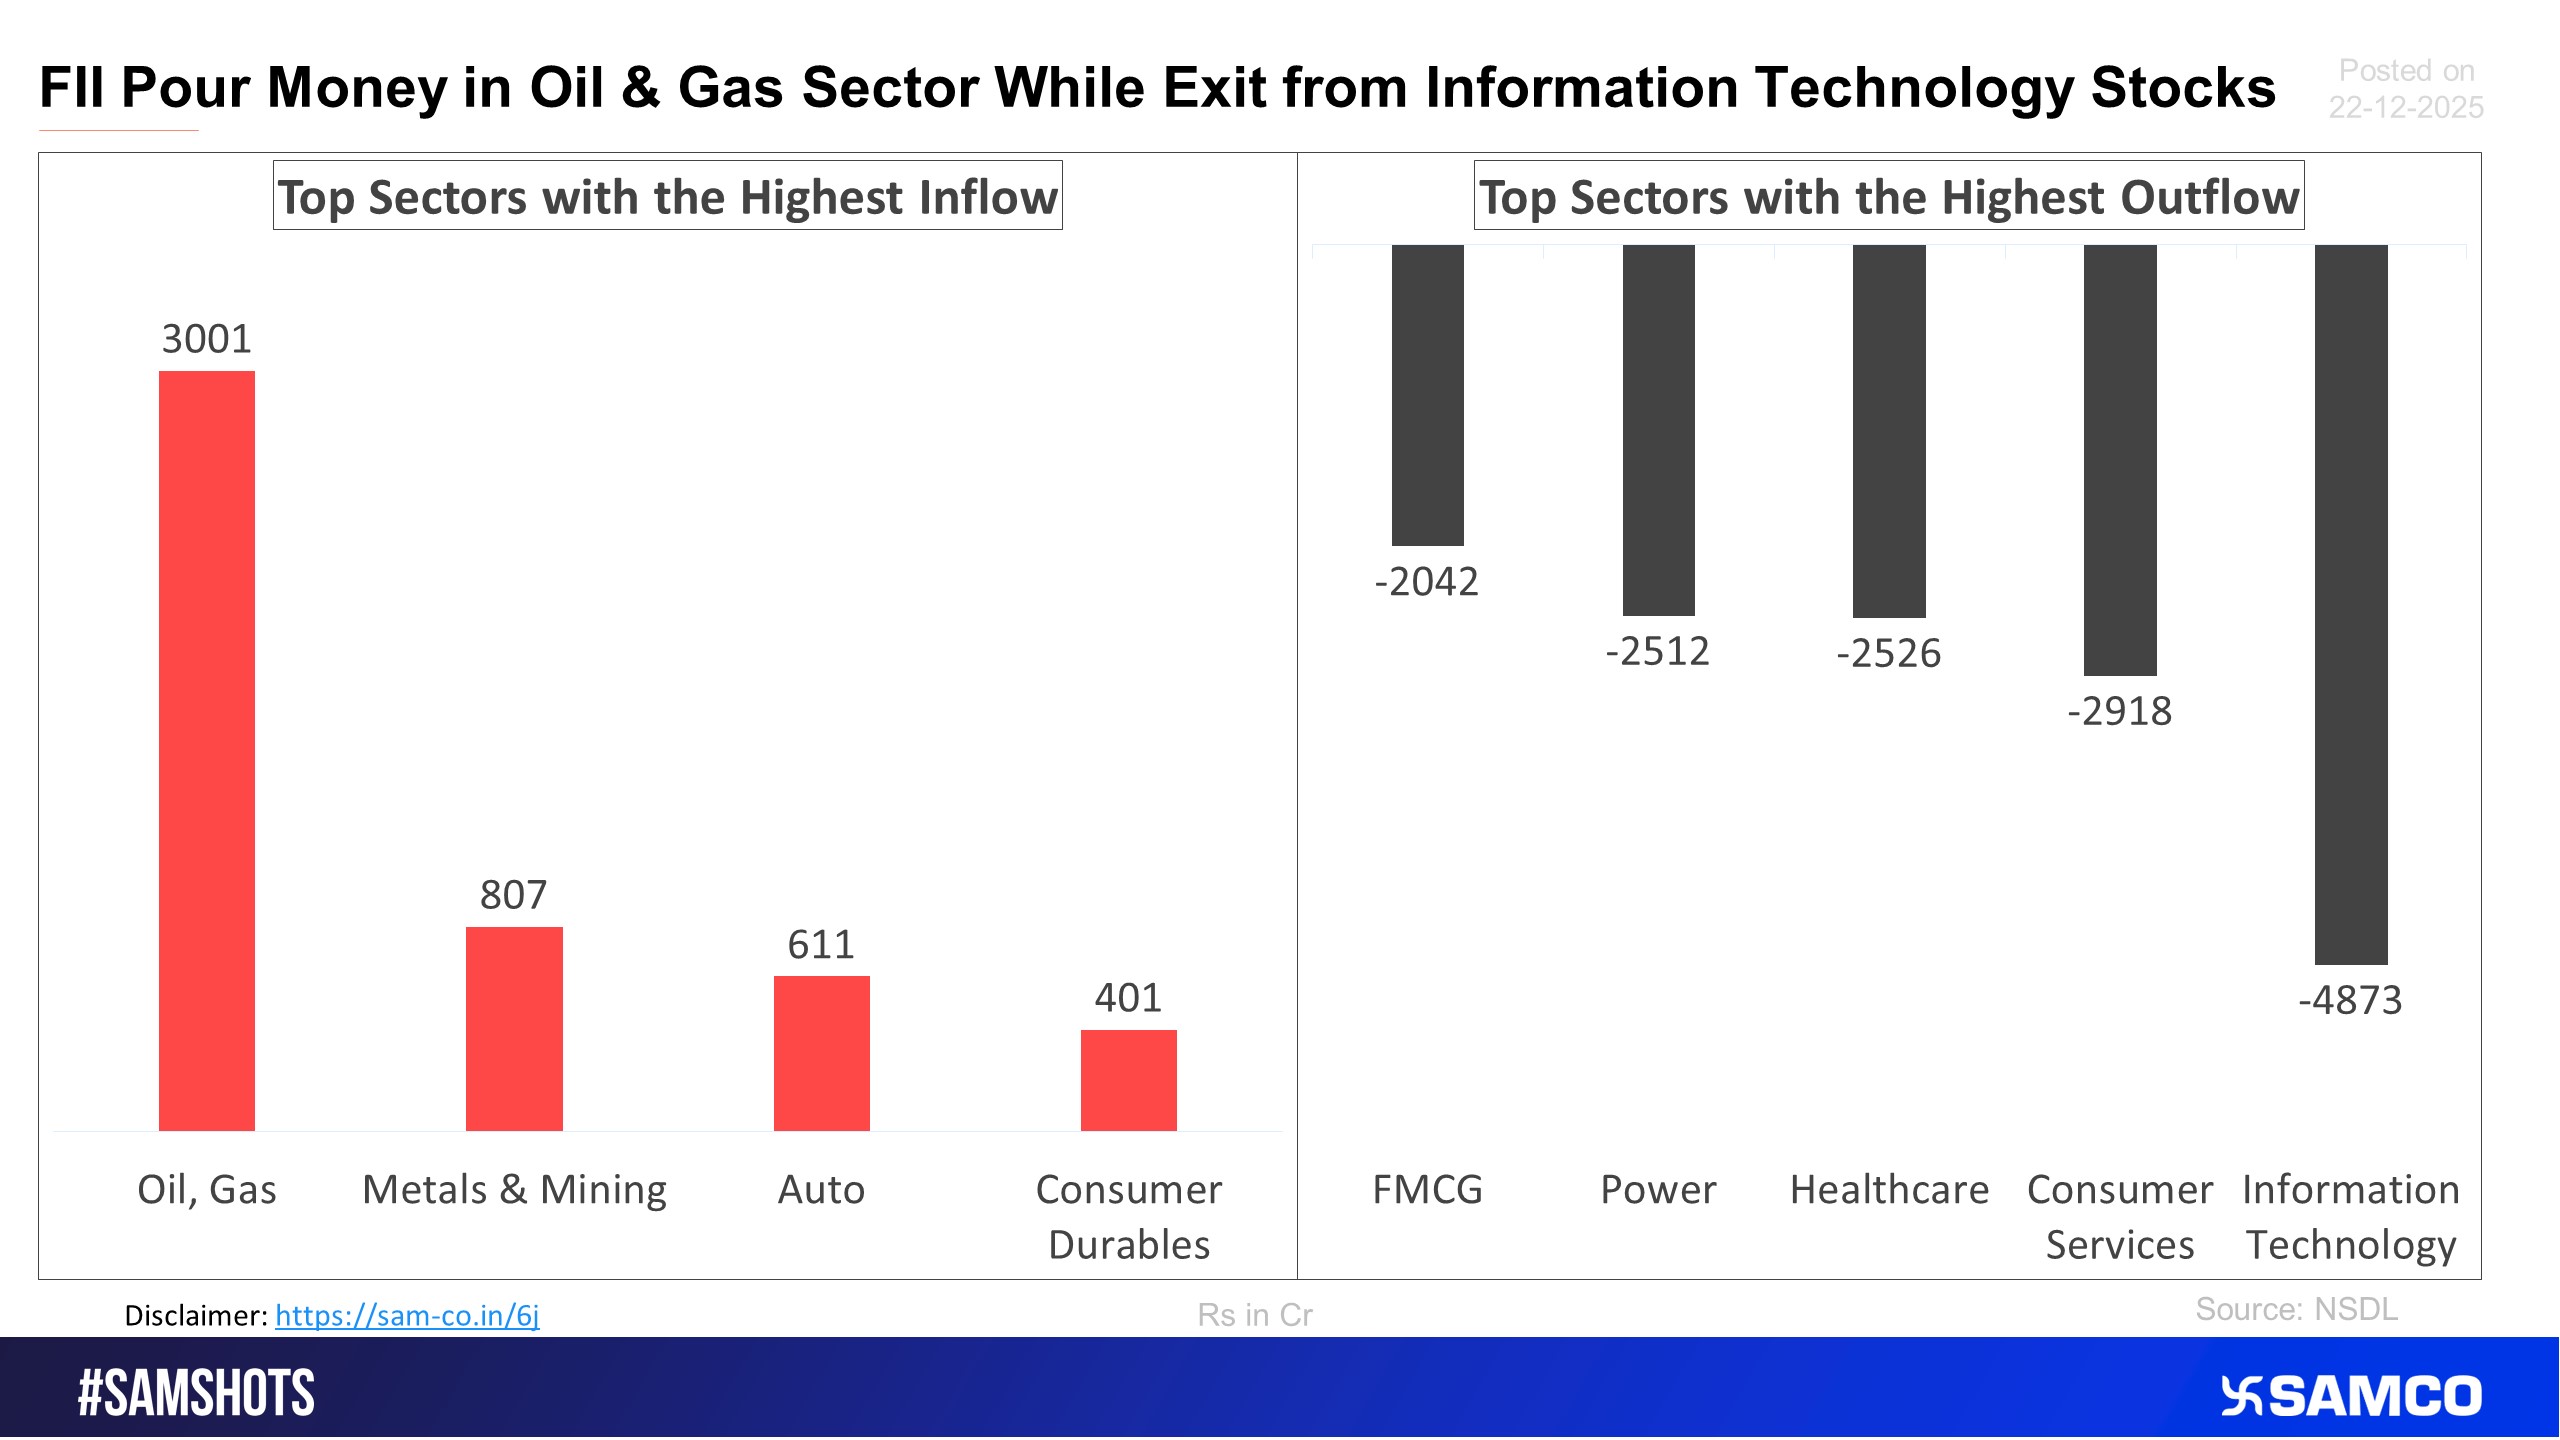
The accompanying chart shows the top sectors that witnessed FPI’s highest inflow and outflow in the latest quarter.
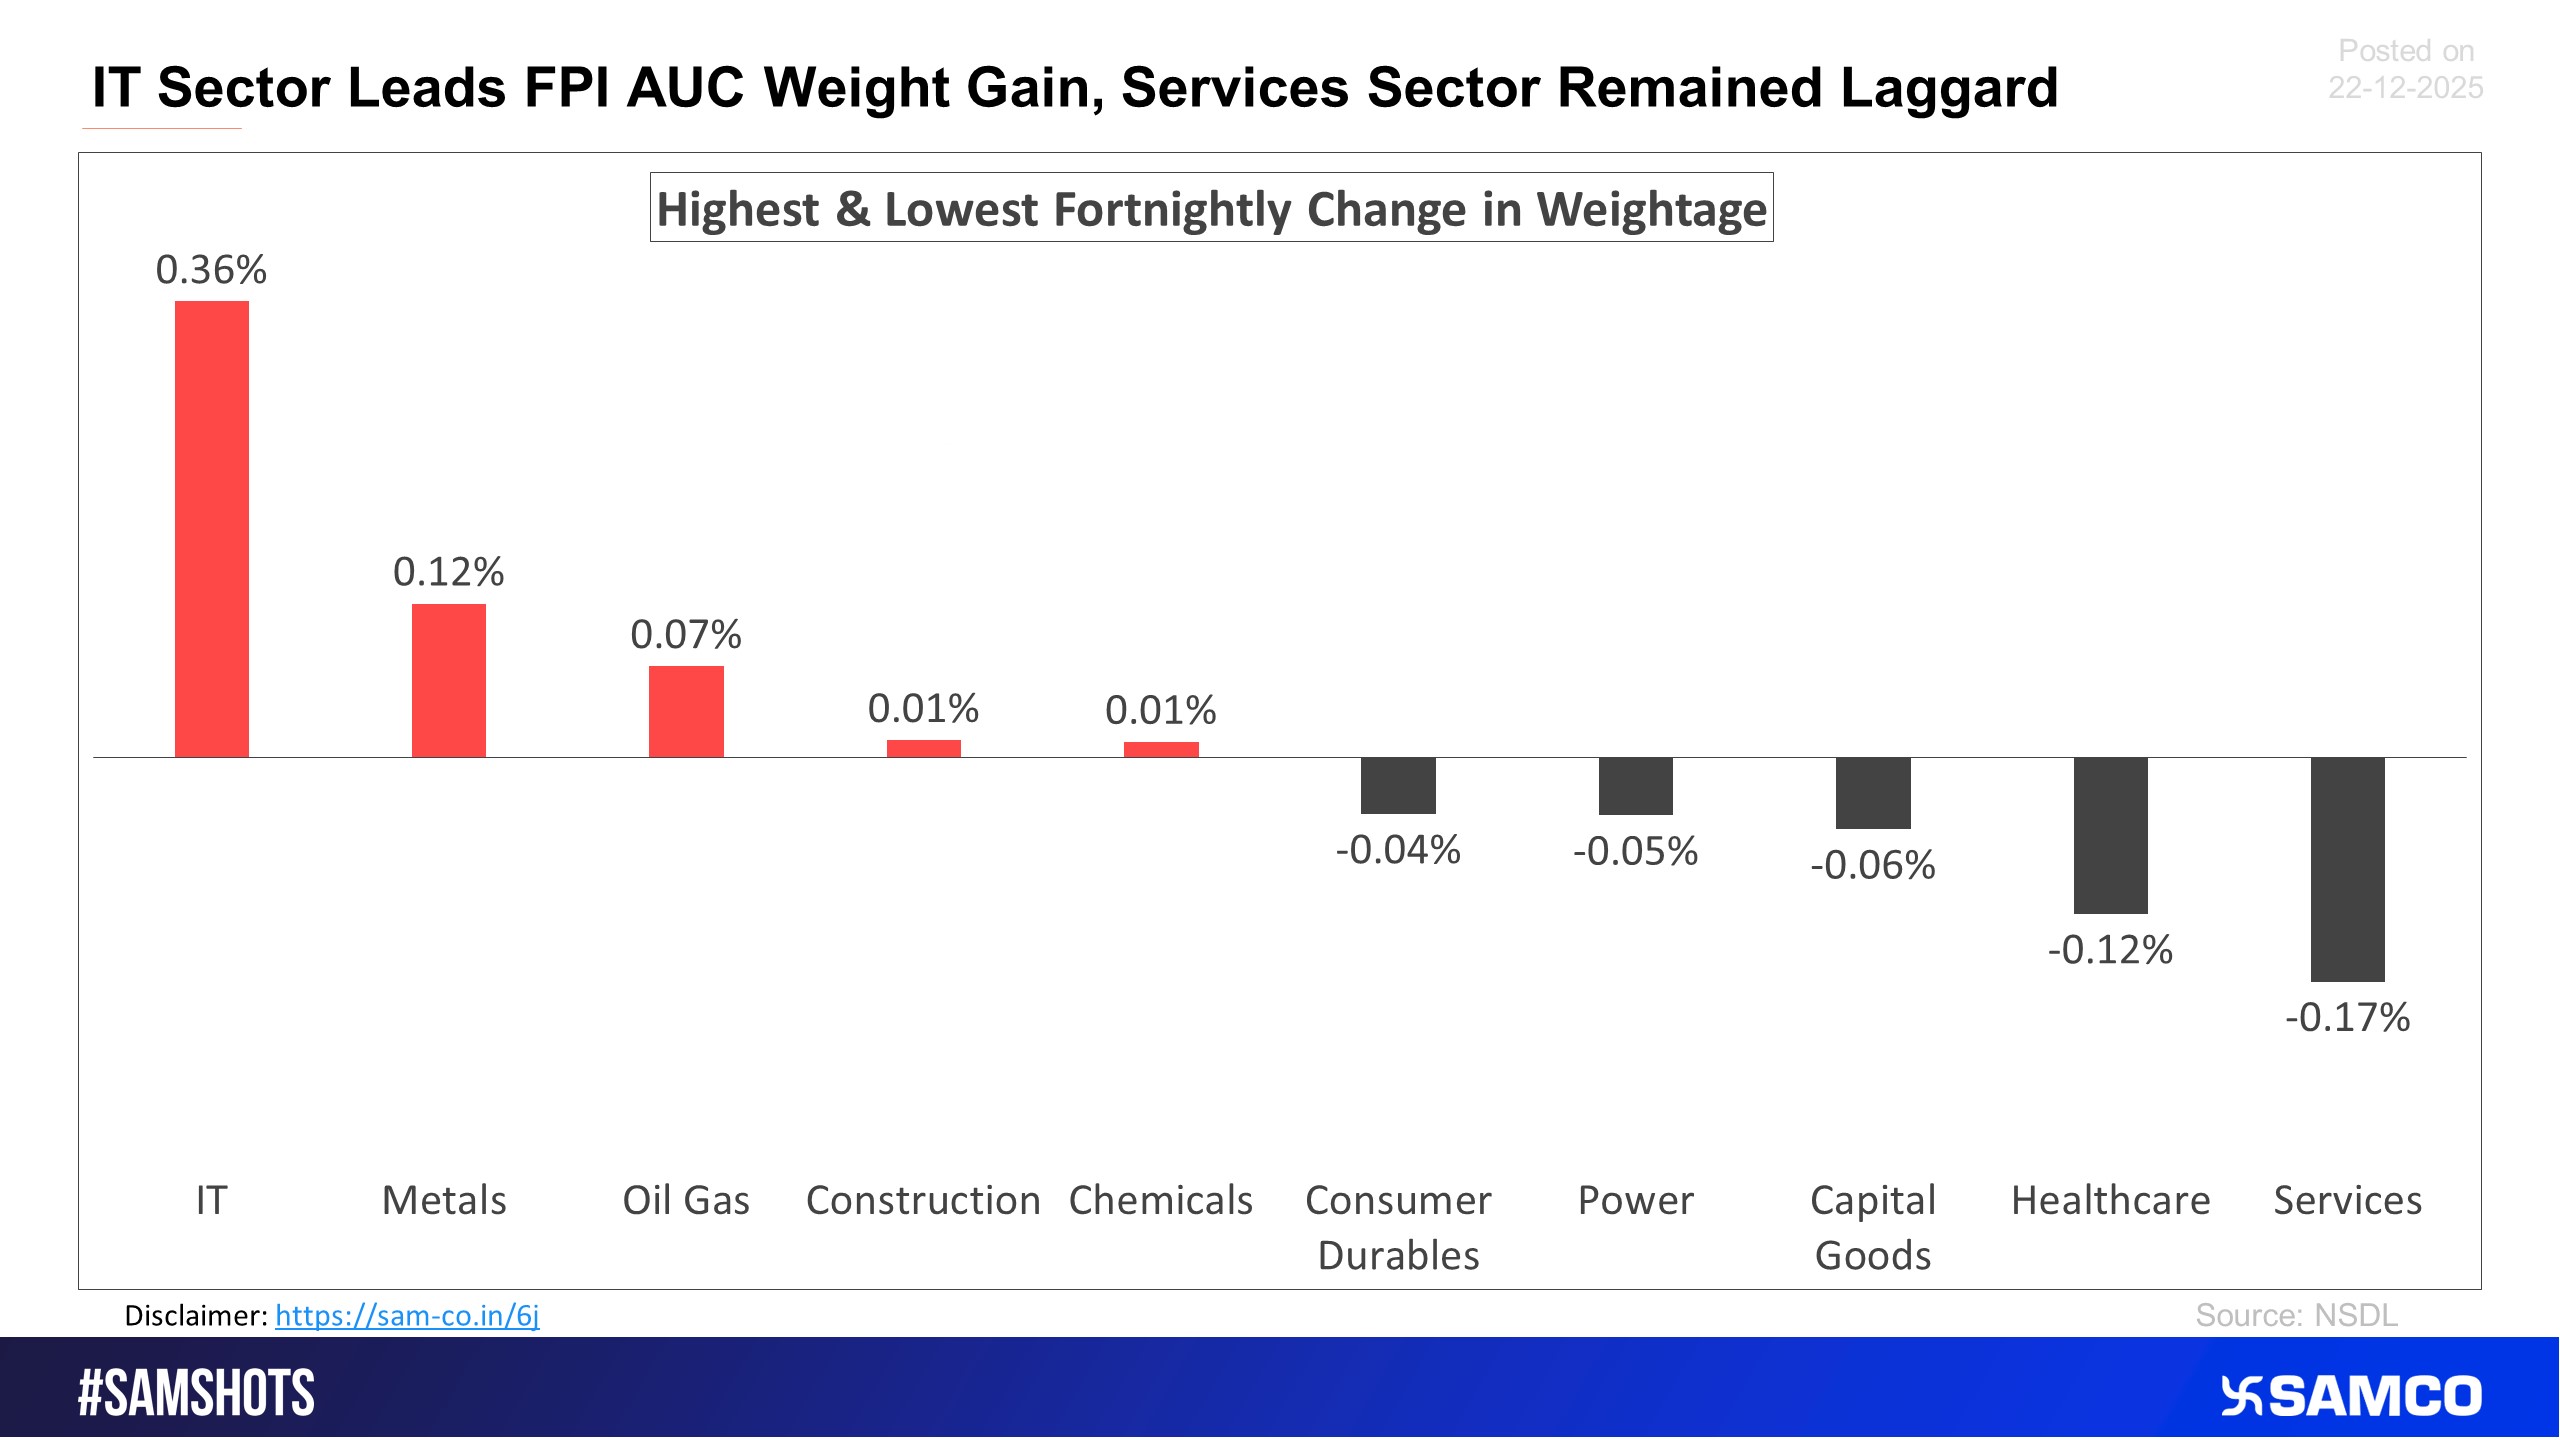
The chart below displays sectors that witnessed the highest and lowest change in the weightage of sectoral FPI holdings to the total FPI holdings compared to the previous fortnight.
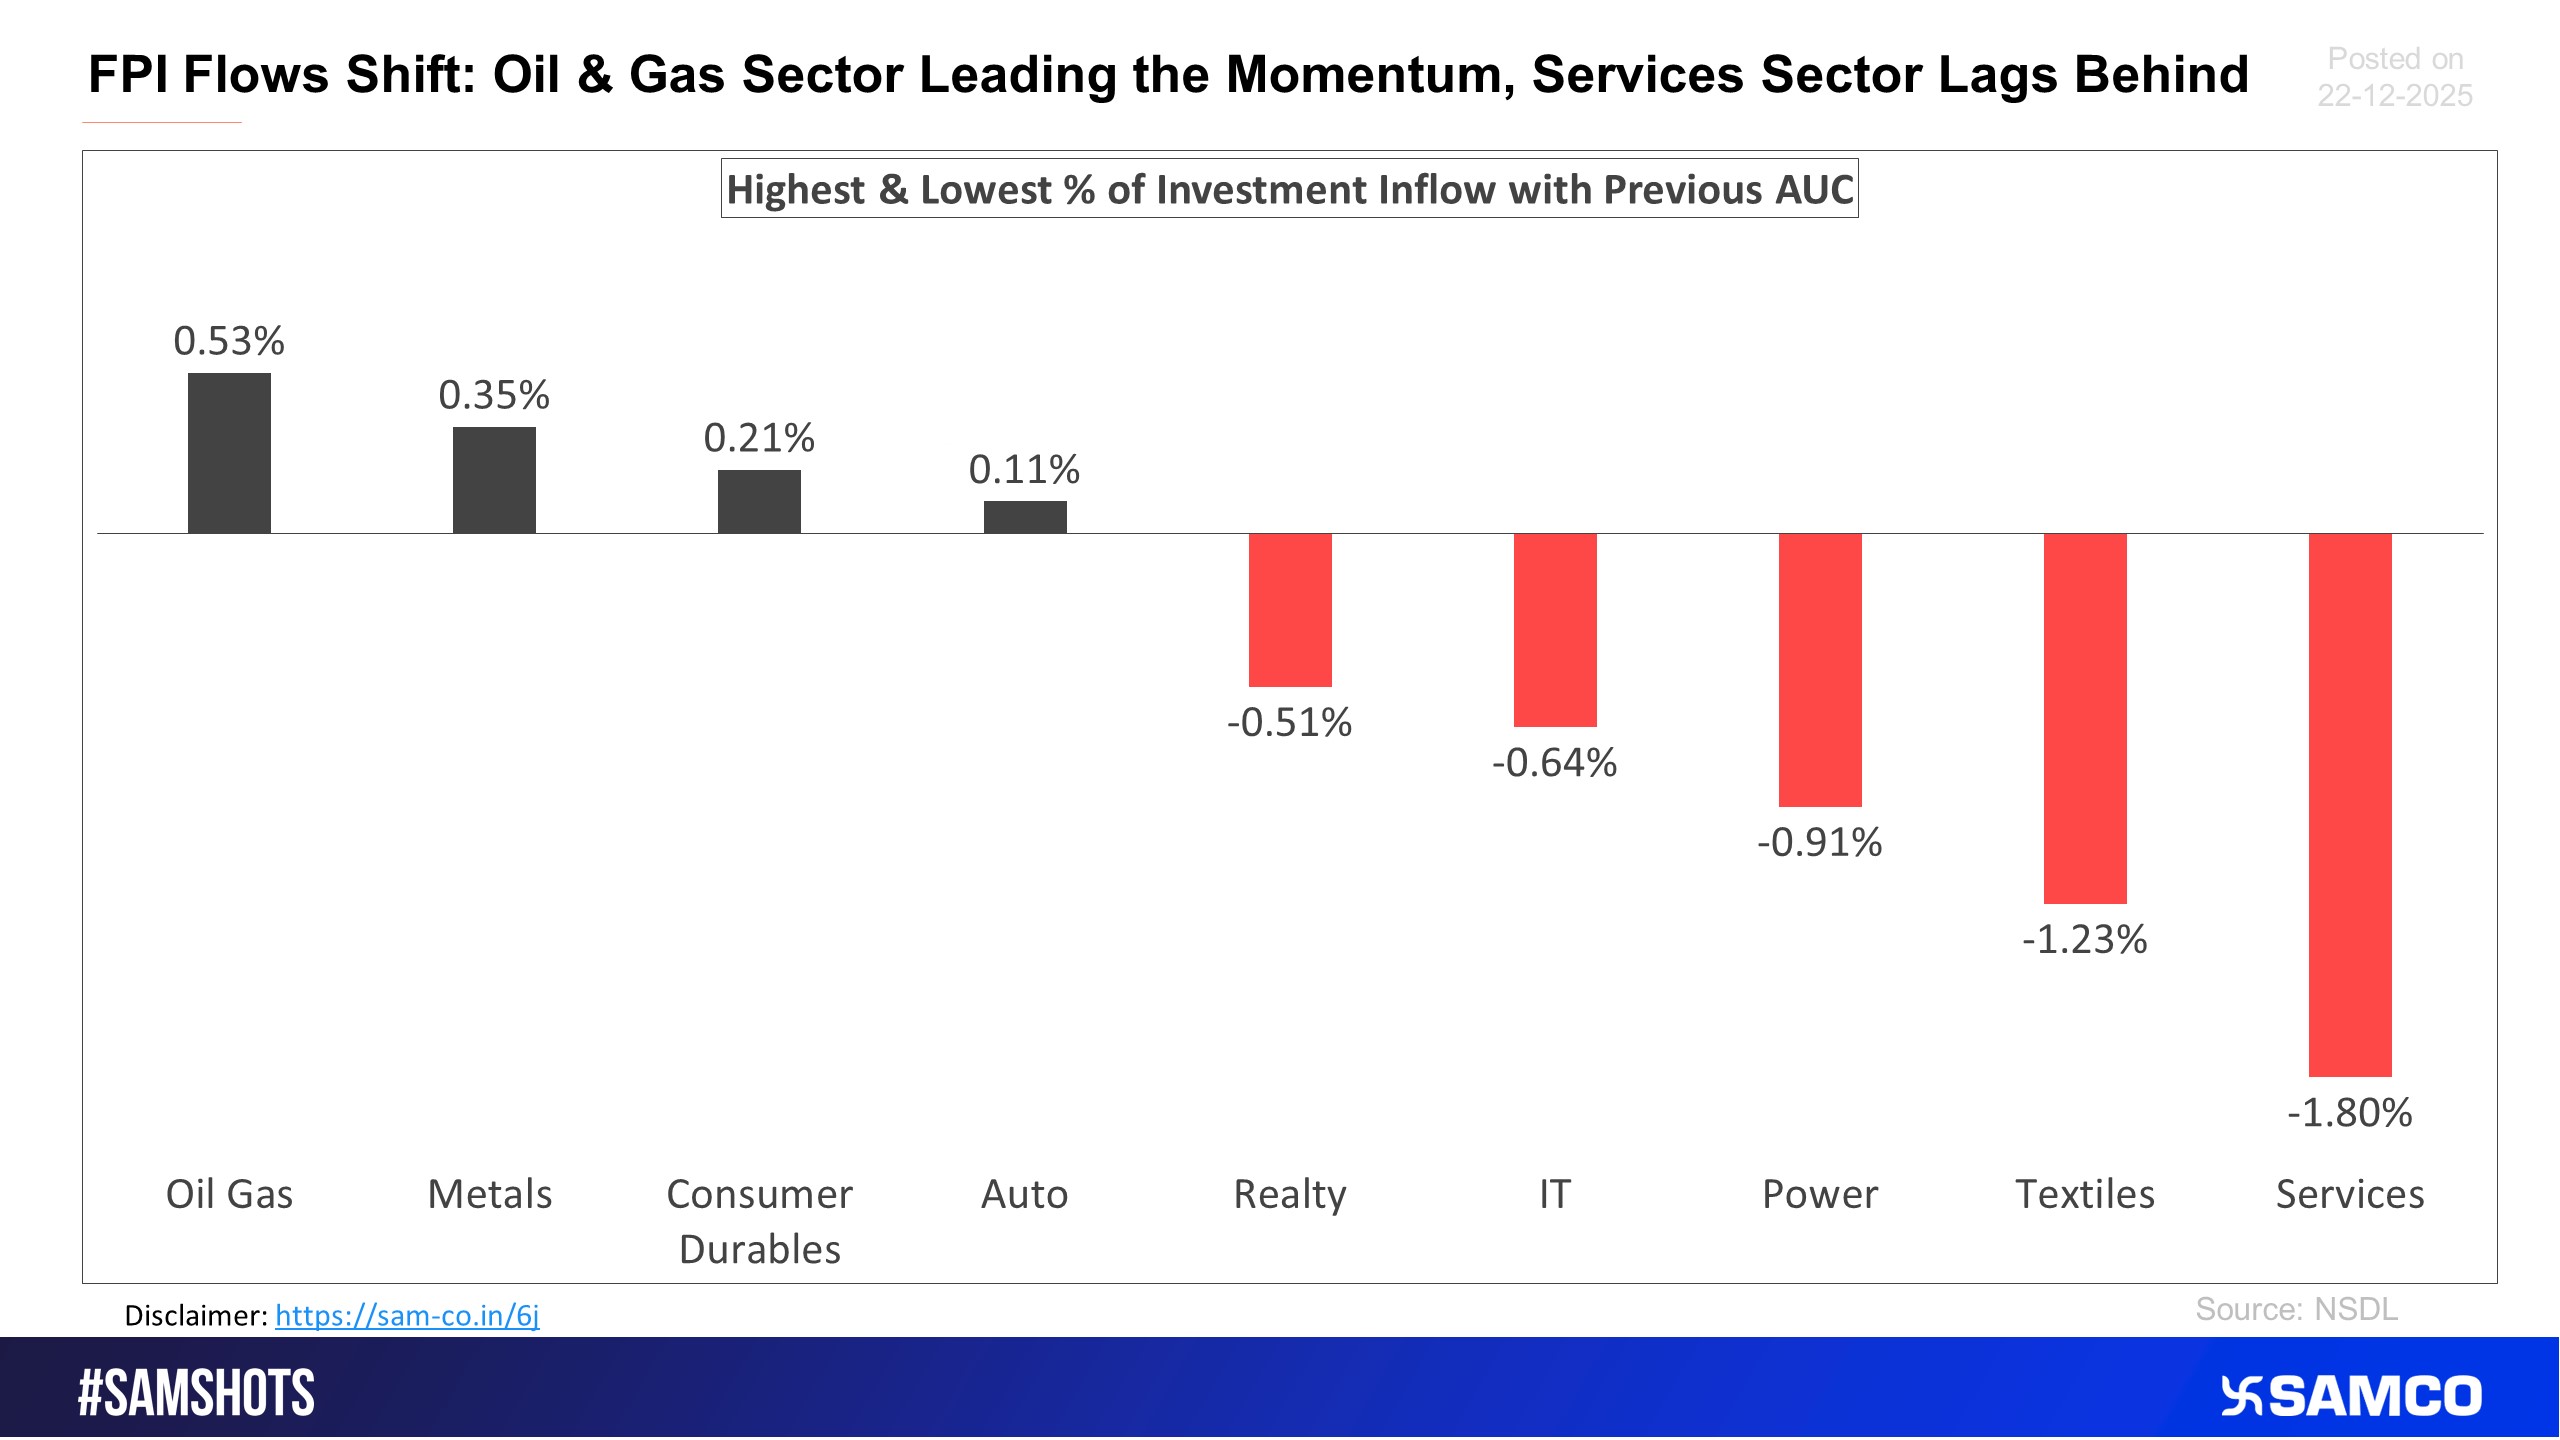
The below chart presents the highest & lowest percentage inflow of investment in the latest fortnight compared to the previous period AUC (Asset Under Custody) of FPI.
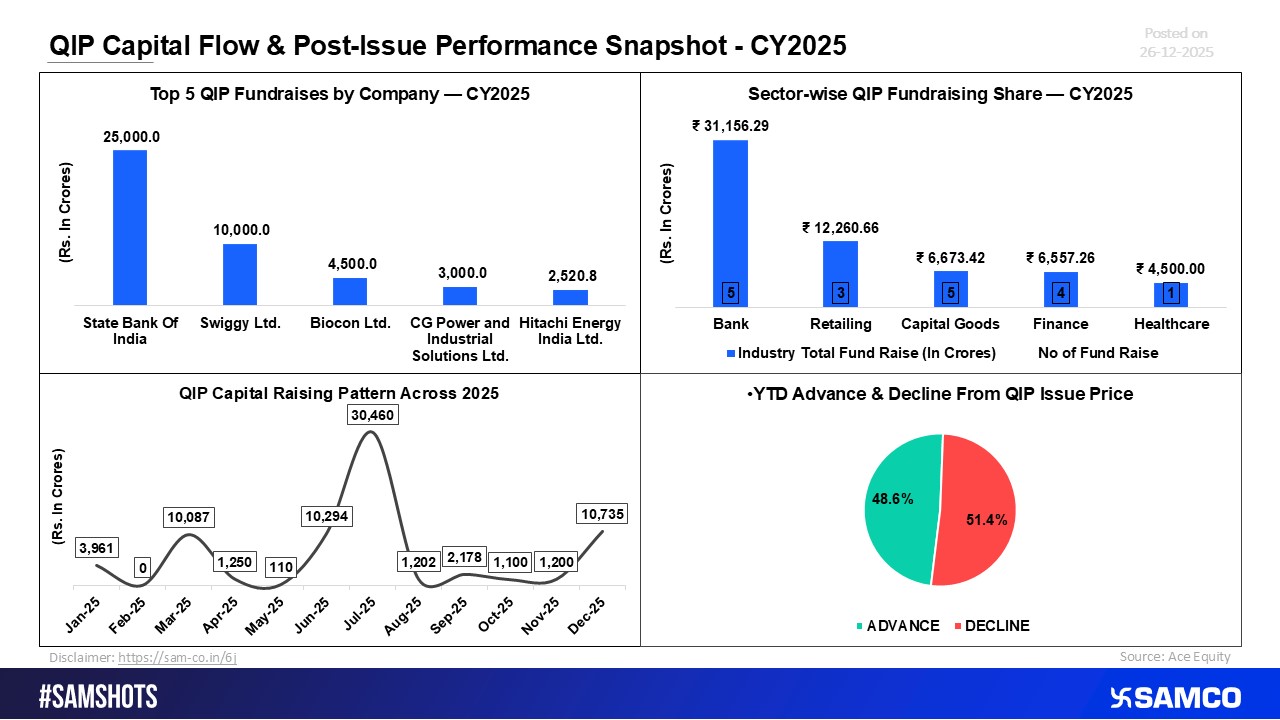
CY2025: QIP Flows and Performance at a Glance
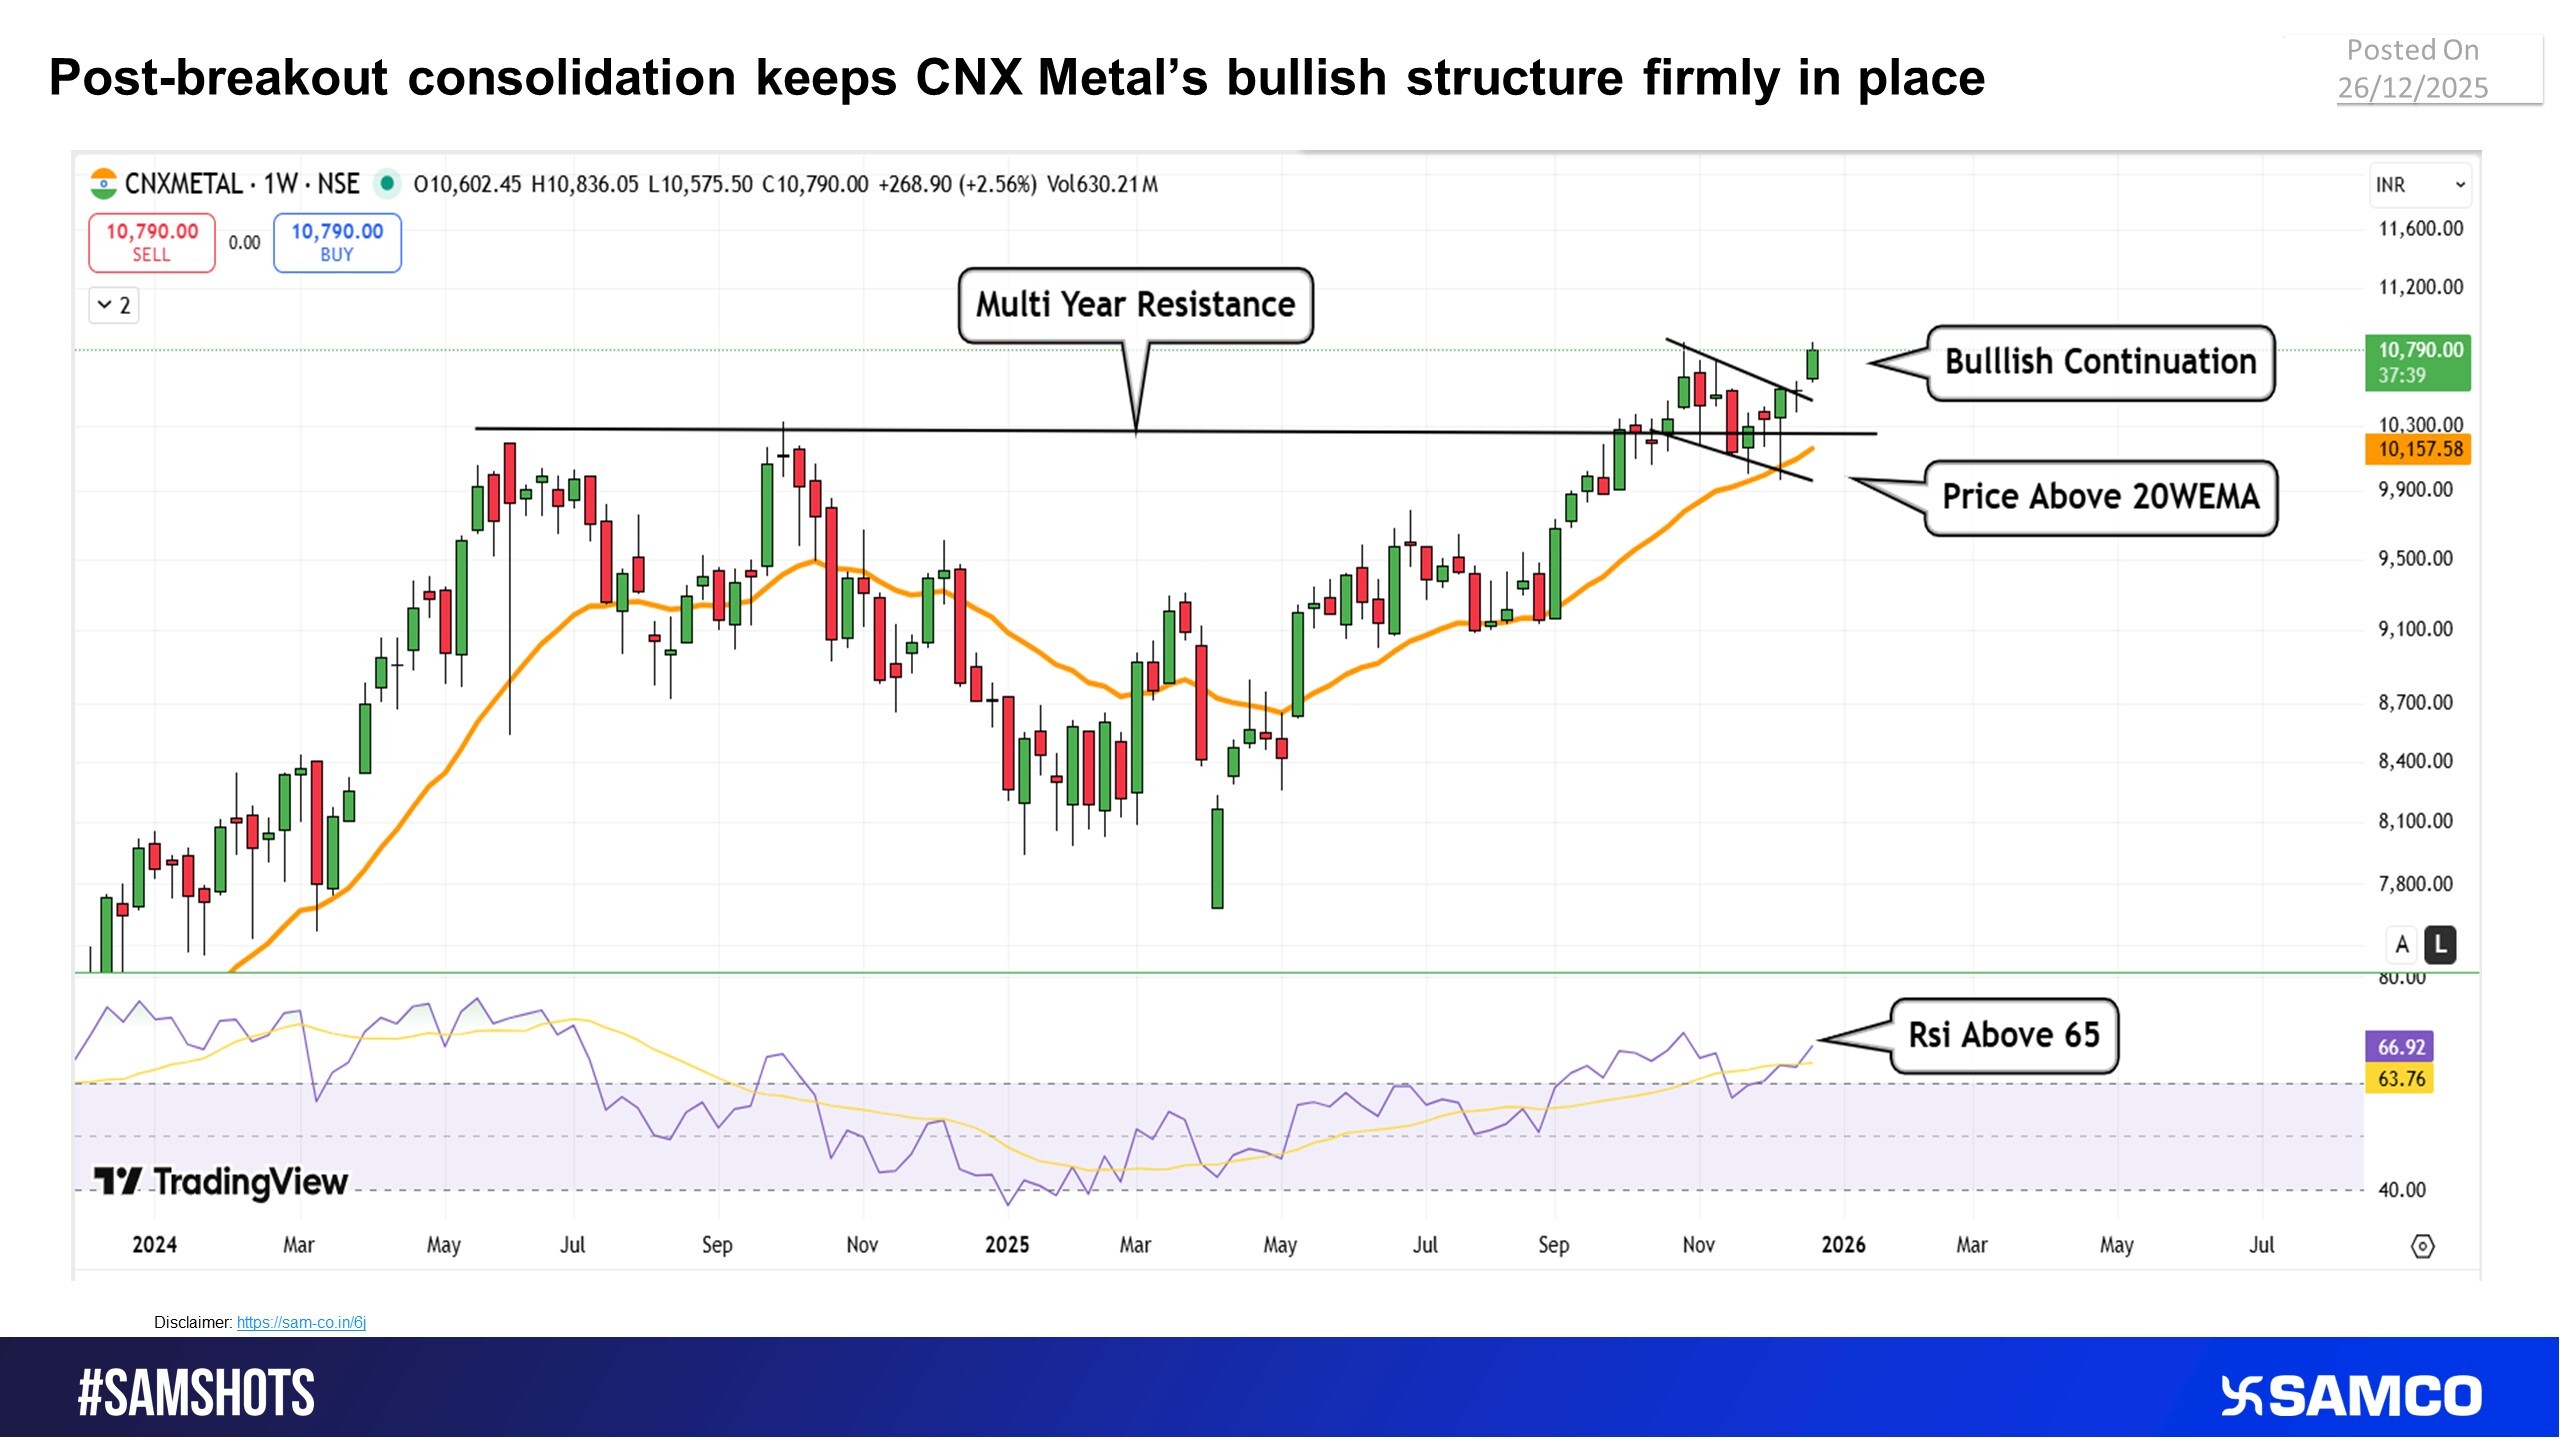
CNX Metal shows sustained strength, weekly setup favours upside continuation
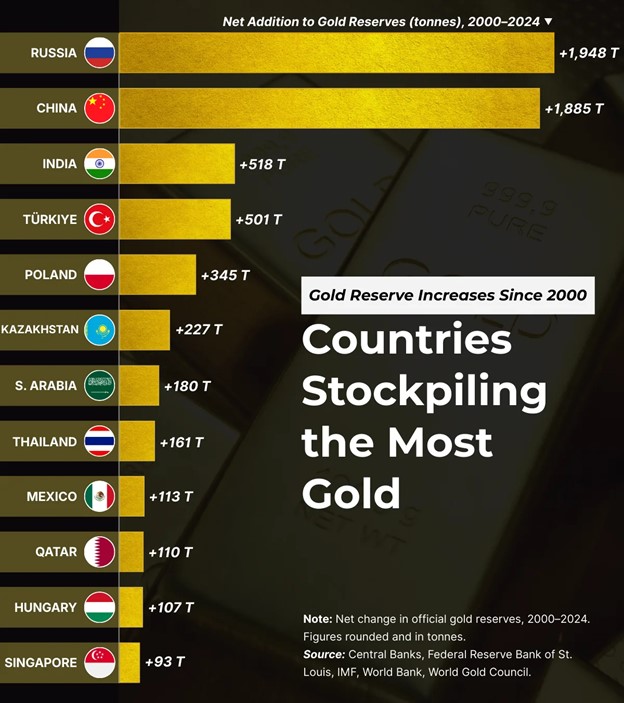
Source: Visualcapitalist.com


 Easy & quick
1. Register on SCORES portal
2. Mandatory details for filling complaints on SCORES
Name | PAN | Address | Mobile | Number | E-mail ID
3. Benefits
Effective Communication
Speedy redressal of the grievances