Nifty witnessed some profit booking at the start of this week. Yet, in a striking turn, a remarkable rally in the last two days propelled it to record highs. This surge was fueled by a dovish stance from the US Federal Reserve. The Fed Reserve Chair articulated a commitment to vigilantly monitor price and growth trends, assessing the necessity for any further rate hikes. The forward-looking perspective suggests a potential trajectory of declining interest rates in the year 2024.
The Nifty IT index has consistently demonstrated robust performance during the latter half of the year, showcasing superior results in 7 out of the past 10 years. Notably, the Nifty IT Index hit a 52-week high on Friday. This was attributed to strong US economic data, signaling the possibility of rate cuts, thereby opening up additional business opportunities for Indian IT companies. The rally was prominently led by the major players in the IT sector.
Nifty ended the week 2.32% higher at 21,457. Nifty IT and Nifty Metal surged the most during the week with a gain of 8.6% and 5% respectively.
Scroll down to understand more of such market news and perspectives for the week gone by in easily understandable charts.
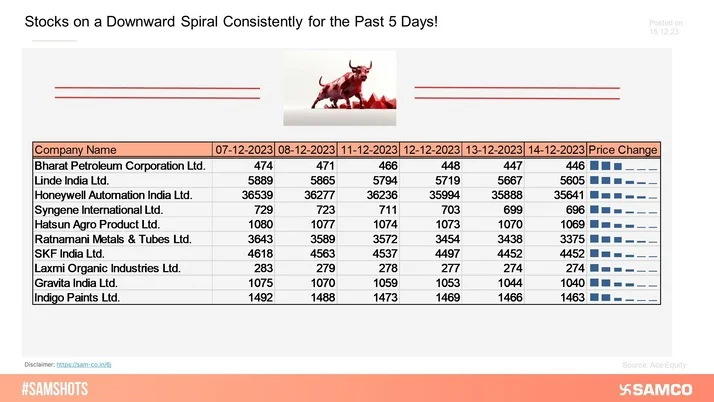
Attention Here! Watch Out For These Companies!


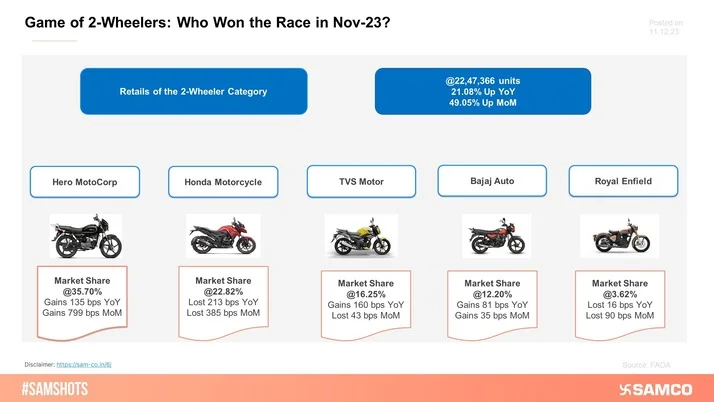
High Stakes in the 2-Wheeler Game!
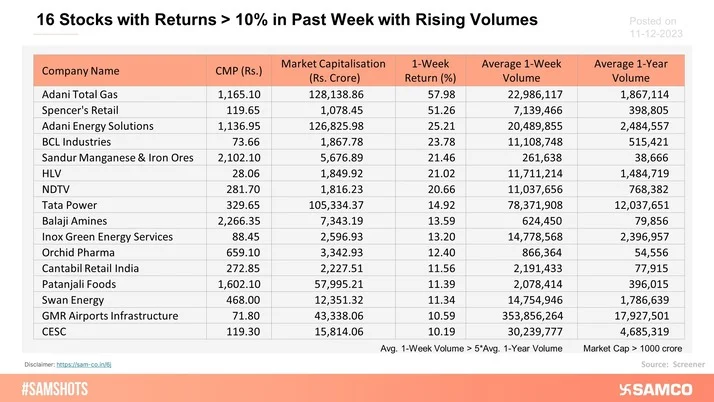
The table below shows a list of 16 stocks that returned investors more than 10% in a week with heavy volumes.
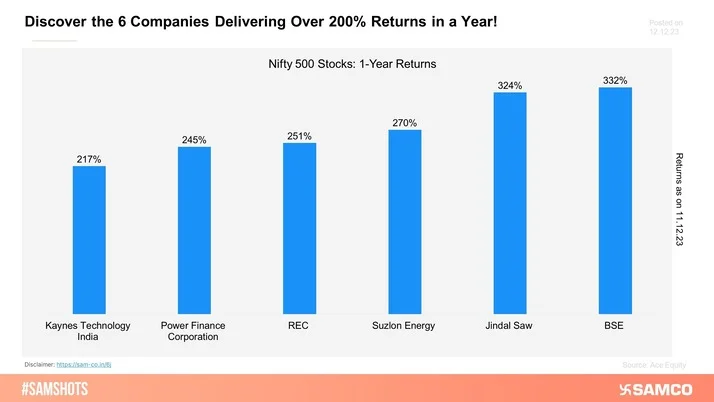
6 Companies With Mind-Blowing 200%+ Returns in 1 Year!
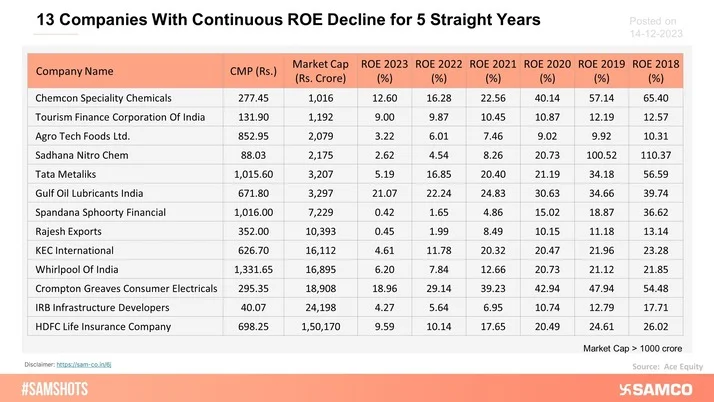
The below table covers a list of companies that have eroded the ROE of Shareholders for half a decade straight.
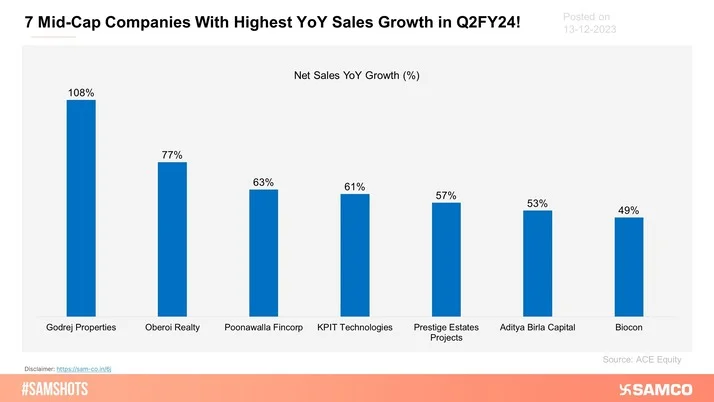
Here are the 7 Mid-Cap companies with the highest YoY Sales Growth in Q2FY24!
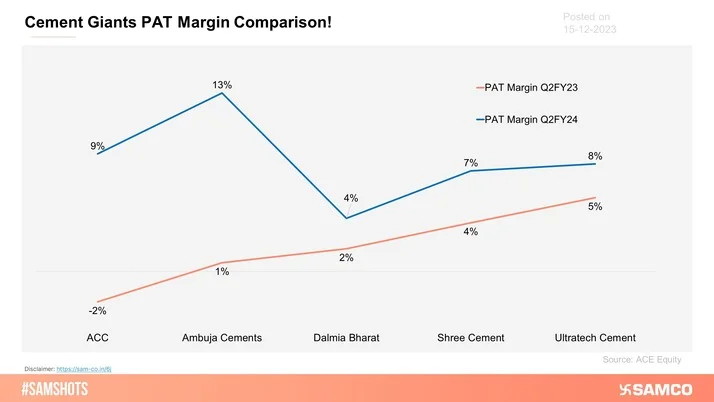
The below chart displays a comparative analysis of cement giants’ PAT margins for Q2FY23 and Q2FY24.
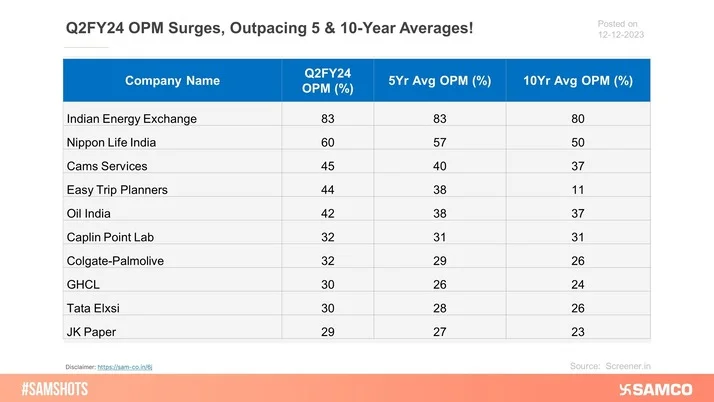
The table presents the Operating profit margins in Q2FY24 in comparison with 5 year and 10-year average operating profit margins.
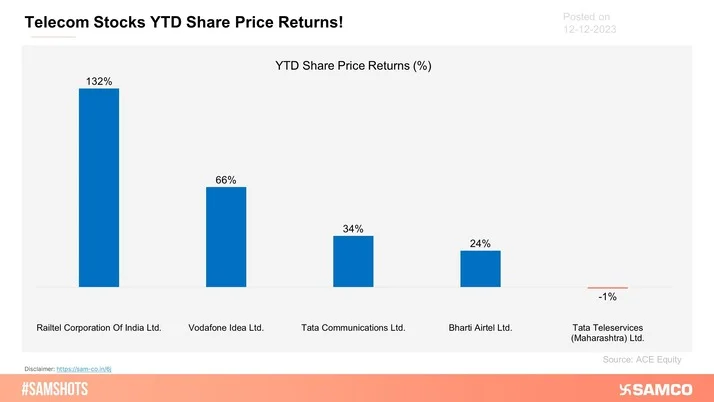
The below chart displays the YTD share price returns of key telecom stocks.
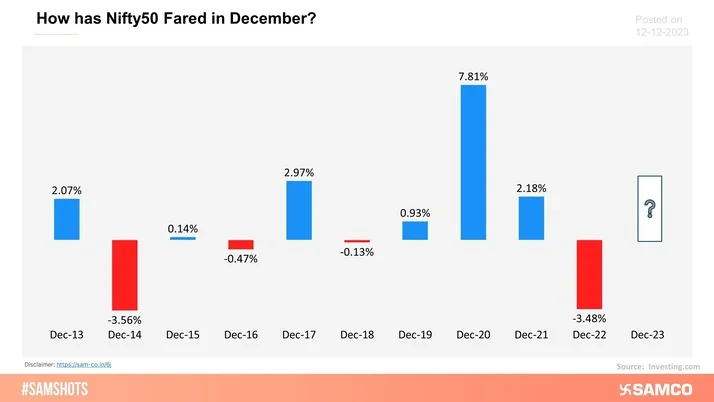
The chart below shows the returns of Nifty50 in the month of December for the past 10 years. On an average, the index has returned 0.85% with 2020 being the best year.
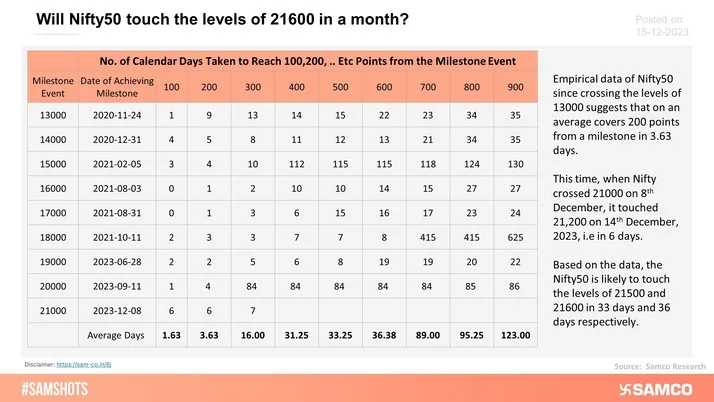
The table below shows the No. of days taken by Nifty50 to achieve 100,200,.. etc points from achieving a milestone.
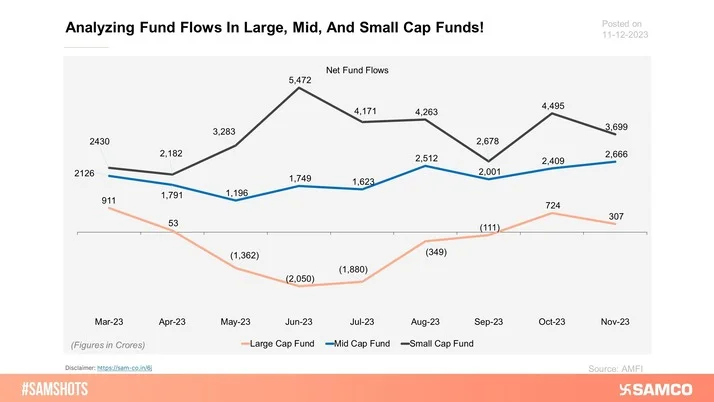
Here’s how net inflows happened in large, mid and small-cap funds:
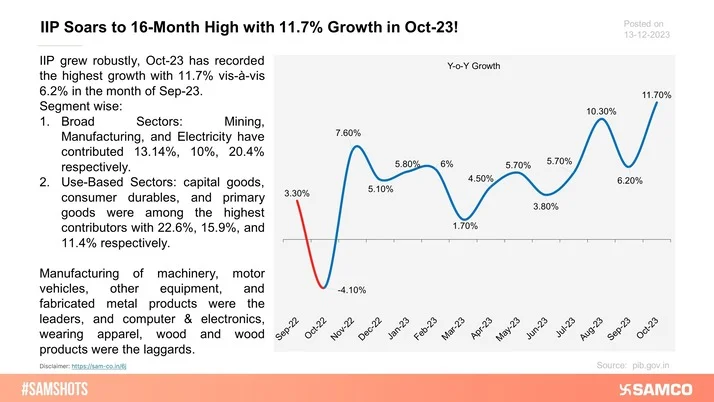
Index of Industrial Production for the month of Oct-23.
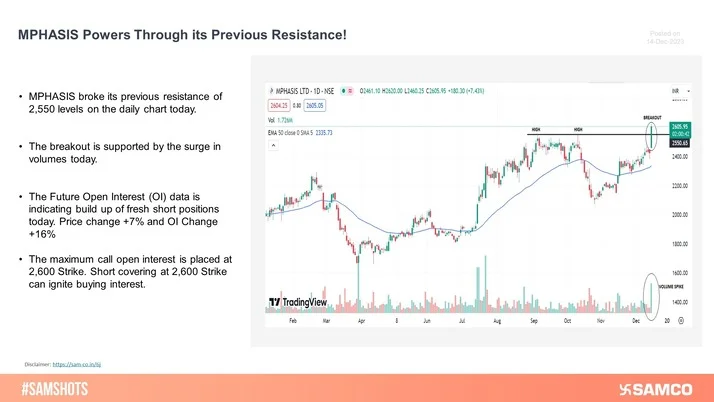
MPHASIS has broken its previous resistance level of 2,550 level on the daily chart with rising volumes.
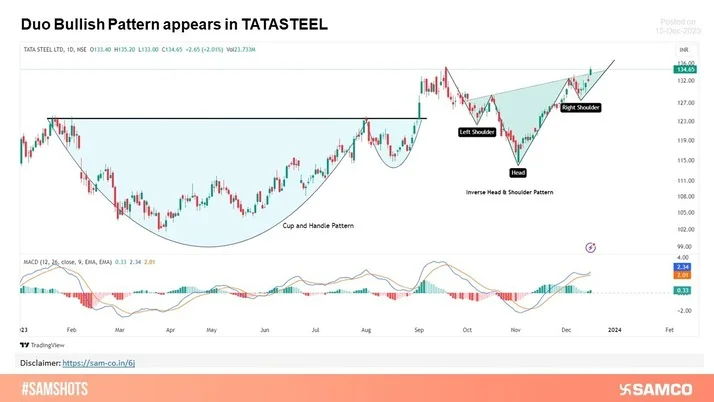
Tata Steel depicts bullish patterns i.e. cup with handle and inverse head & shoulder. MACD indicators confirm a bullish signal.
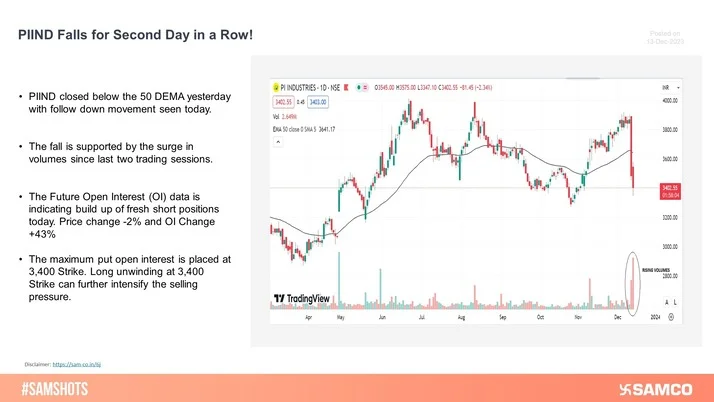
PIIND came under massive selling pressure this week. Long unwinding at 3,400 is likely to intensify the selling pressure.
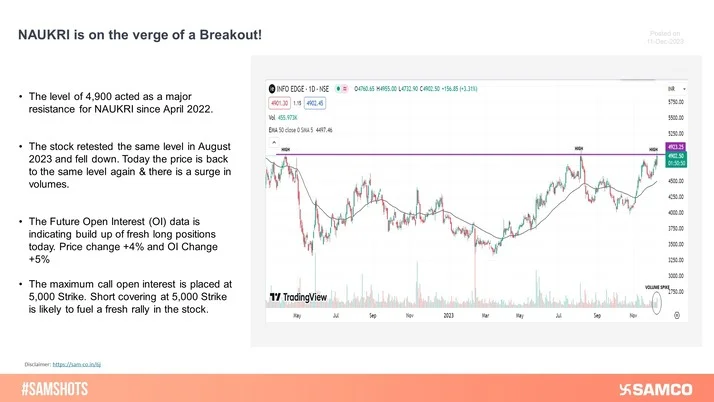
NAUKRI gave a breakout from its key resistance level of 4,900 on the daily chart.
Bata India has given a breakout of a falling trendline. The stock has taken support from 61.8 of Fibonacci retrenchment. RSI remains at 56 levels with a bullish diversion.
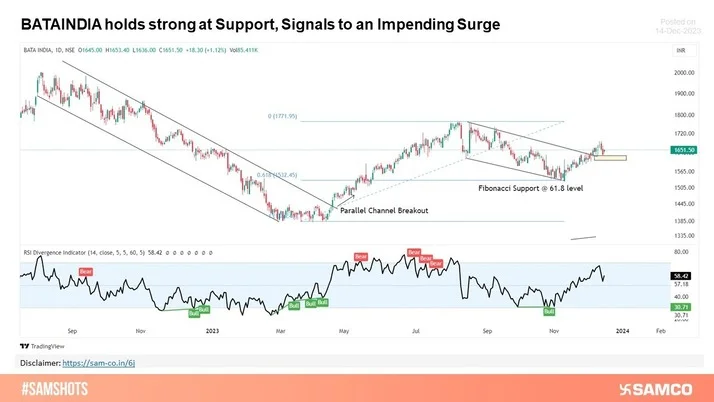
Image Source: @StatistaCharts


 Easy & quick
1. Register on SCORES portal
2. Mandatory details for filling complaints on SCORES
Name | PAN | Address | Mobile | Number | E-mail ID
3. Benefits
Effective Communication
Speedy redressal of the grievances