Indian equities swung between optimism and caution this week as the Sensex and Nifty hit fresh 52-week highs mid-week before slipping into a 0.5-0.6% decline on Friday amid profit-booking. Broader markets also softened, with midcap and smallcap indices closing lower. Global cues remained mixed after the US Fed’s meeting minutes and stronger-than-expected US jobs data reduced expectations of near-term rate cuts. This, combined with weakening risk sentiment, pushed the Indian Rupee to a record low, breaching the ?89 per USD mark. On the corporate front, Infosys opened its ?18,000-crore buyback, while TCS announced a joint venture with TPG Terabyte Bidco focused on building AI-driven data-centre infrastructure-moves that kept large-cap IT in focus despite broader market consolidation.
Precious metals witnessed mild corrective pressure following the strength in US economic data. Gold (USD/oz) hovered near $4,035-4,040, while Silver (USD/oz) eased to around $48-49, as seen in the weekly charts you shared. Both metals have paused after sharp multi-month rallies, reflecting cooling safe-haven demand and a firmer dollar. Sector trends in Indian equities mirrored this cautious tone, with IT and Auto leading weekly gains, while Realty and Metals were the notable laggards. Overall, markets entered a short consolidation phase driven by global macro signals, currency volatility, and selective stock-specific triggers.
Scroll down to understand more of such market news and perspectives for the week gone by in easily understandable charts.
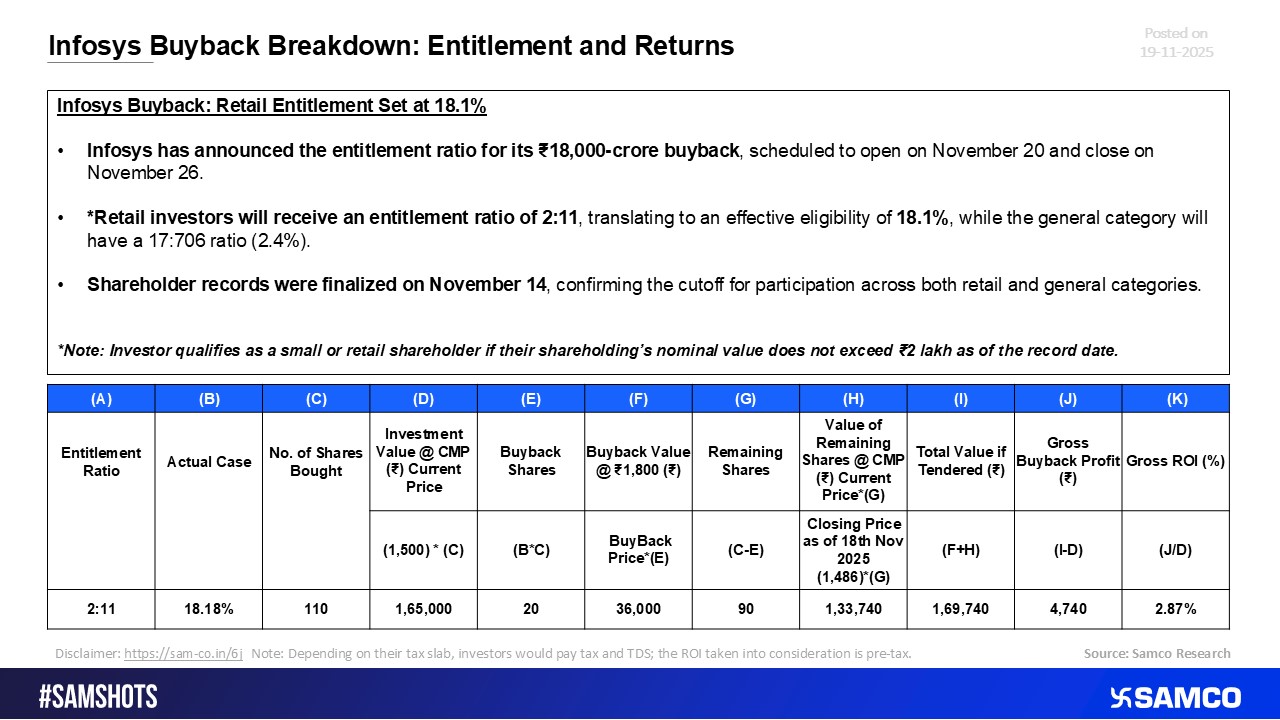
Investor Gains & Entitlement Details from the Infosys Buyback


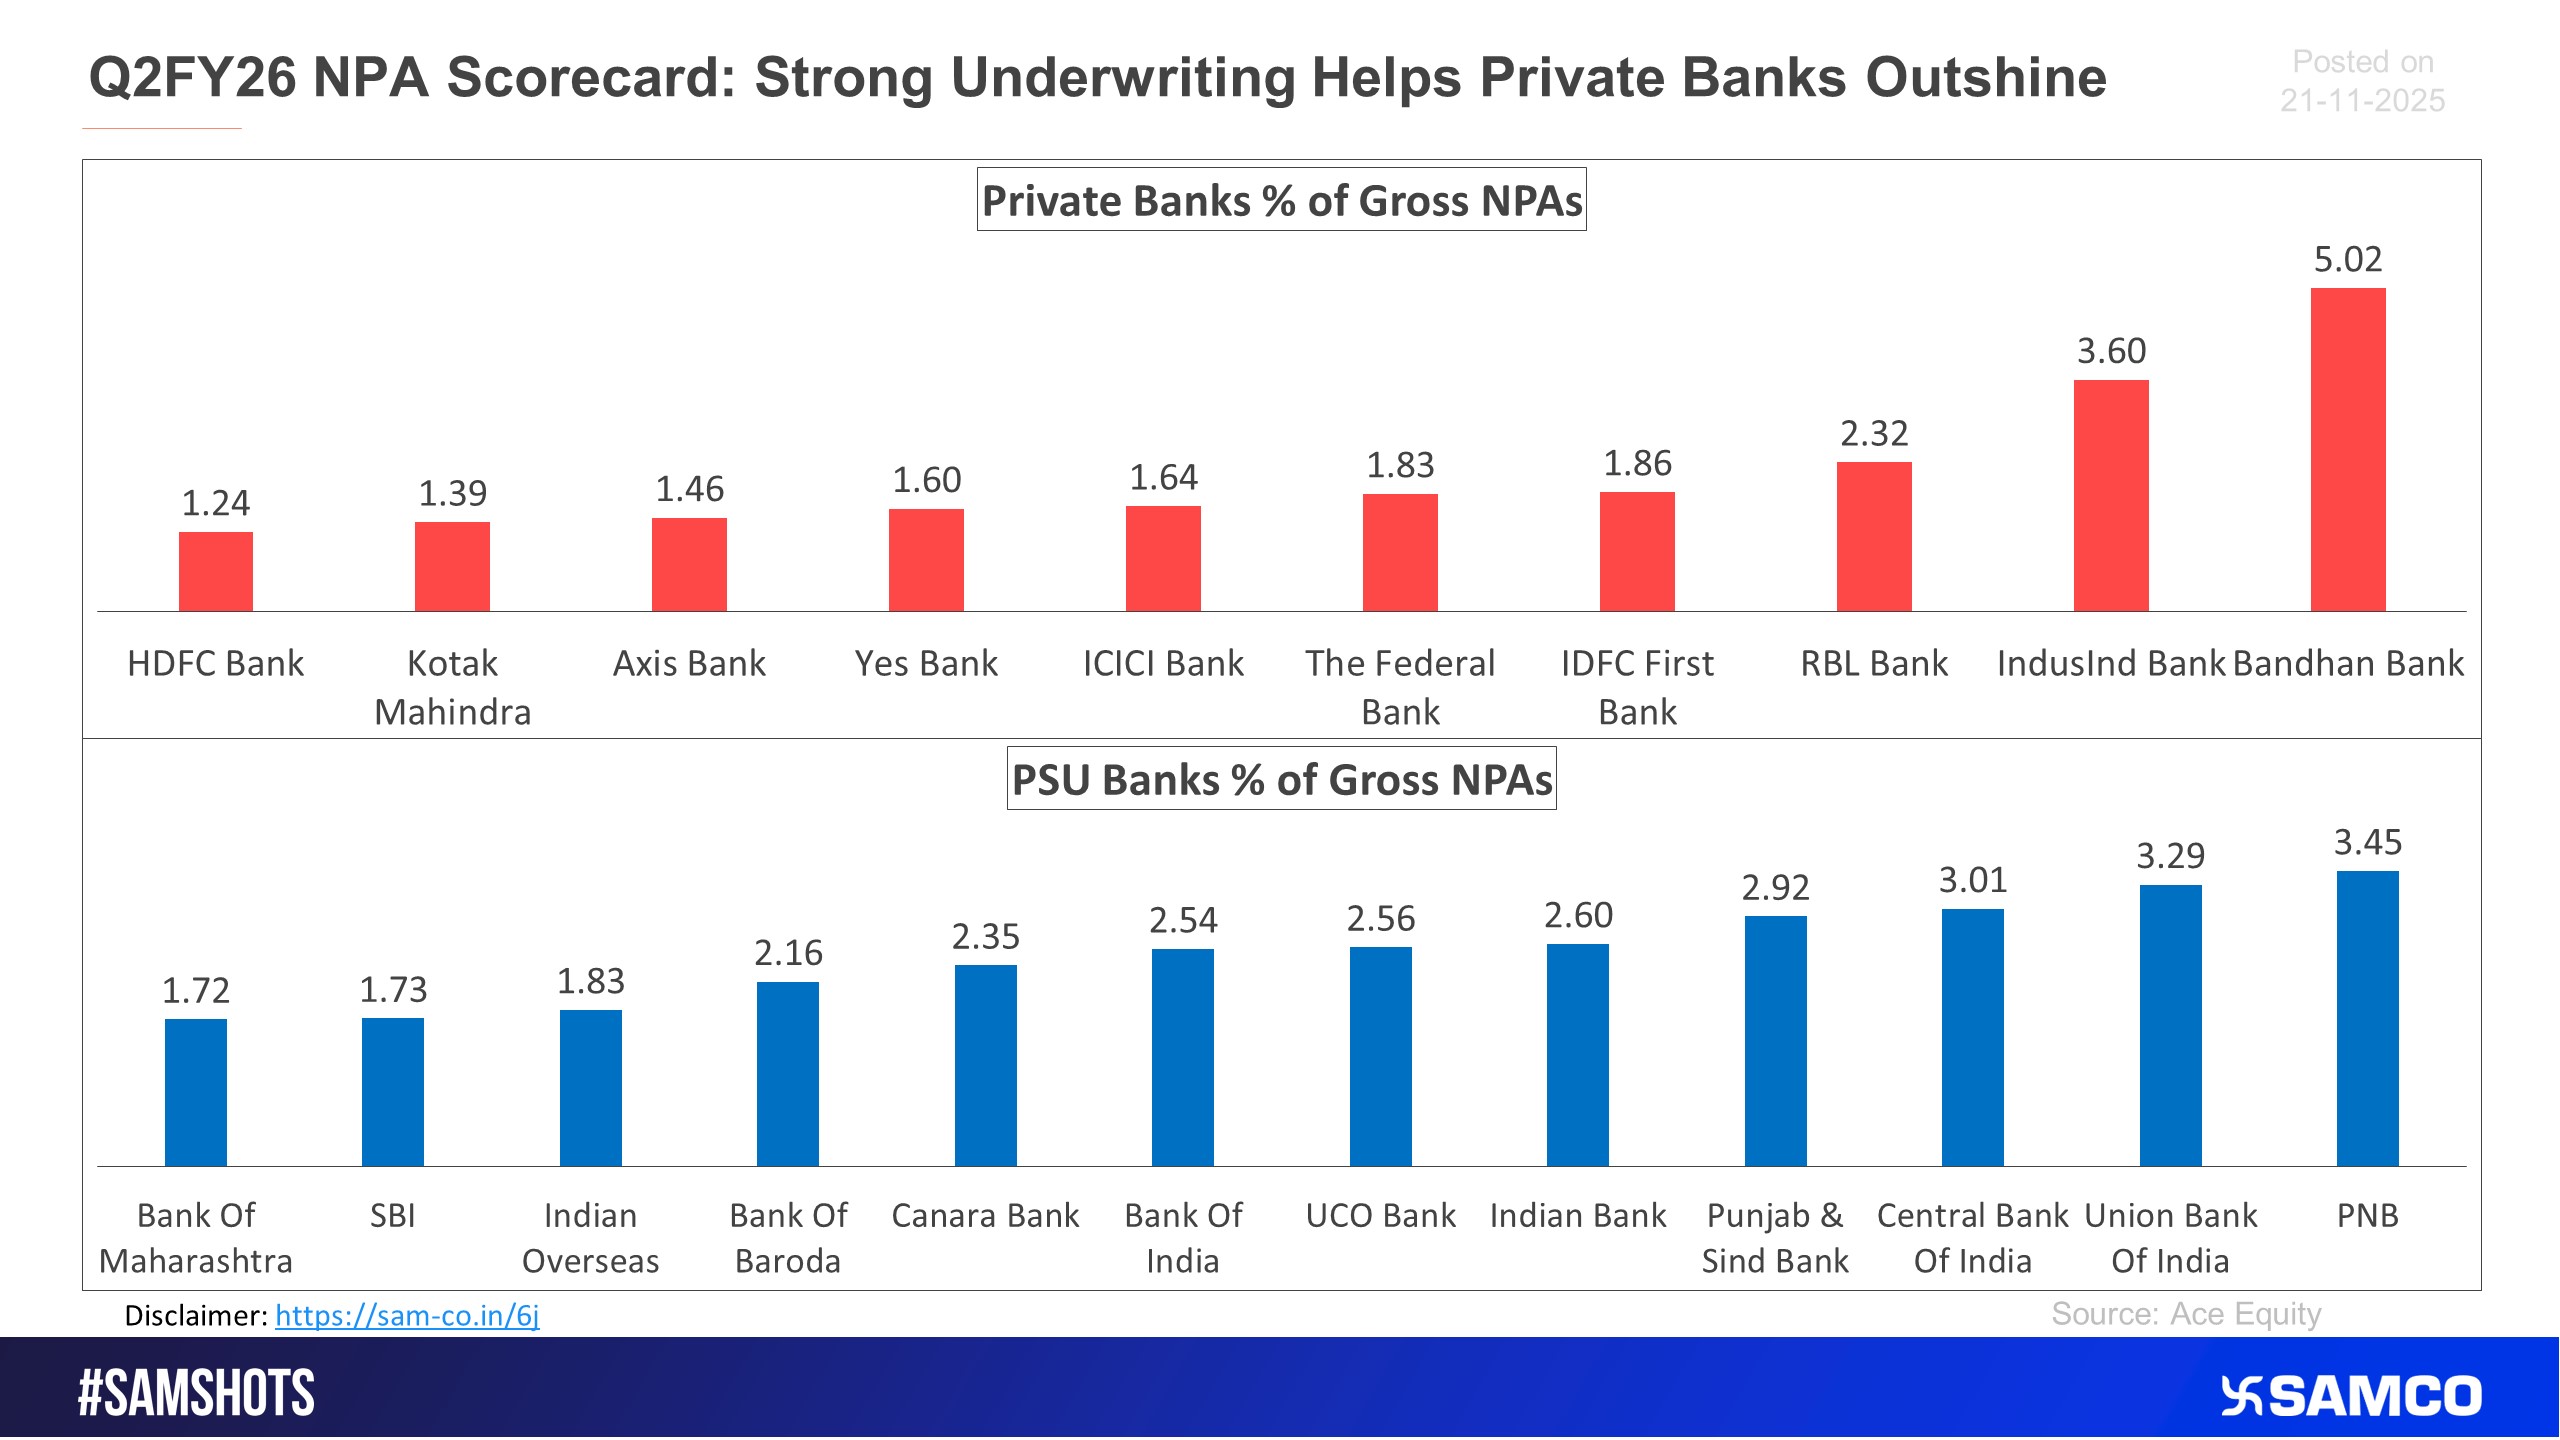
The below snip shows the NPA comparison of private and PSU banks for Q2FY26.
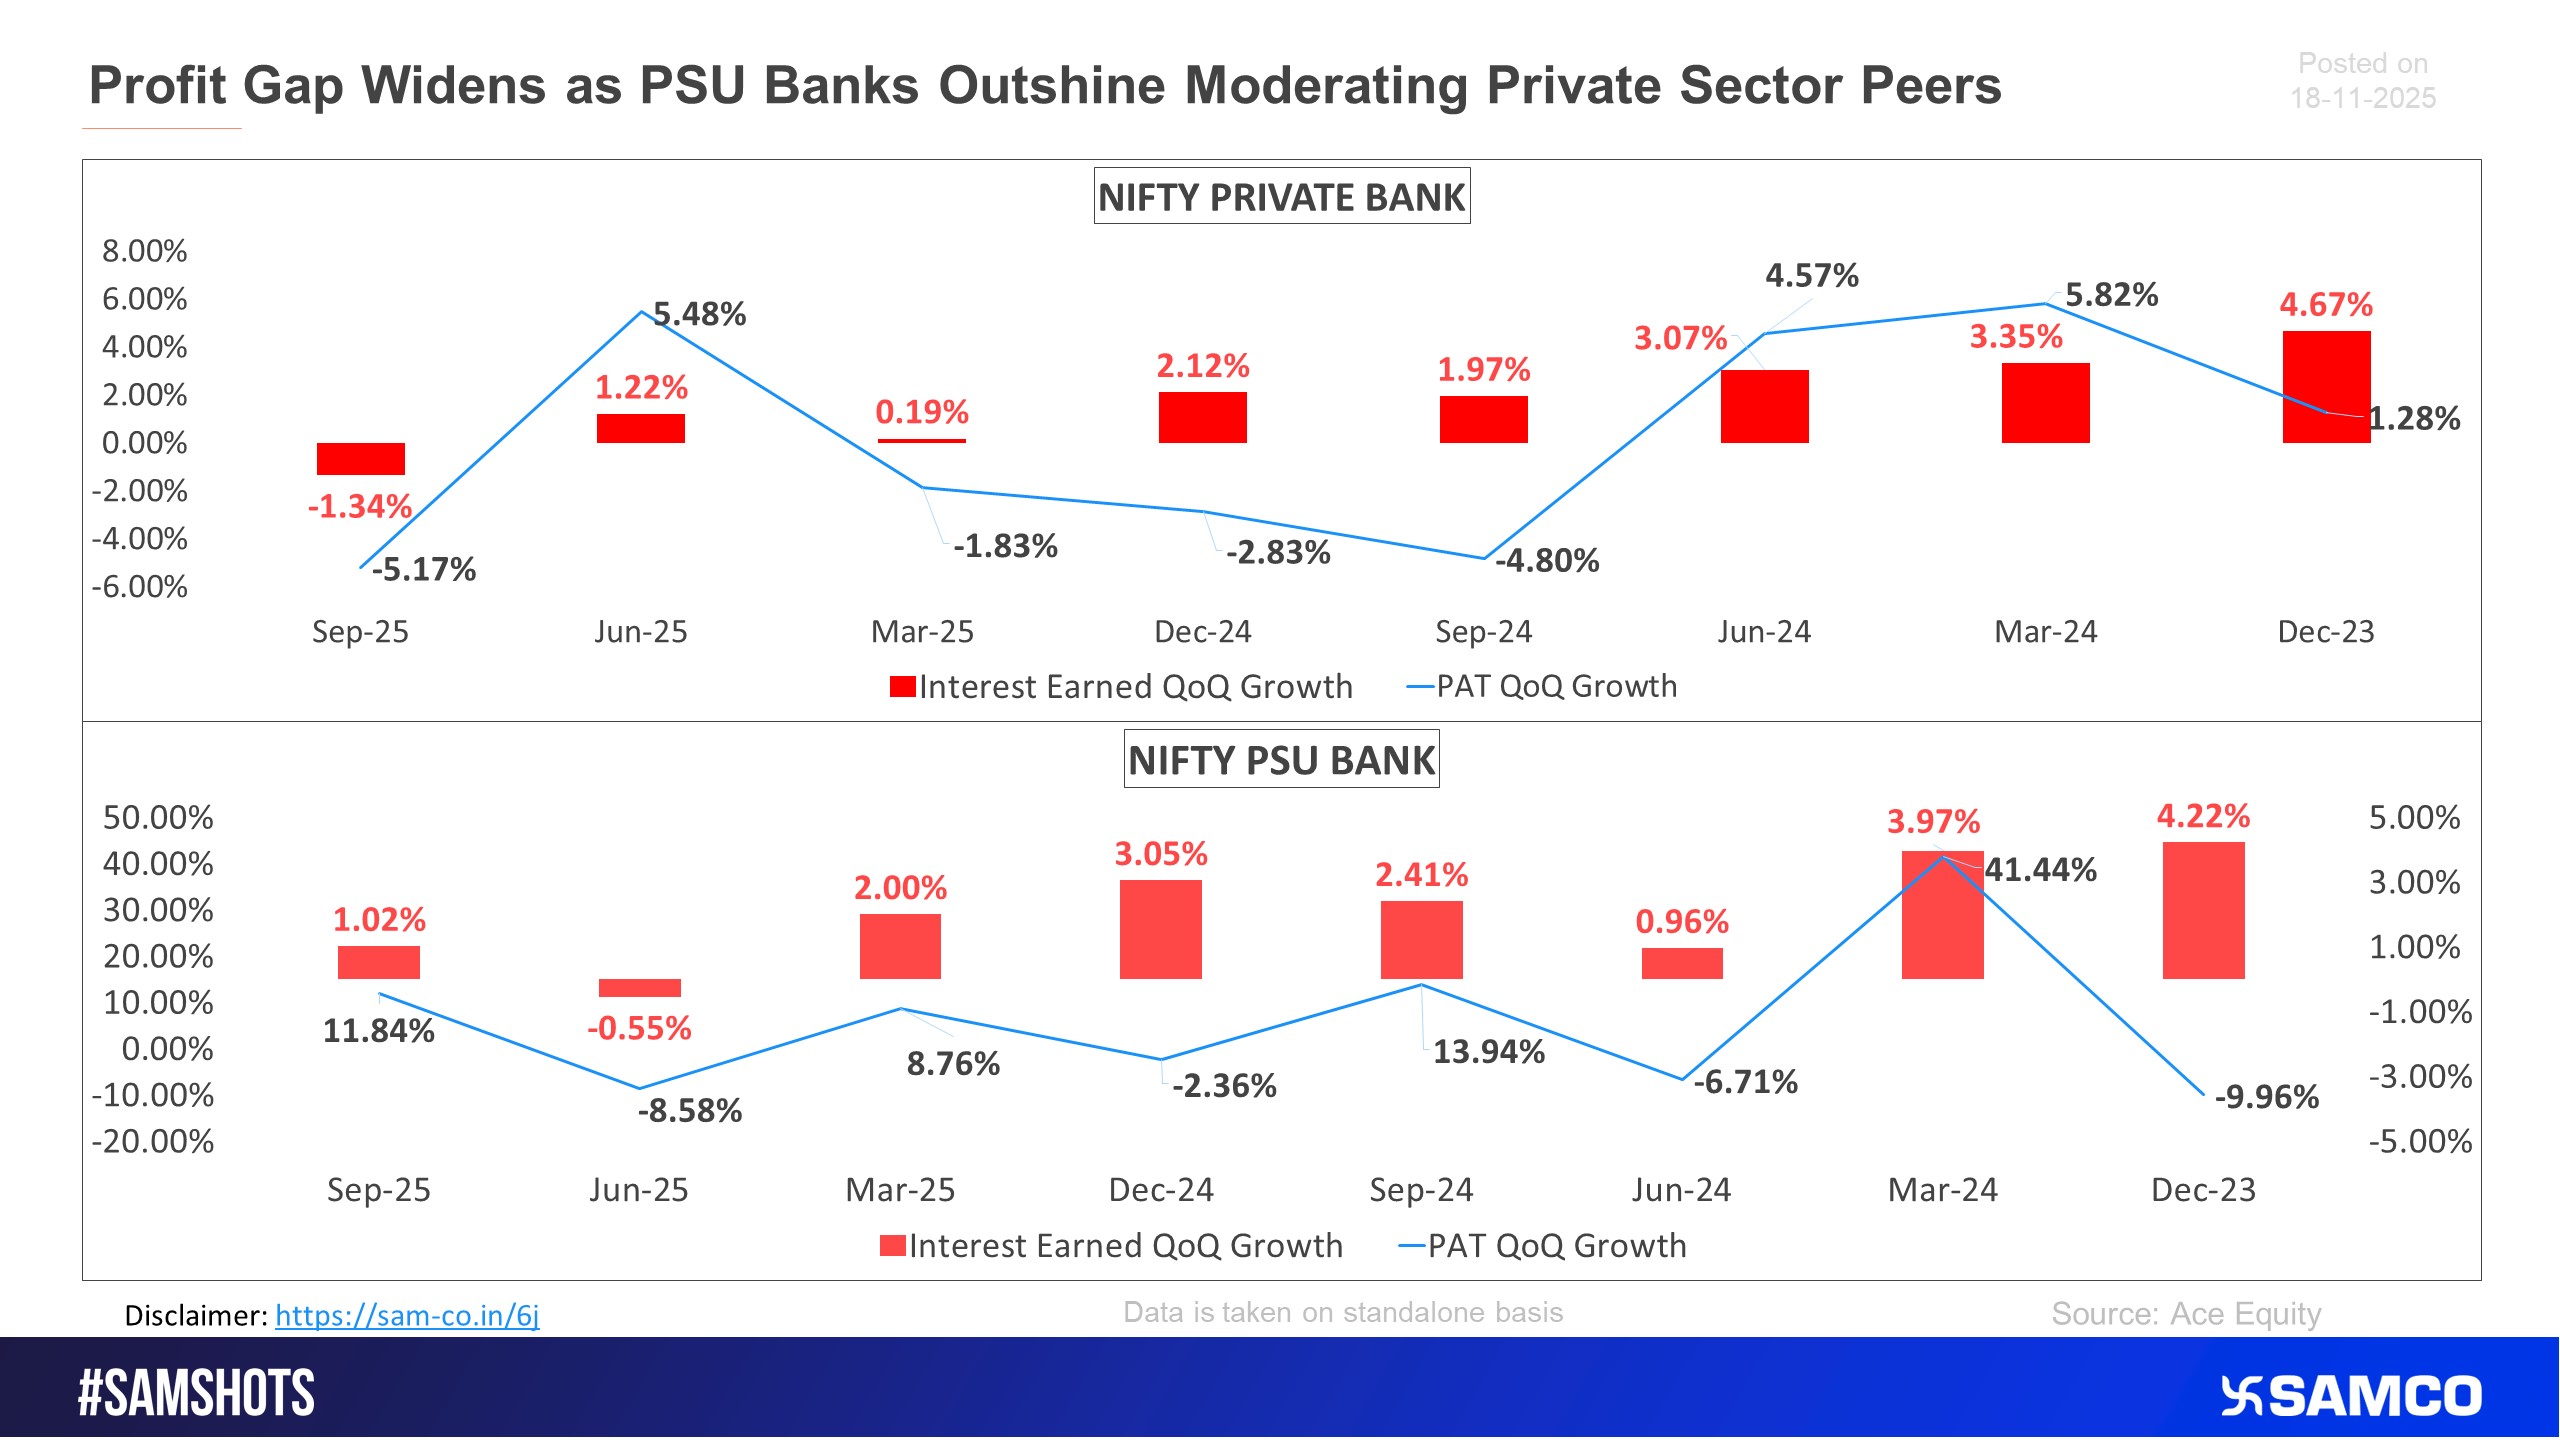
Here’s the snapshot of the Interest earned and PAT QoQ growth of Nifty private banks and nifty PSU bank index on an aggregate level.
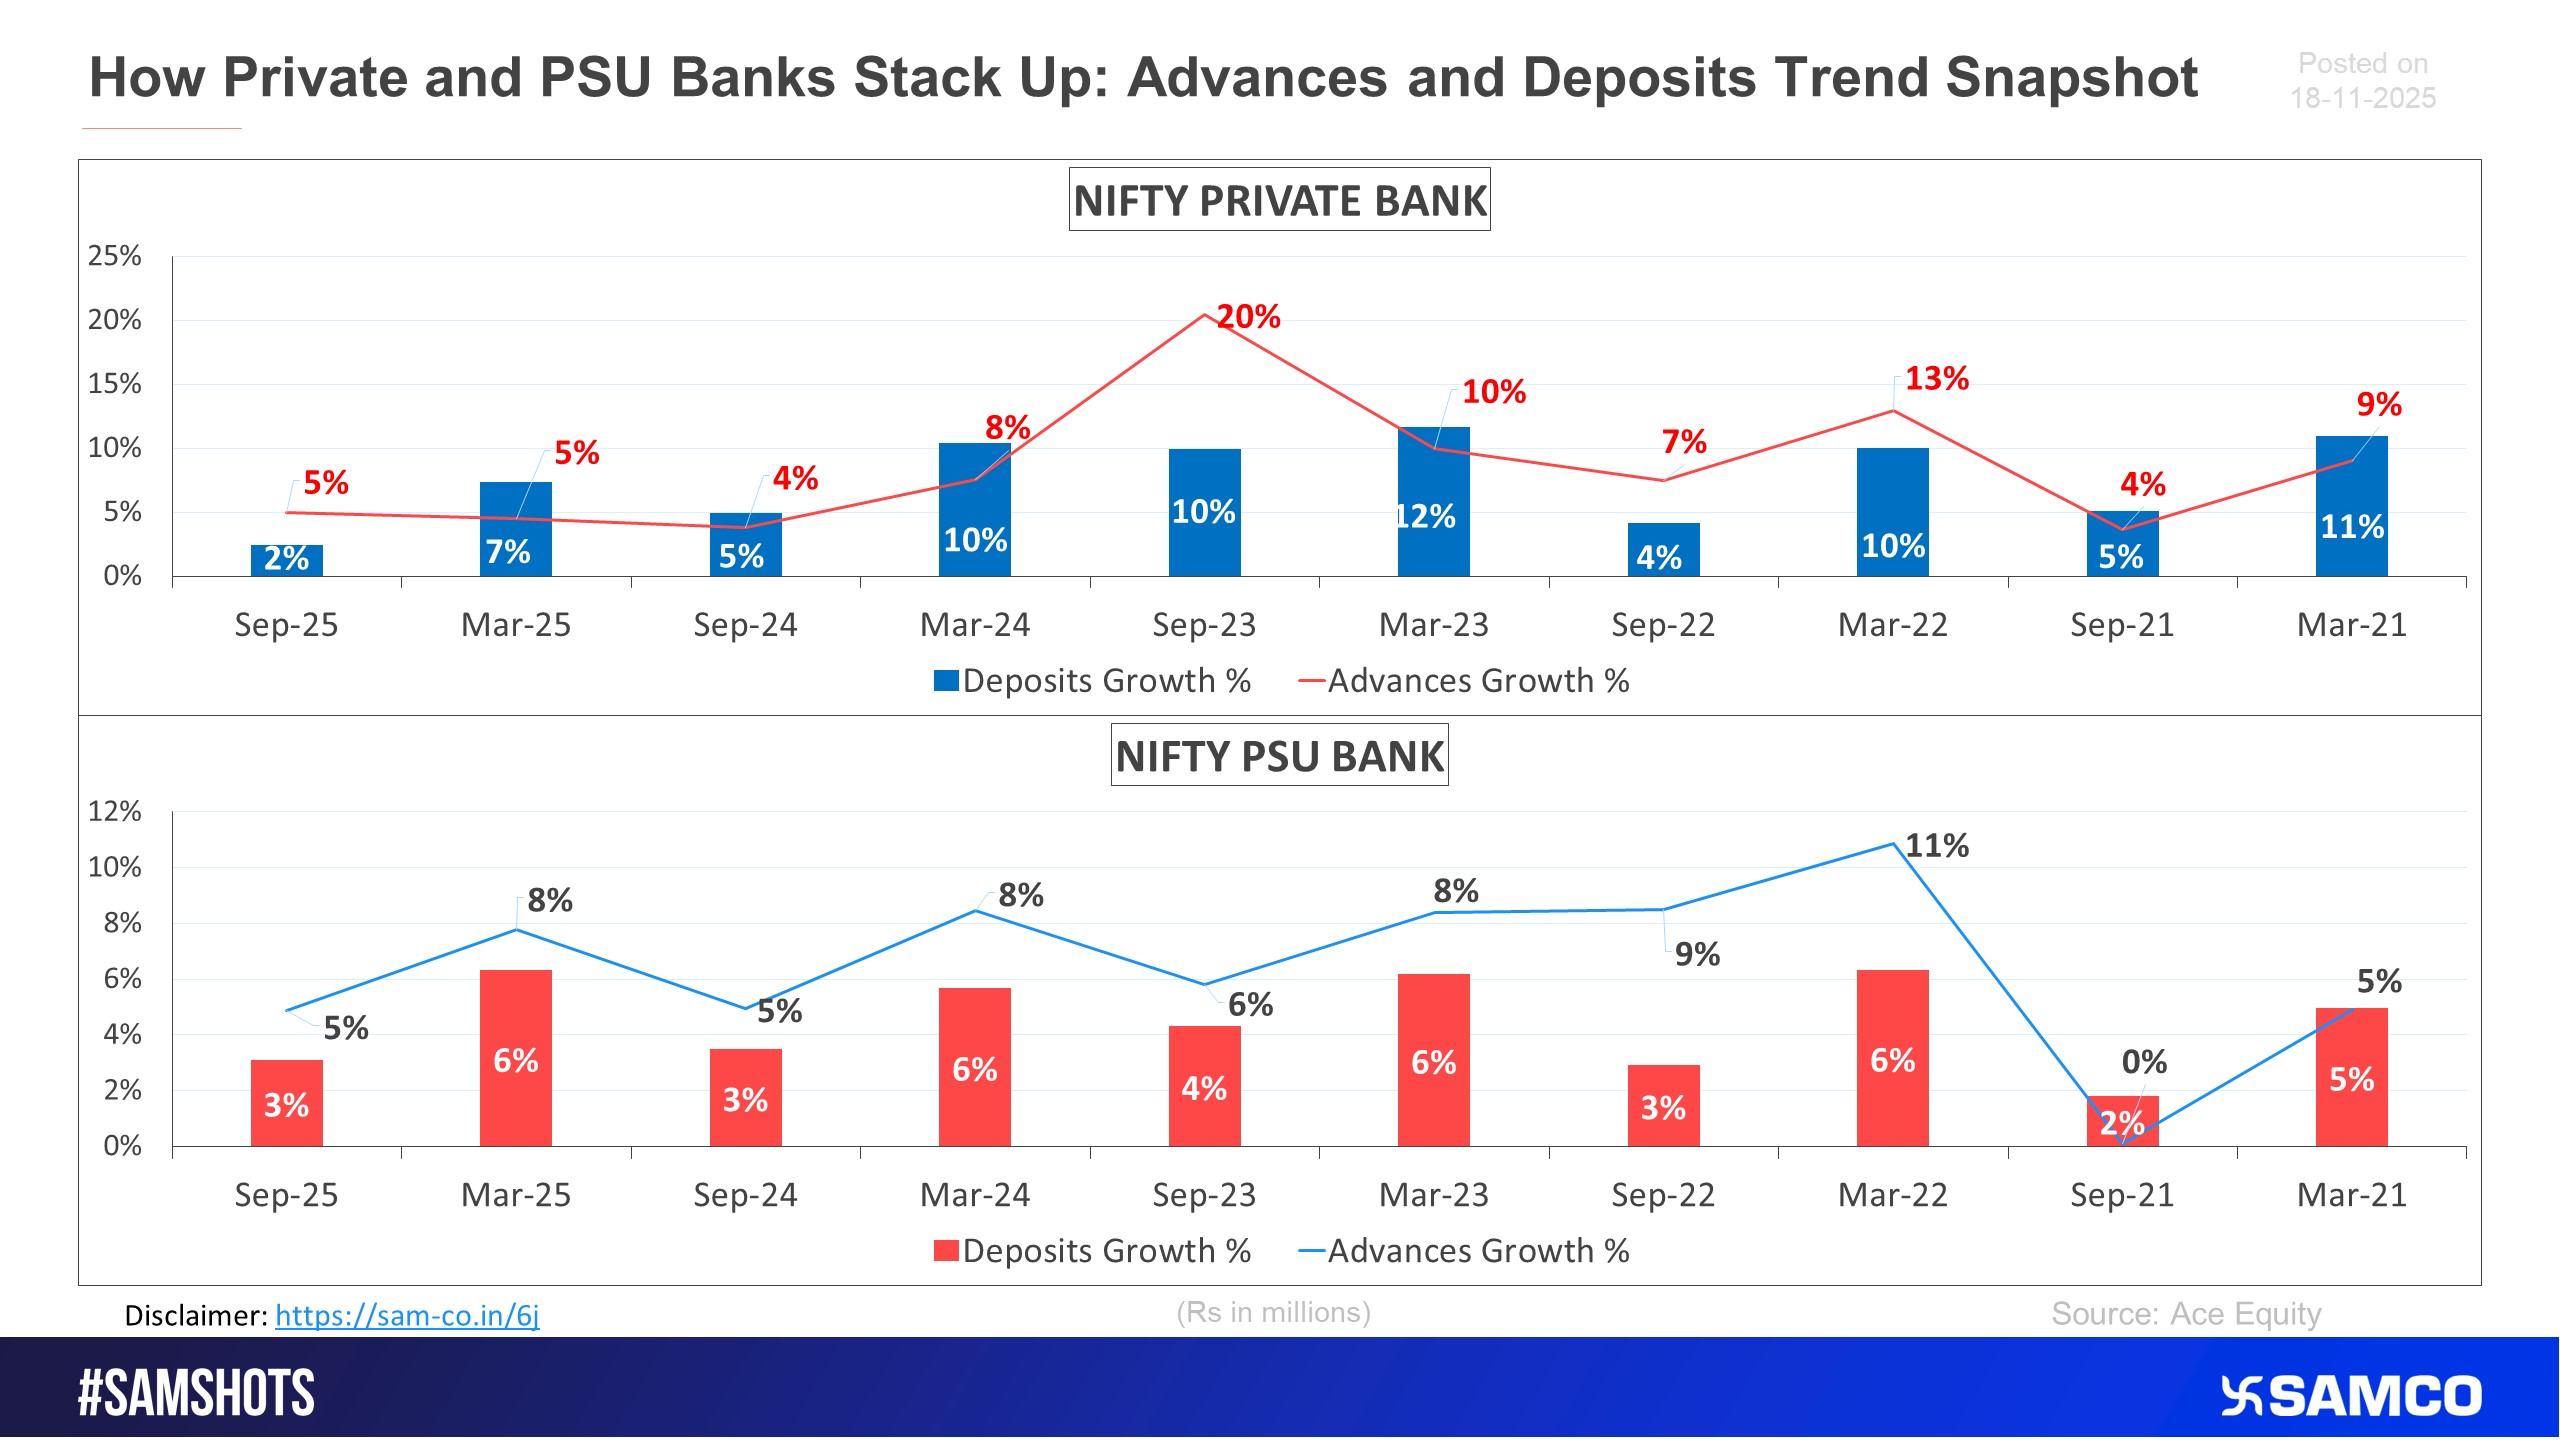
Here’s the Deposits and Advances QoQ growth of Nifty private banks and nifty PSU bank index on an aggregate level.
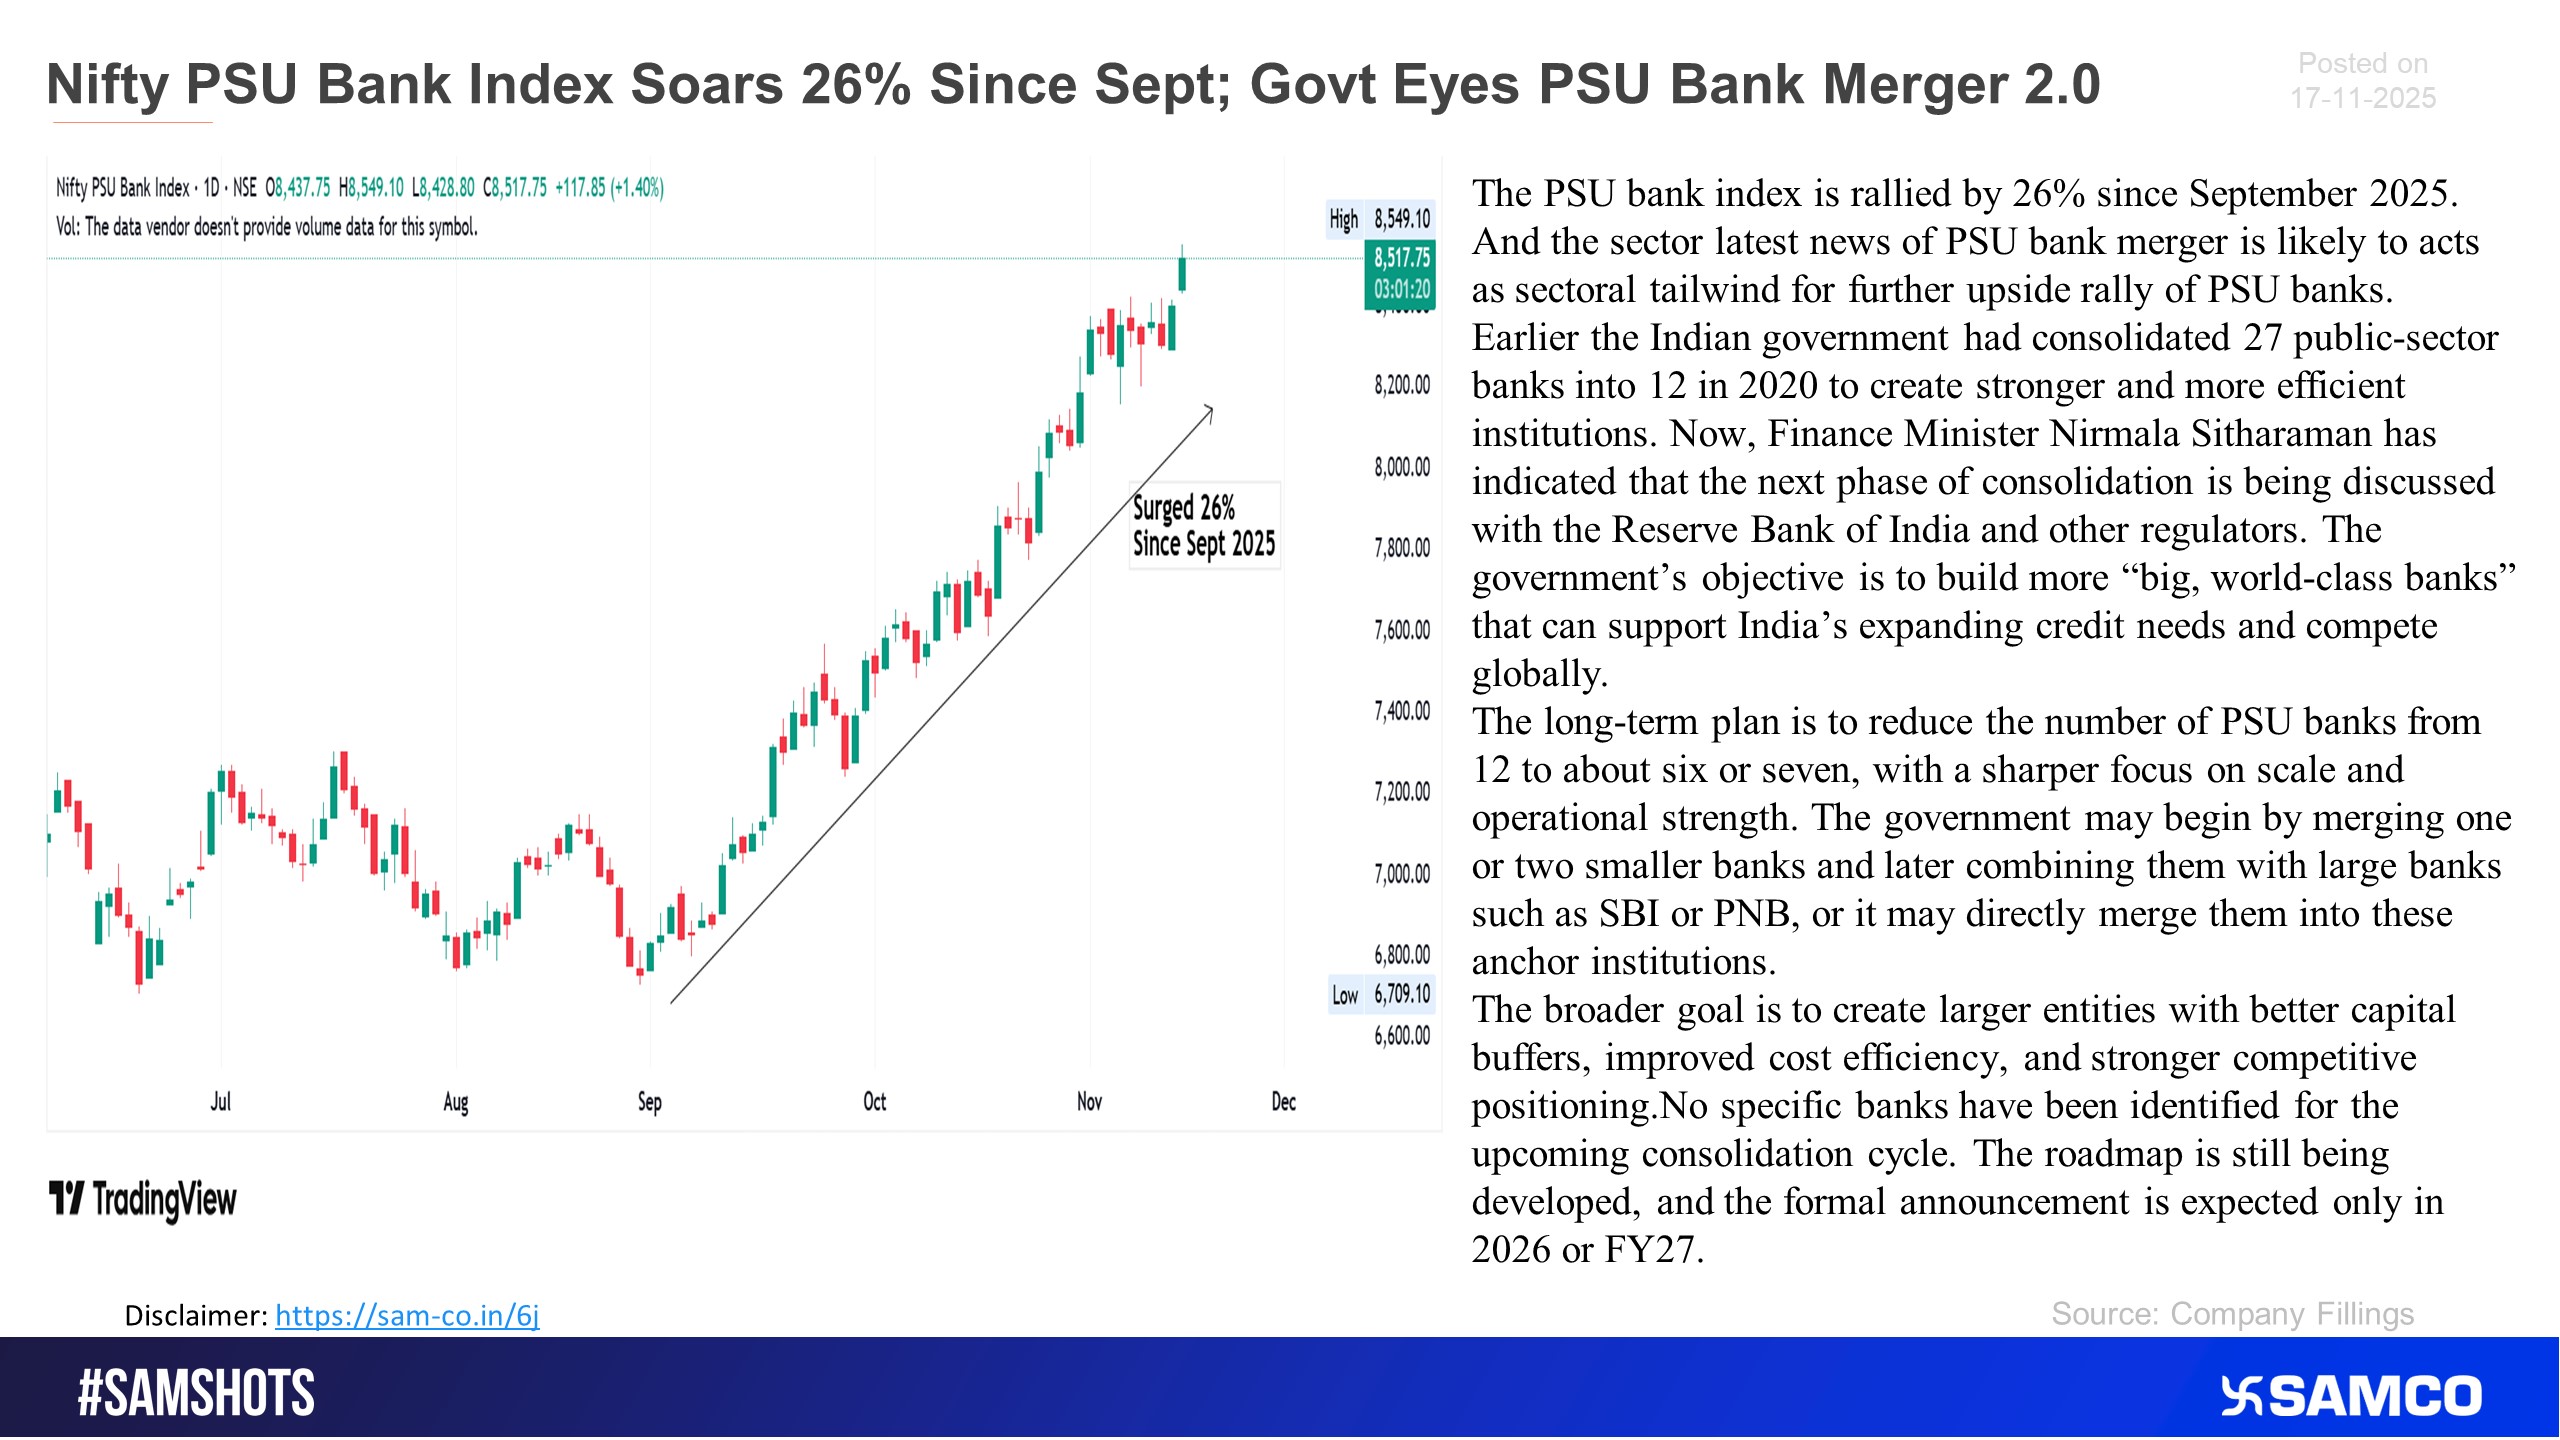
The Nifty PSU Bank Index surged on expectations of news regarding a potential PSU bank merger.
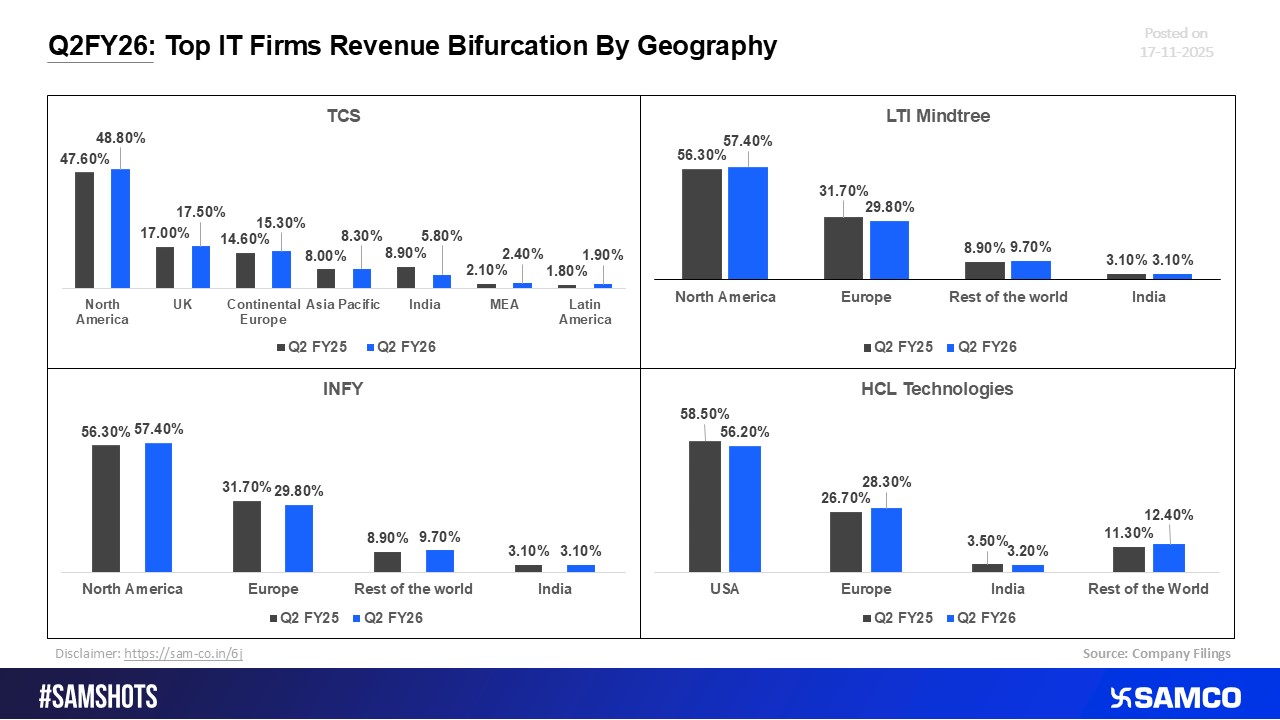
Q2FY26: Revenue Split by Geography for Leading IT Firms
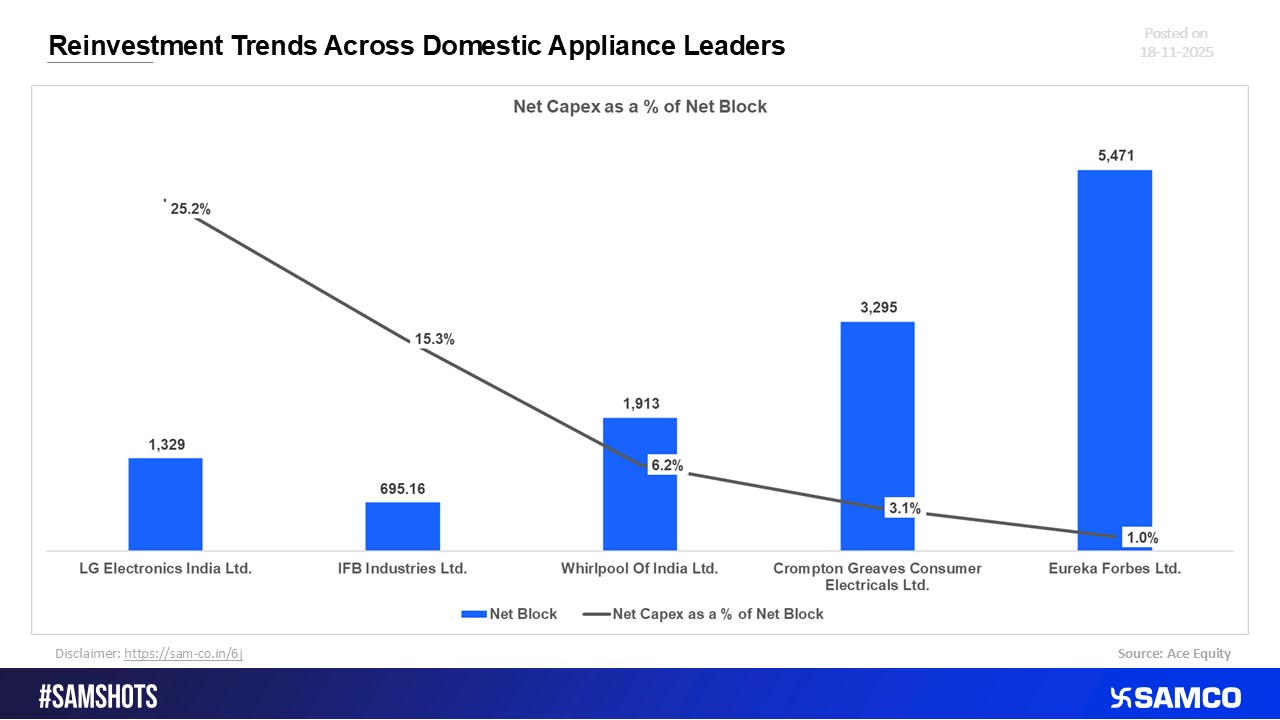
Capital Allocation Trends in Top Household Appliance Firms
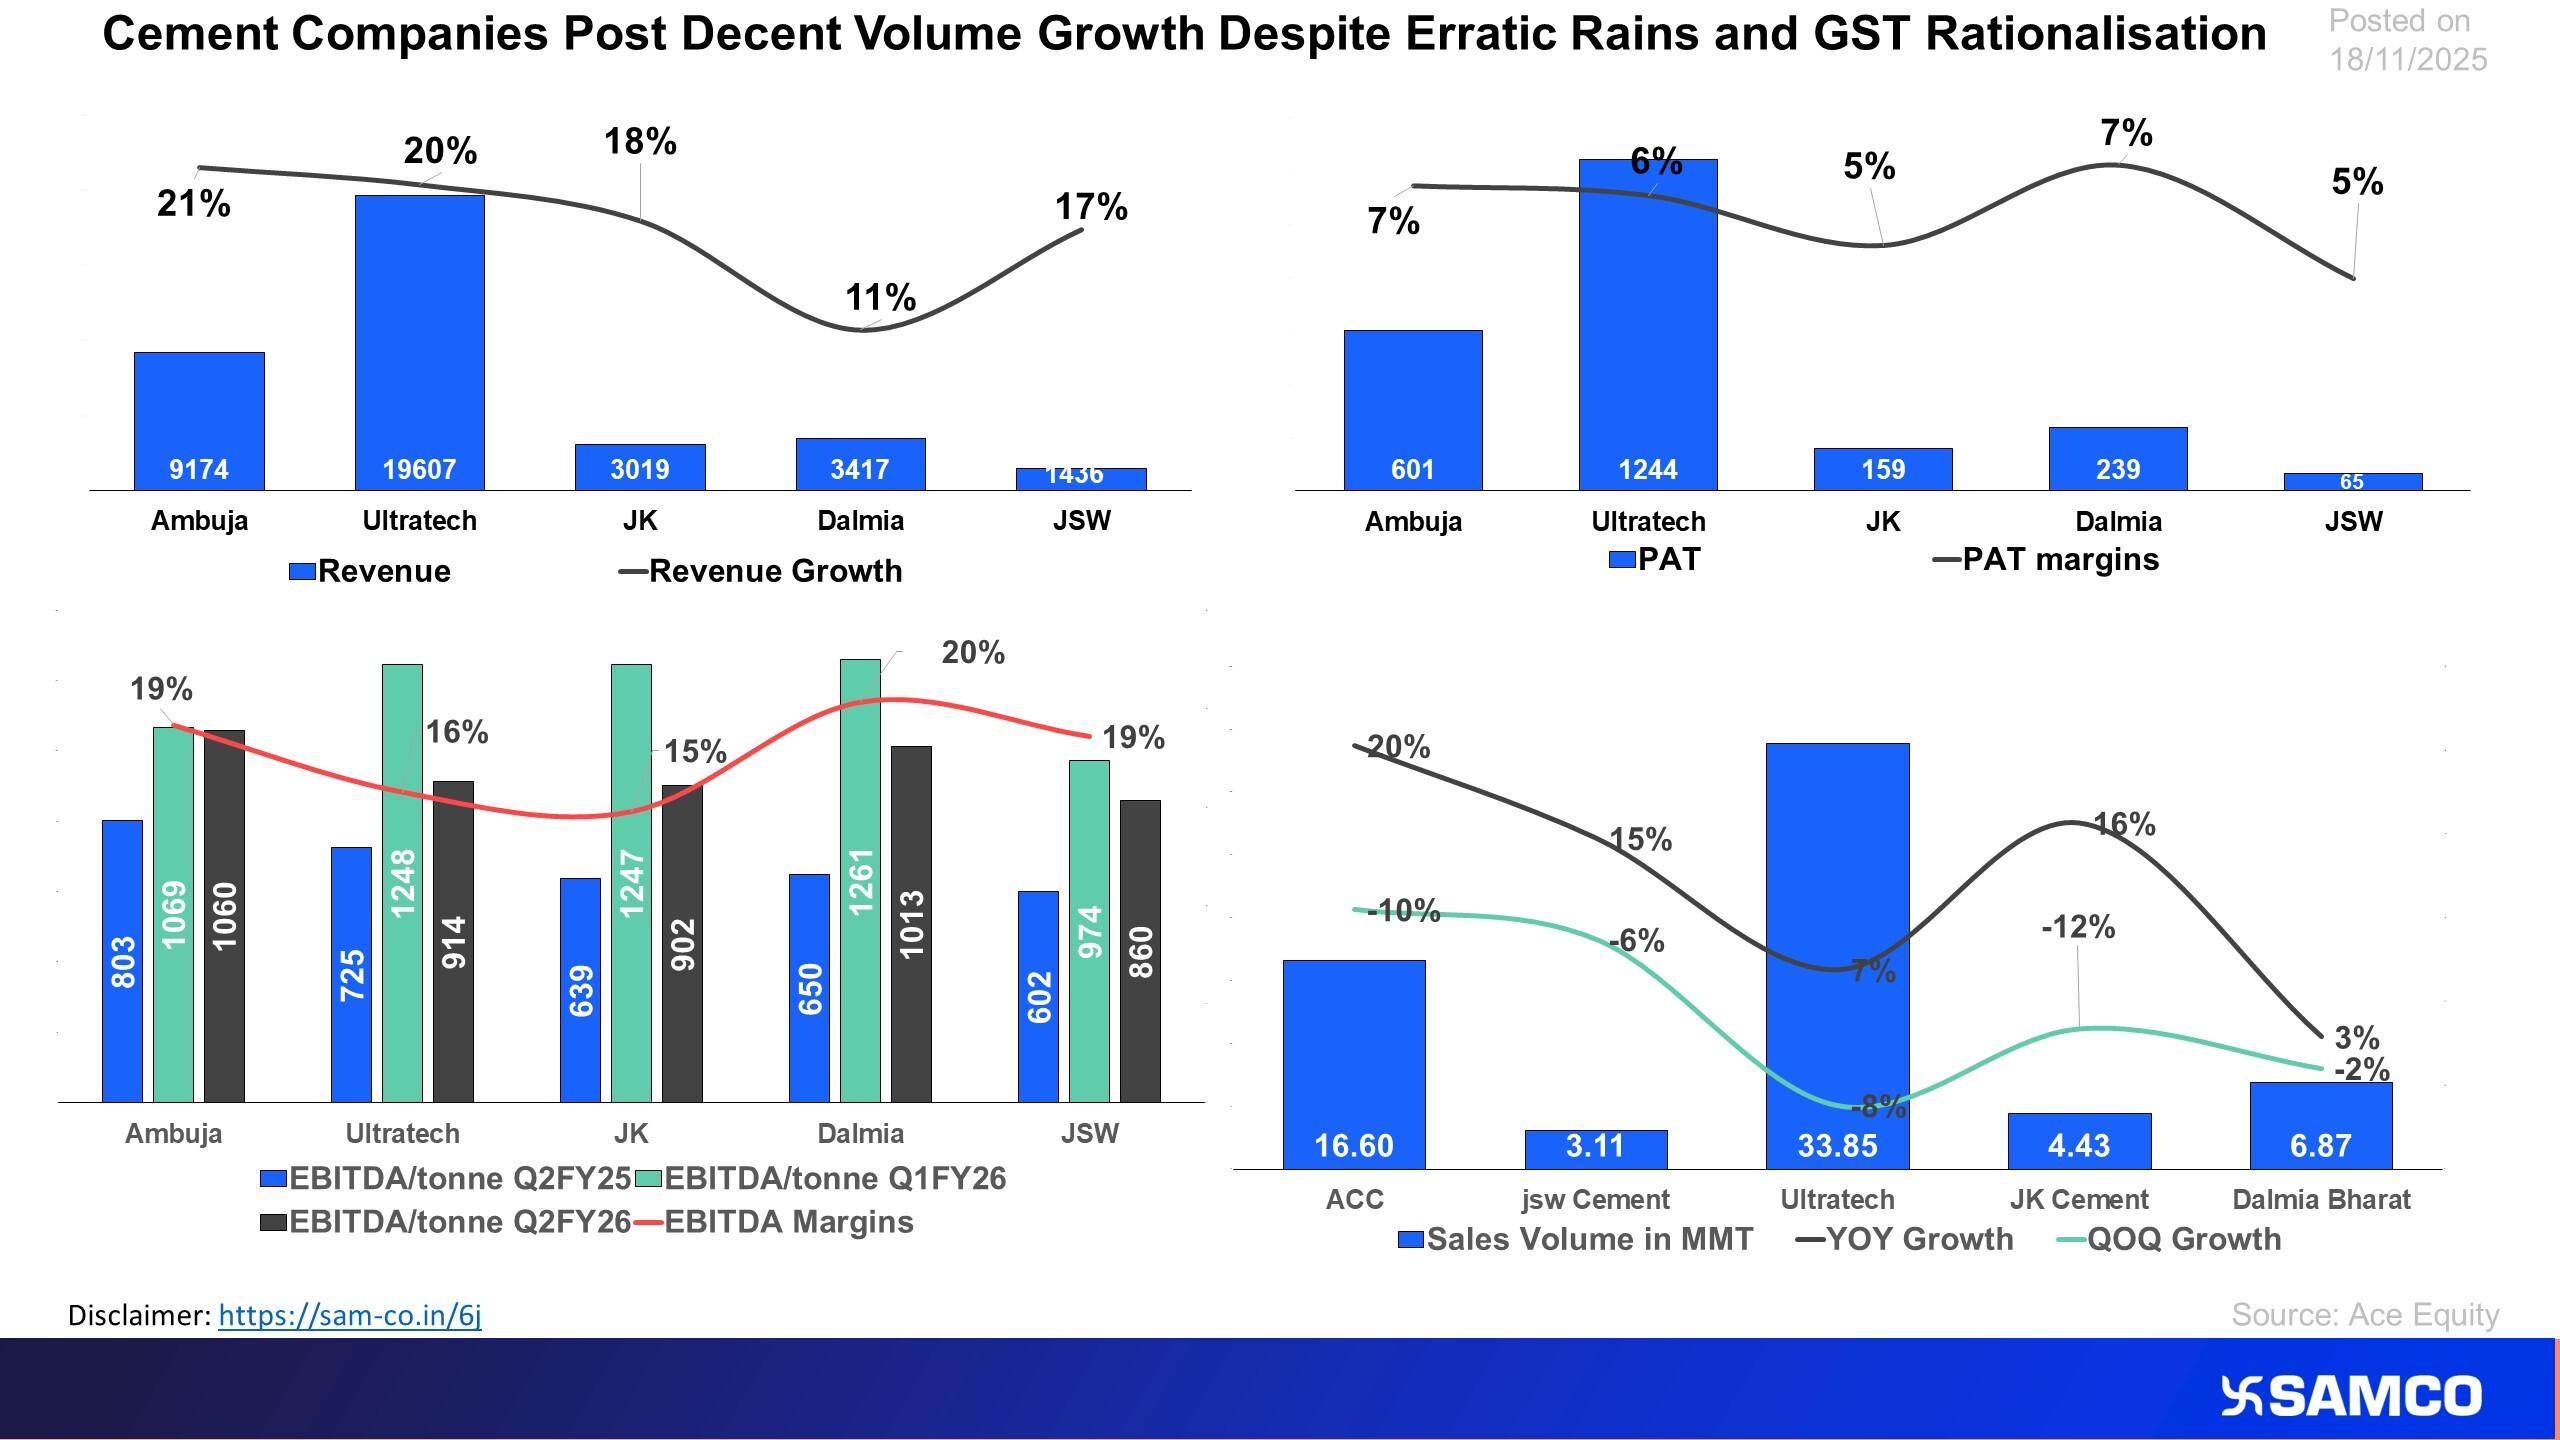
Cement companies sustain volume growth despite erratic rains and GST
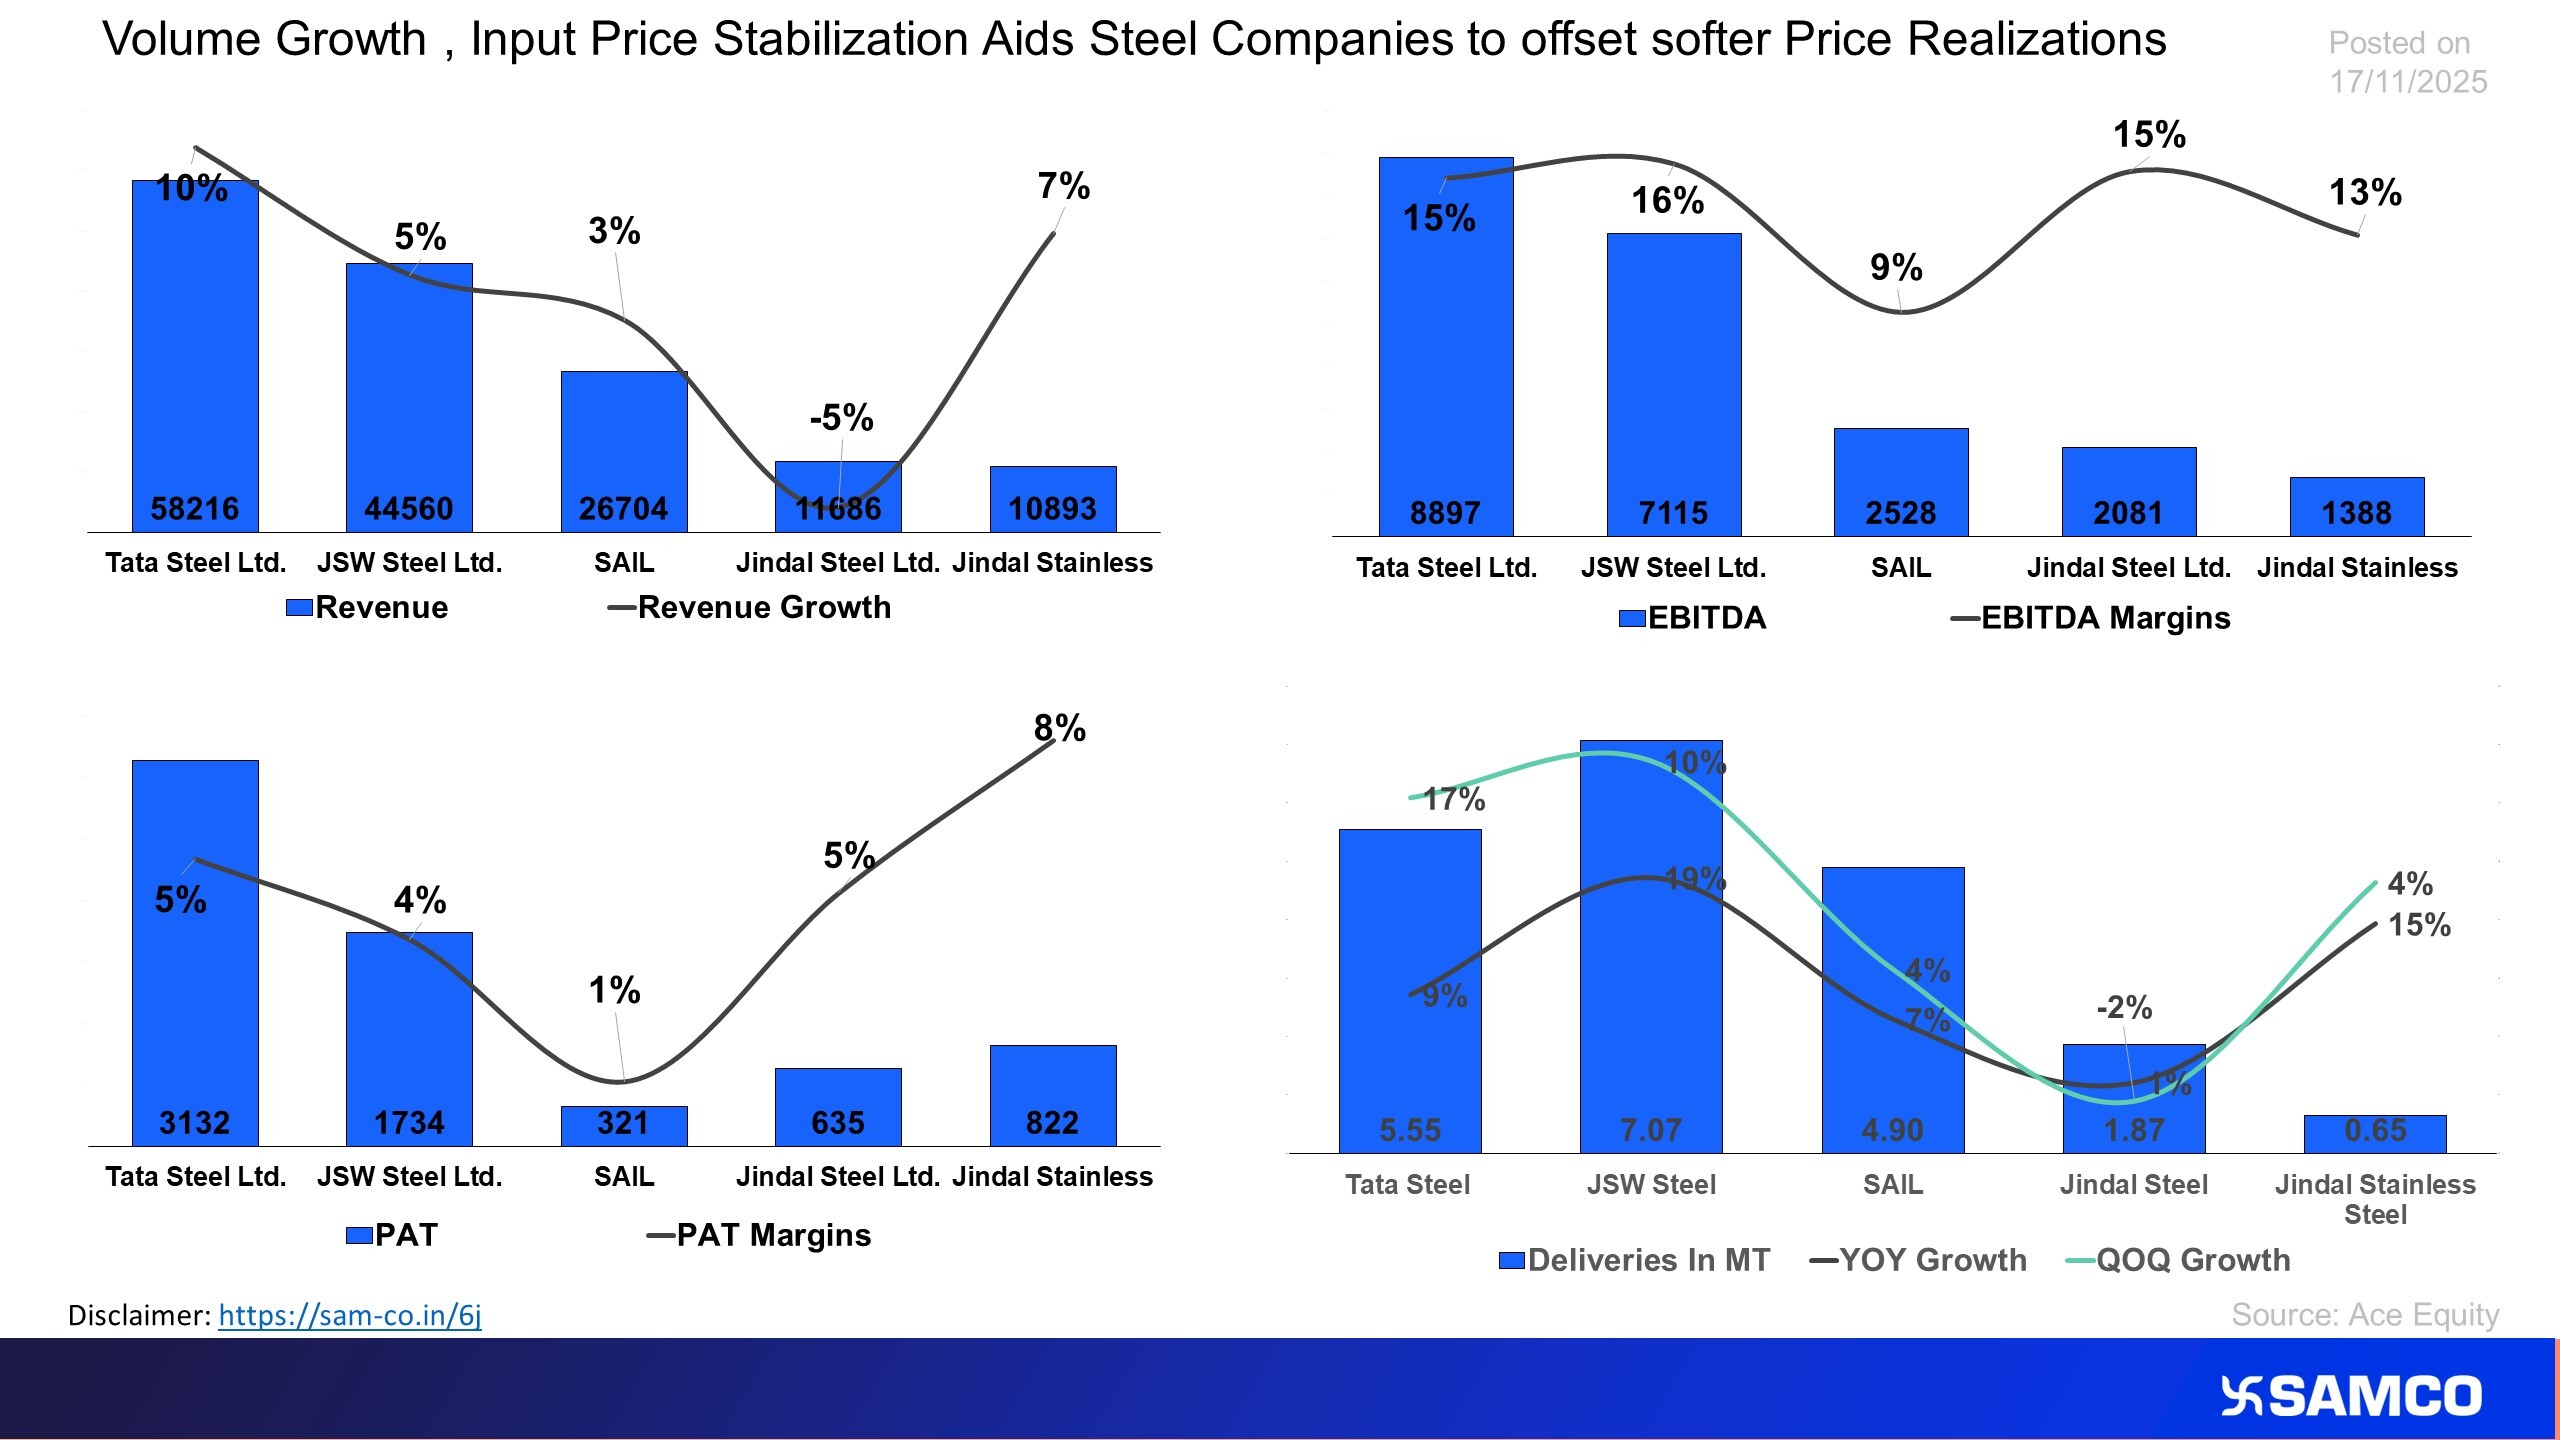
Volume growth offsets soften prices for steel companies in Q2FY26
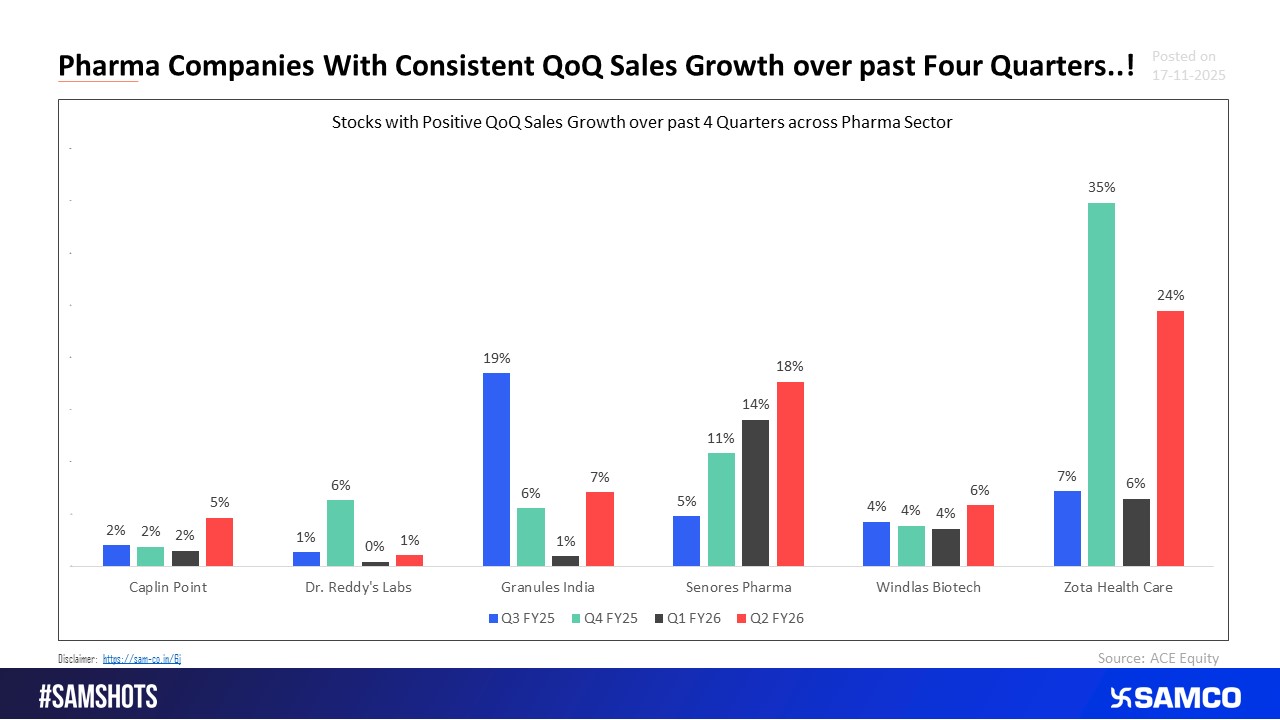
Consistent Gain of Market Share for these Pharma Companies over the Past 4 Quarters.
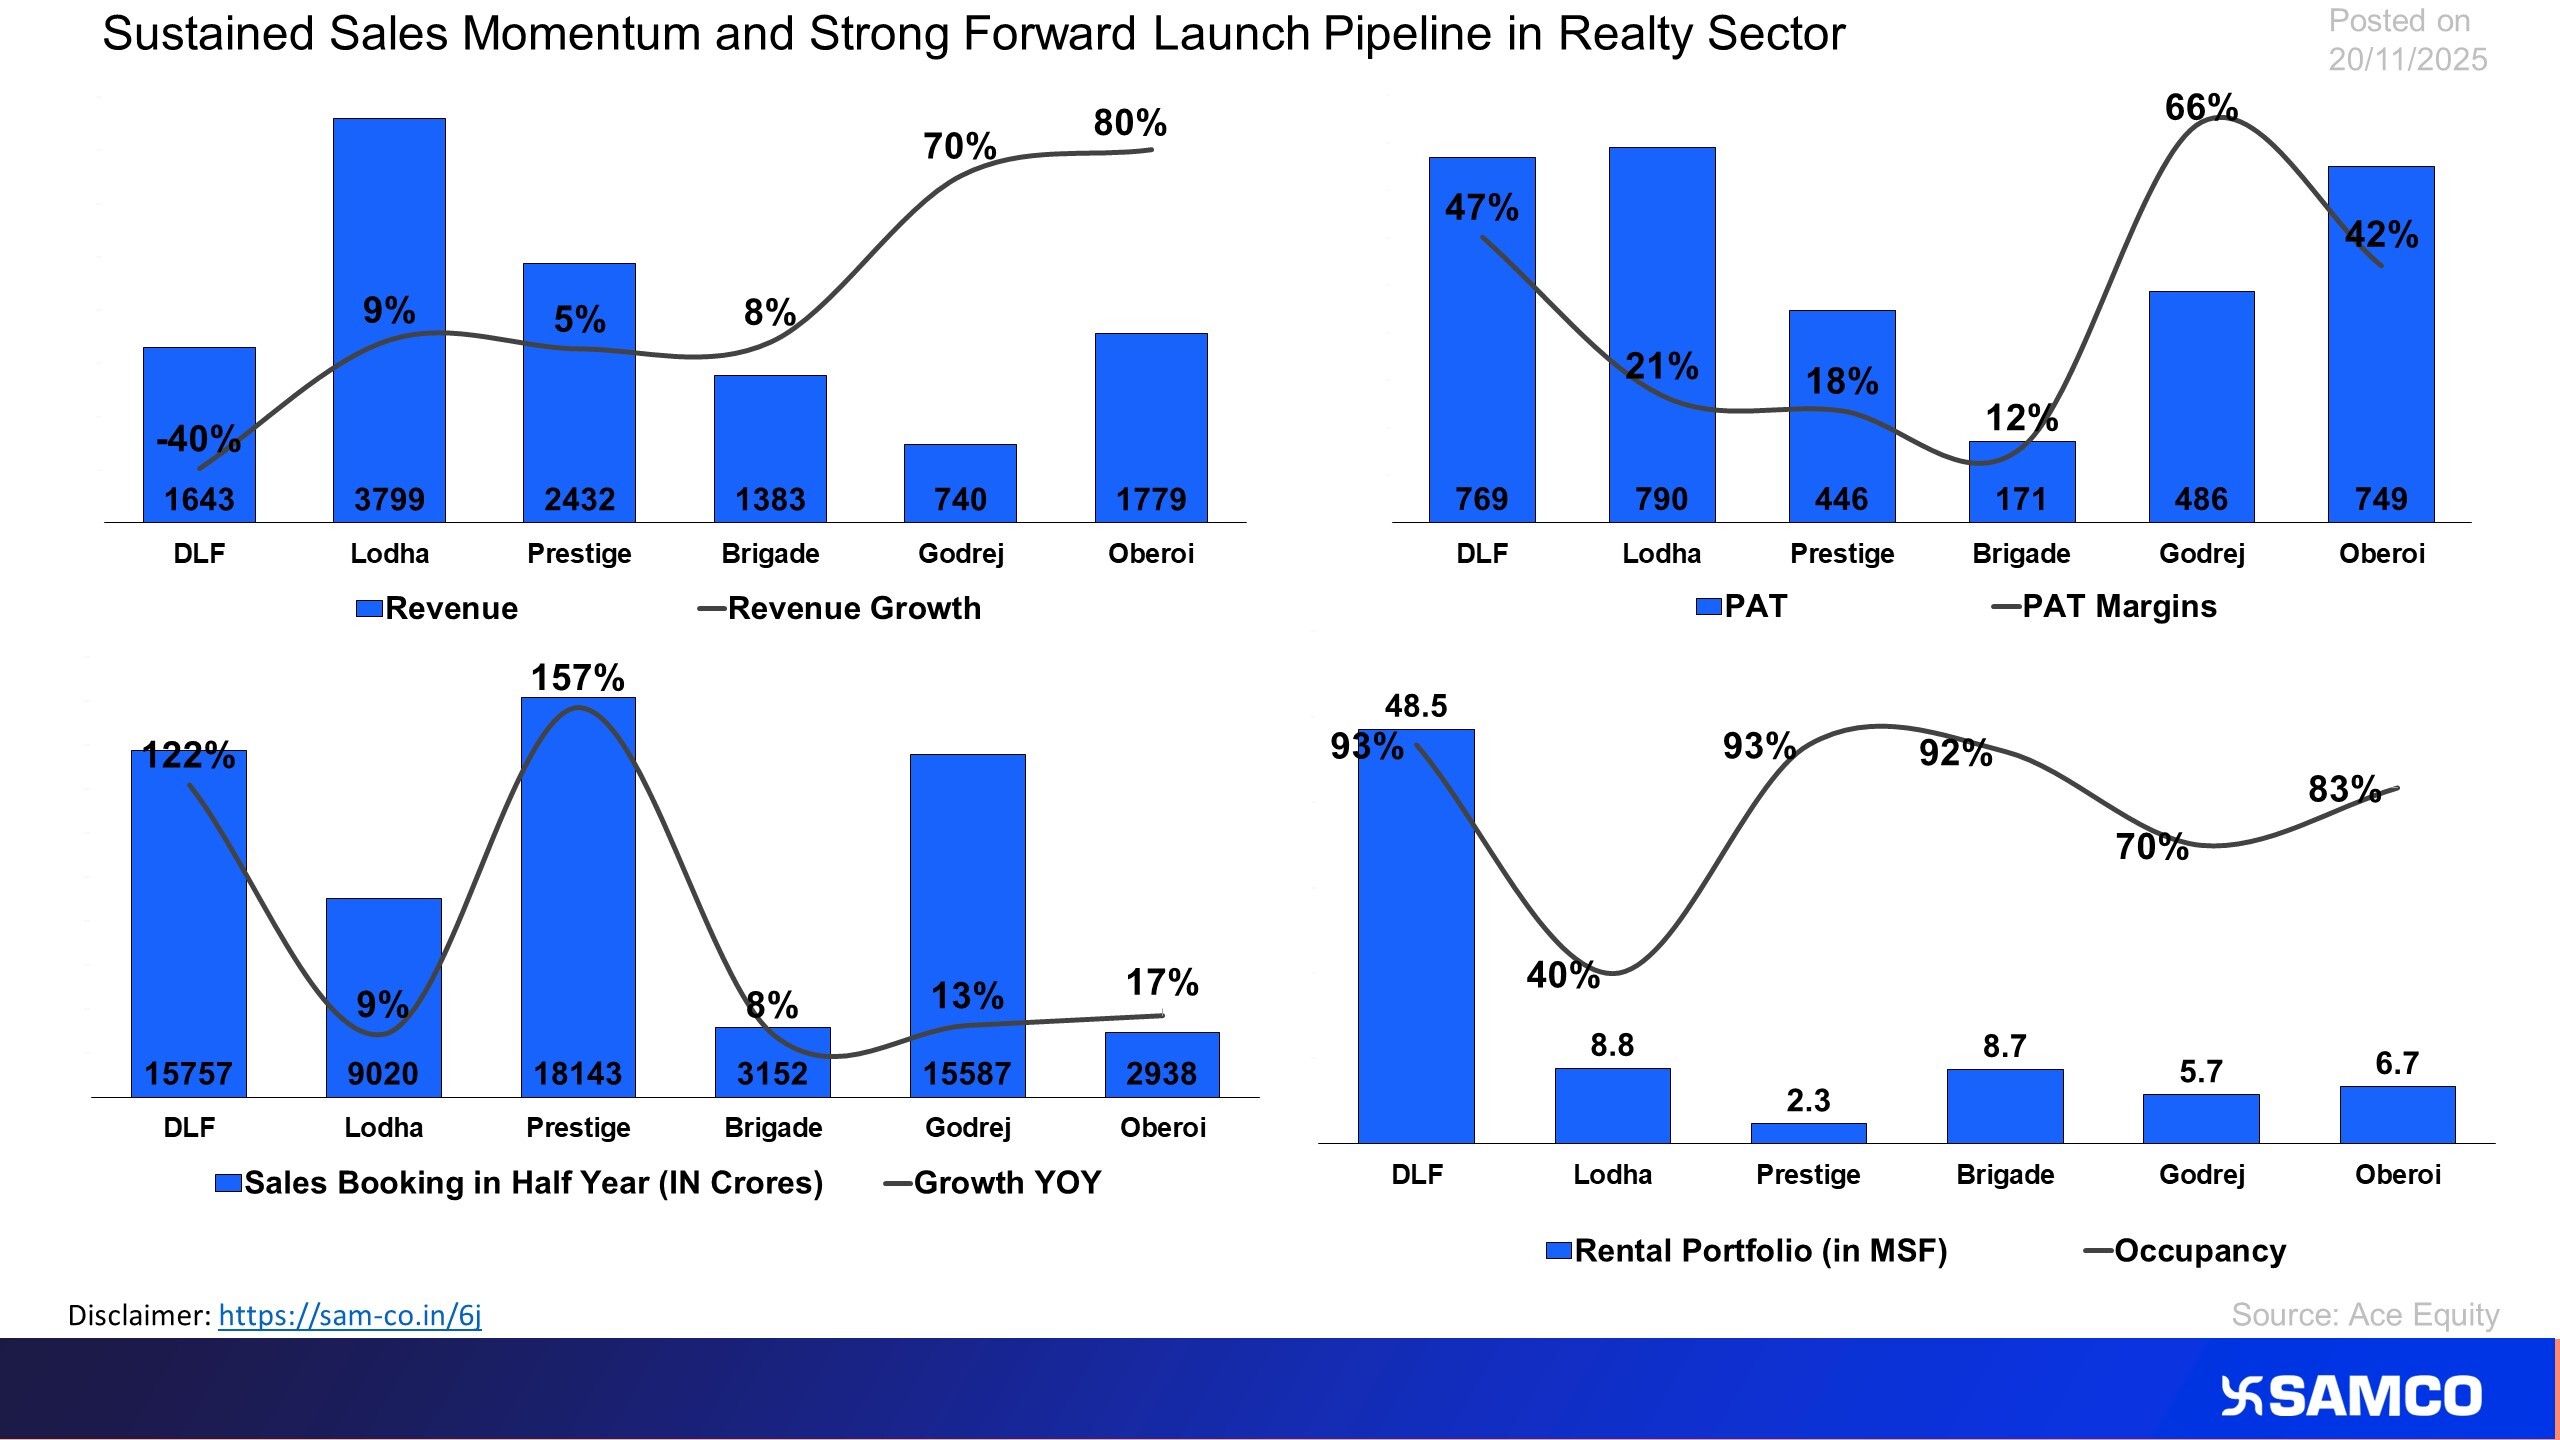
The chart analyses the financial and operational performance of realty companies
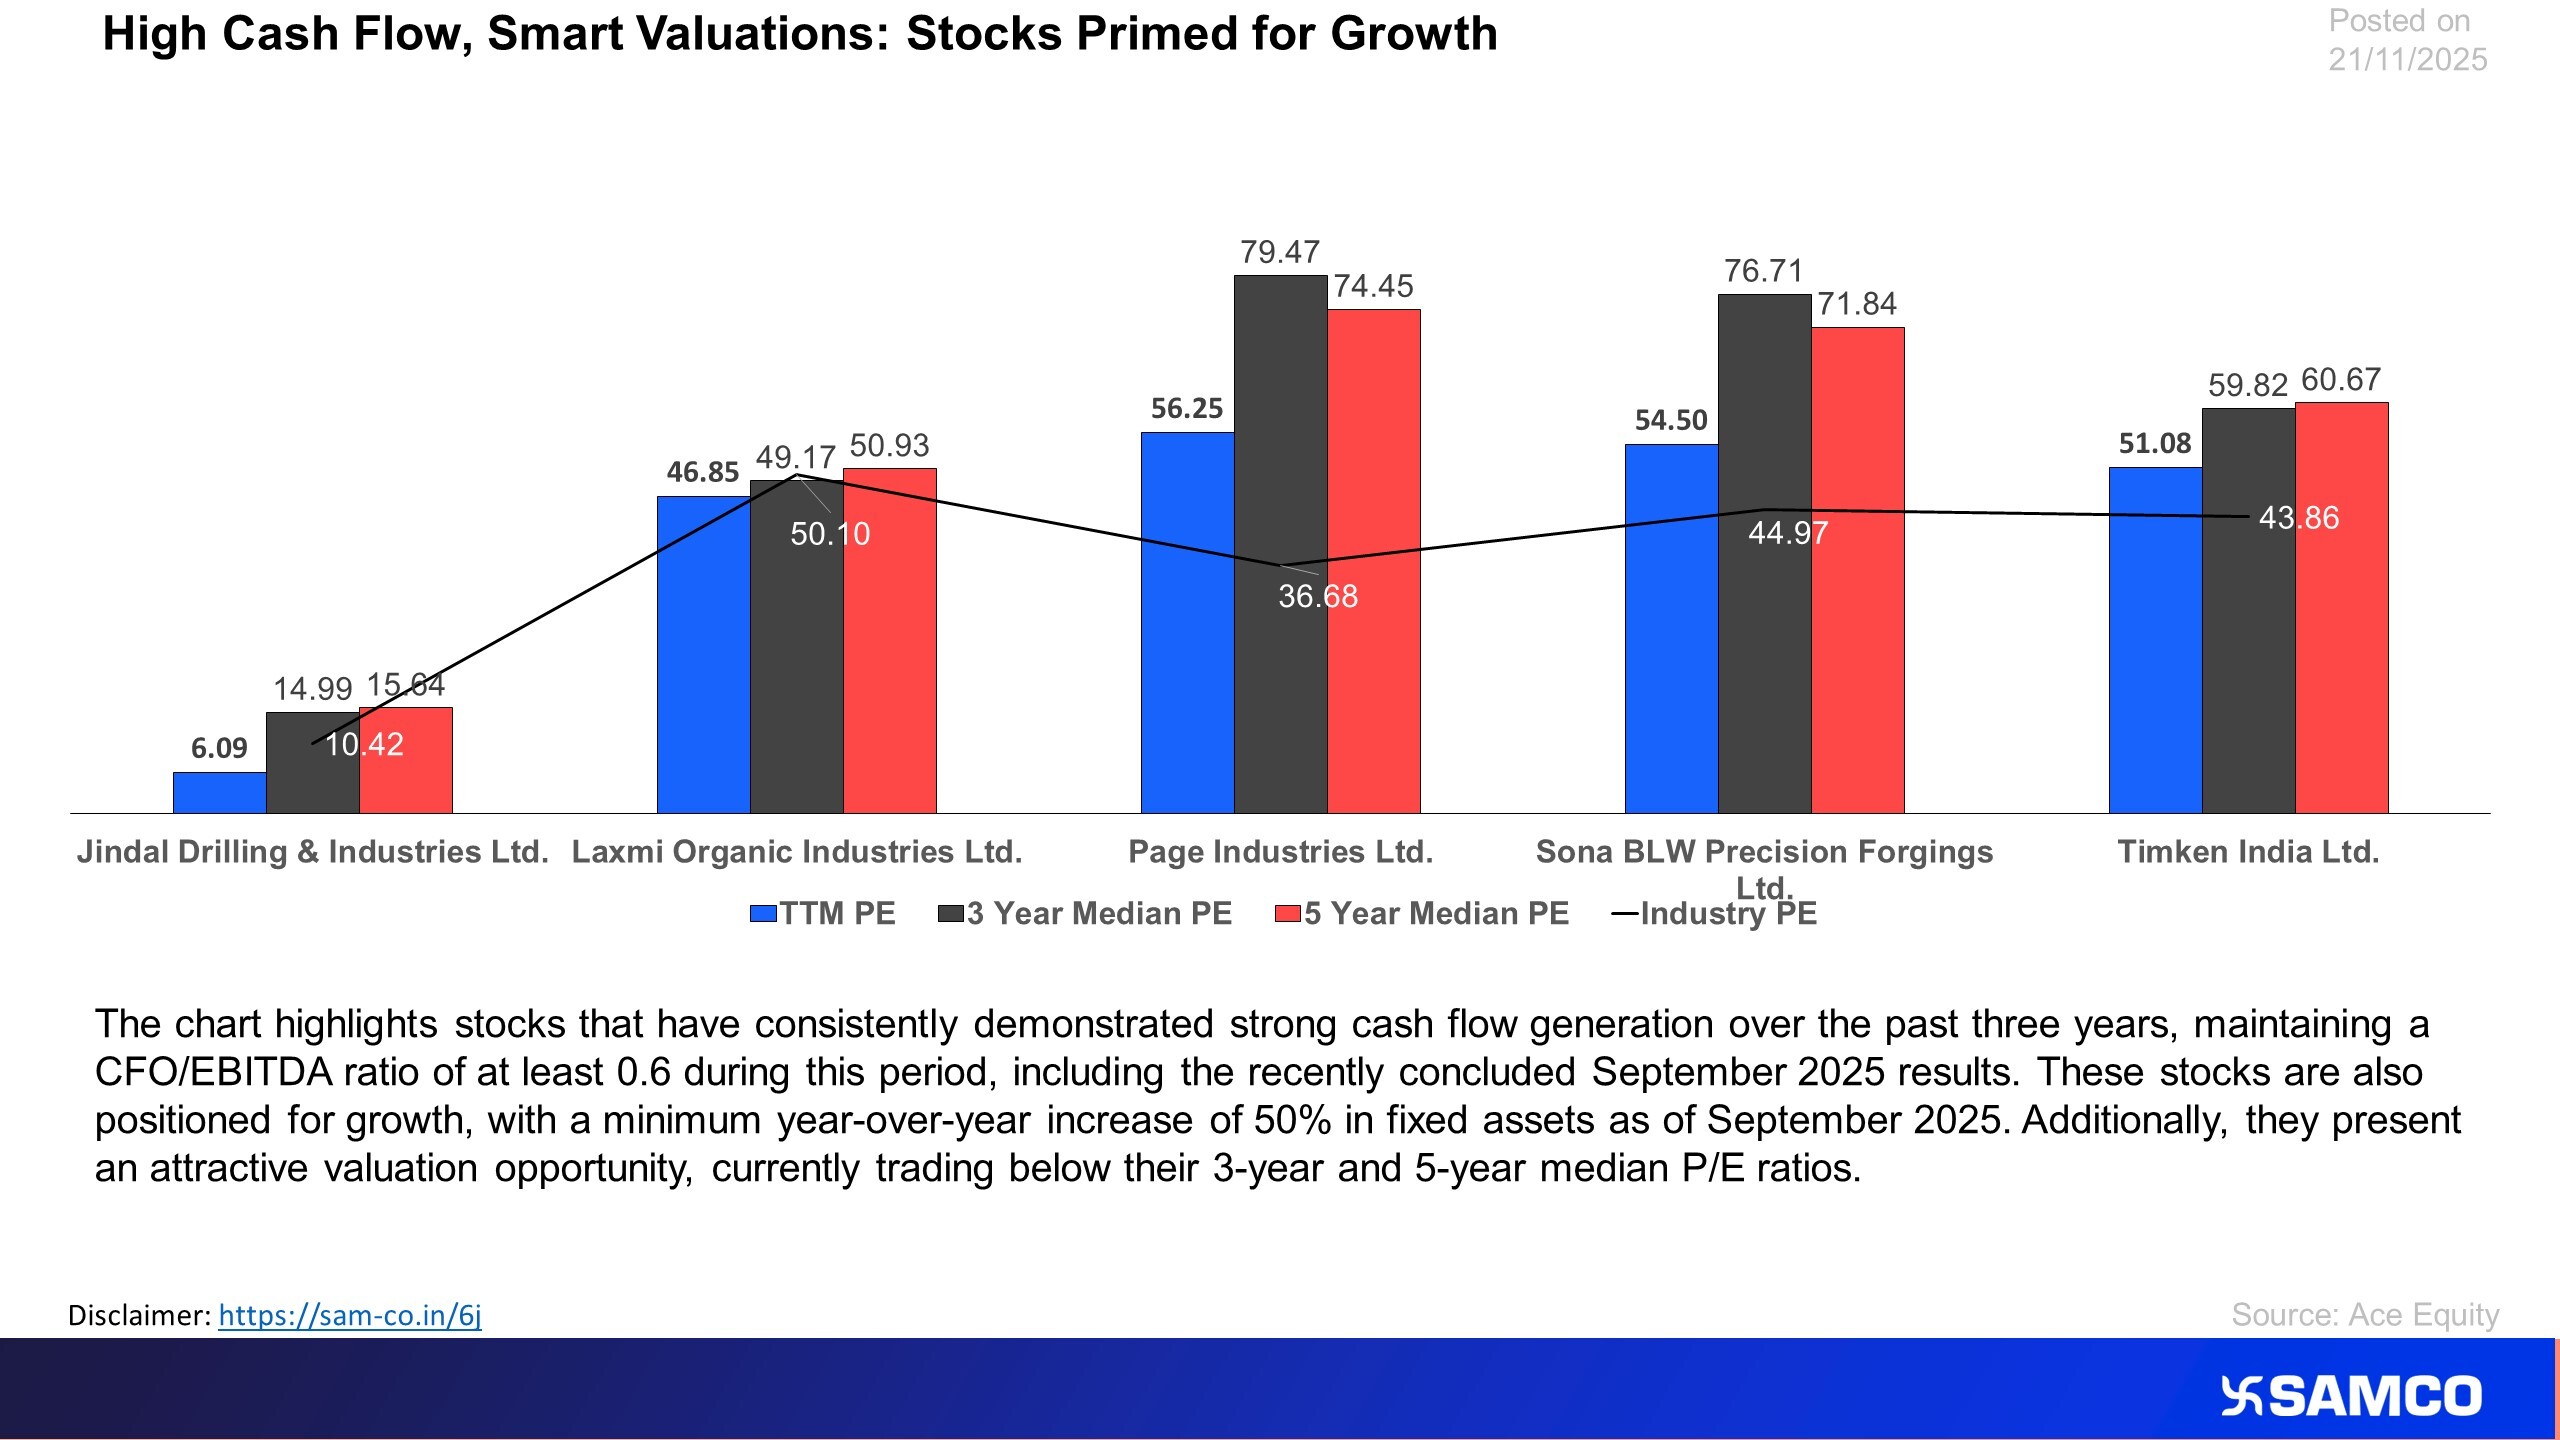
The chart lists stock witnessing growth in fixed account from internal accruals and available at reasonable valuations
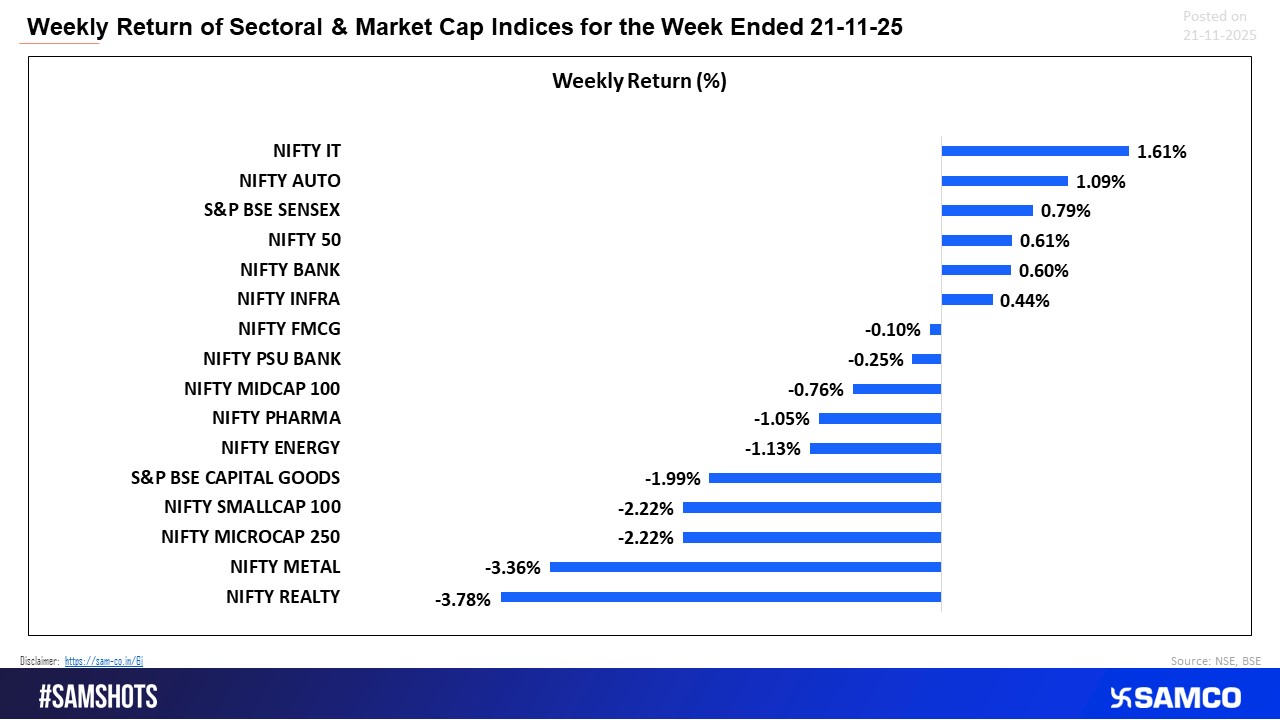
IT and Auto outperformed this week, while Realty and Metal sectors saw sharp declines.
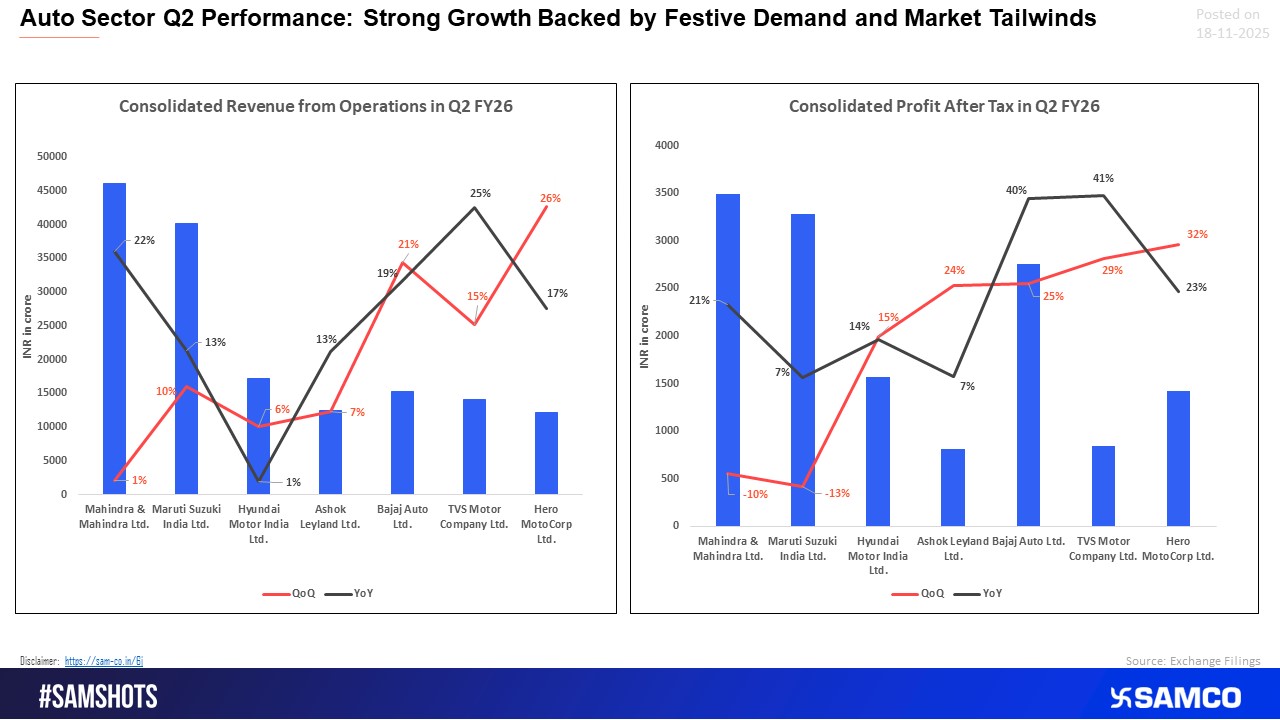
Auto sector accelerates in Q2 with strong top-line and profit gains across OEMs.
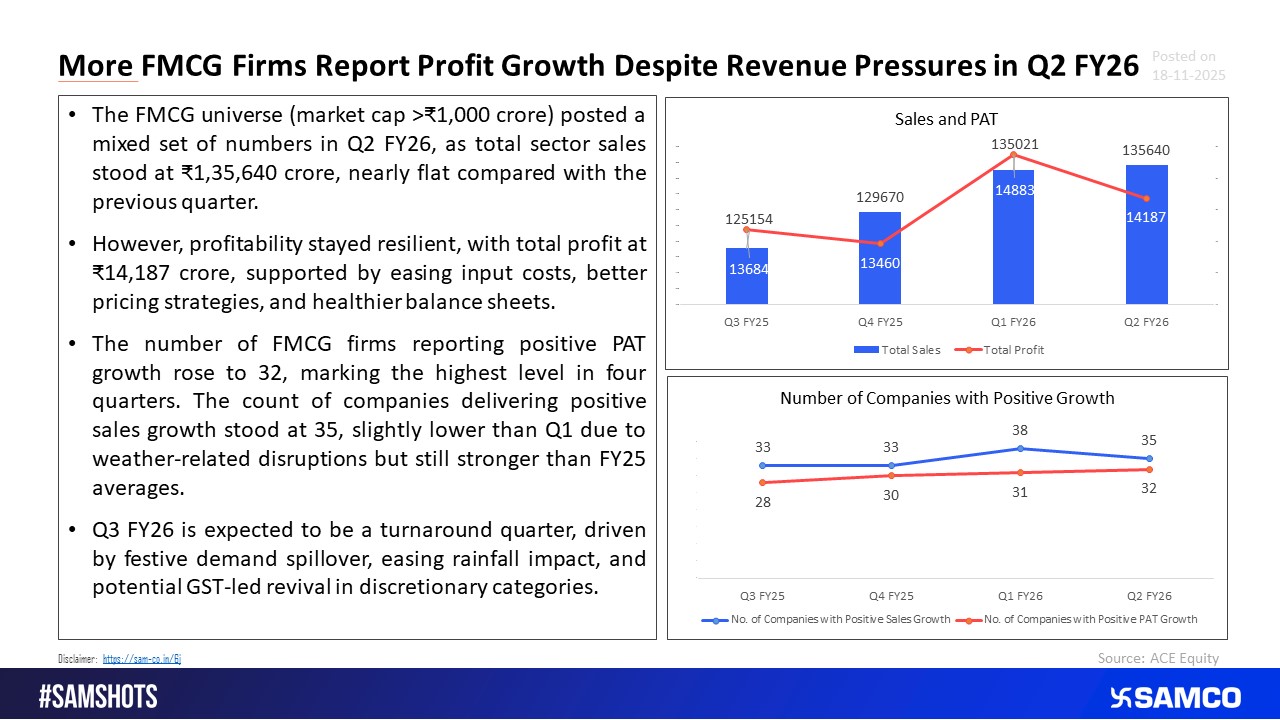
Revenues Stable but Profit Grows on Stable Raw Material Costs for FMCG Firms.
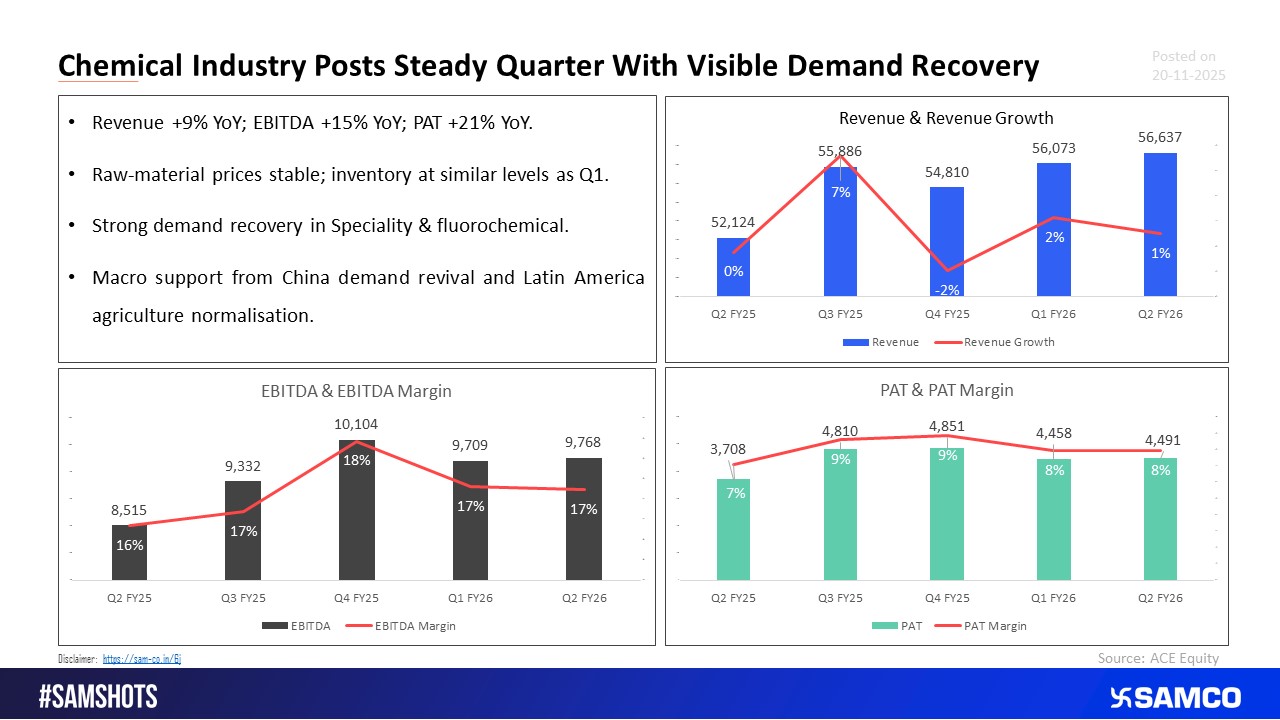
Demand Recovers across Chemical Companies with 9% Revenue Growth in Q2 FY26.
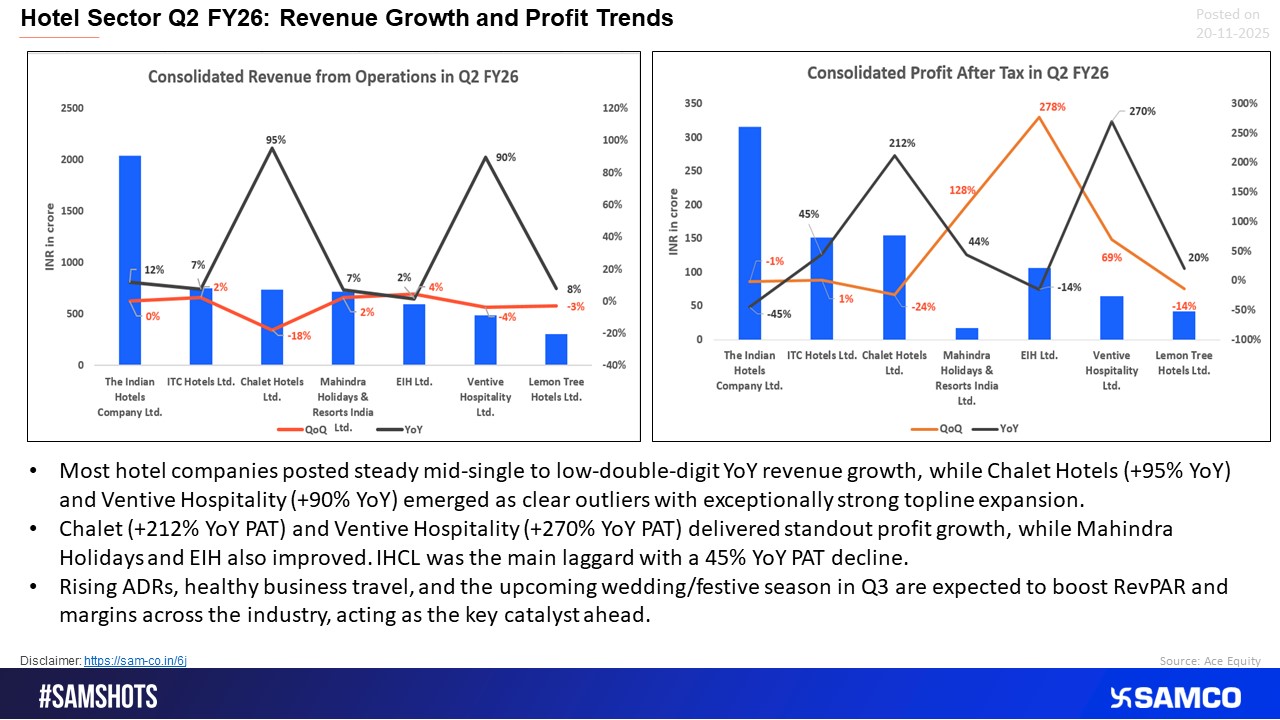
Hotel sector posts steady Q2 growth, led by strong outliers Chalet and Ventive.
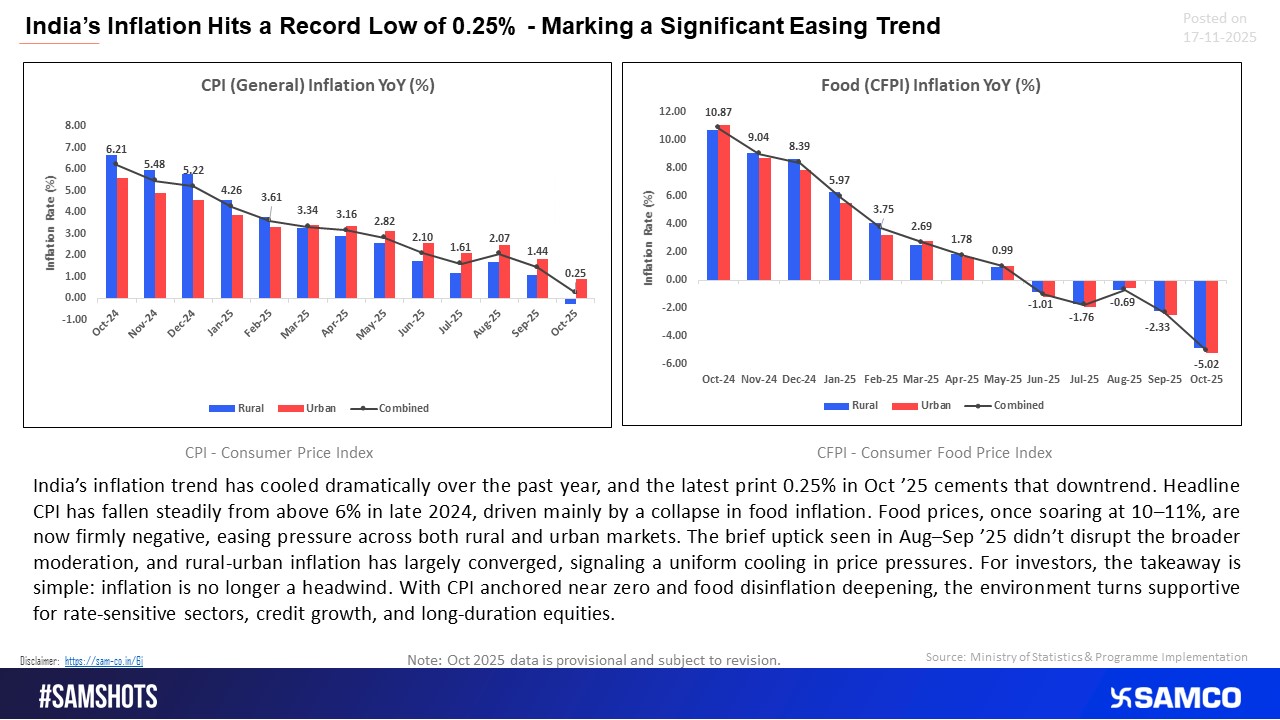
CPI cools to 0.25% as food inflation turns deeply negative.
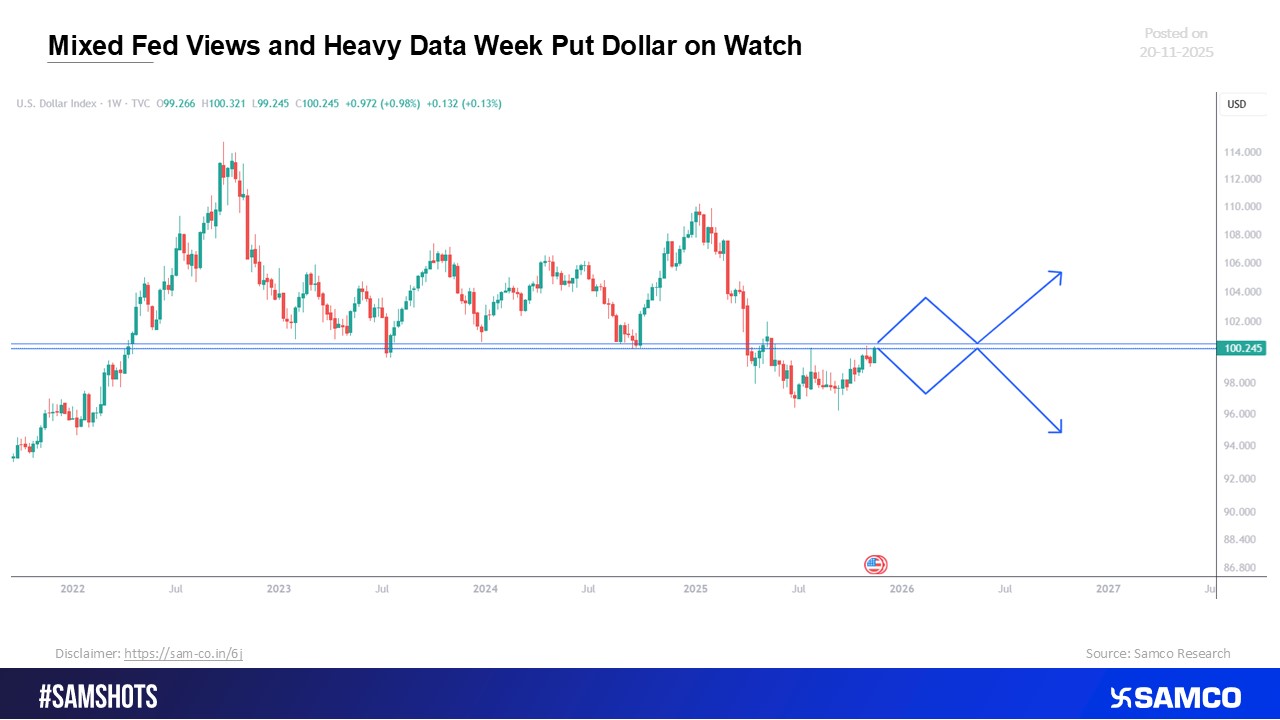
Dollar in Spotlight as Fed Opinions Diverge and Data Flow Intensifies
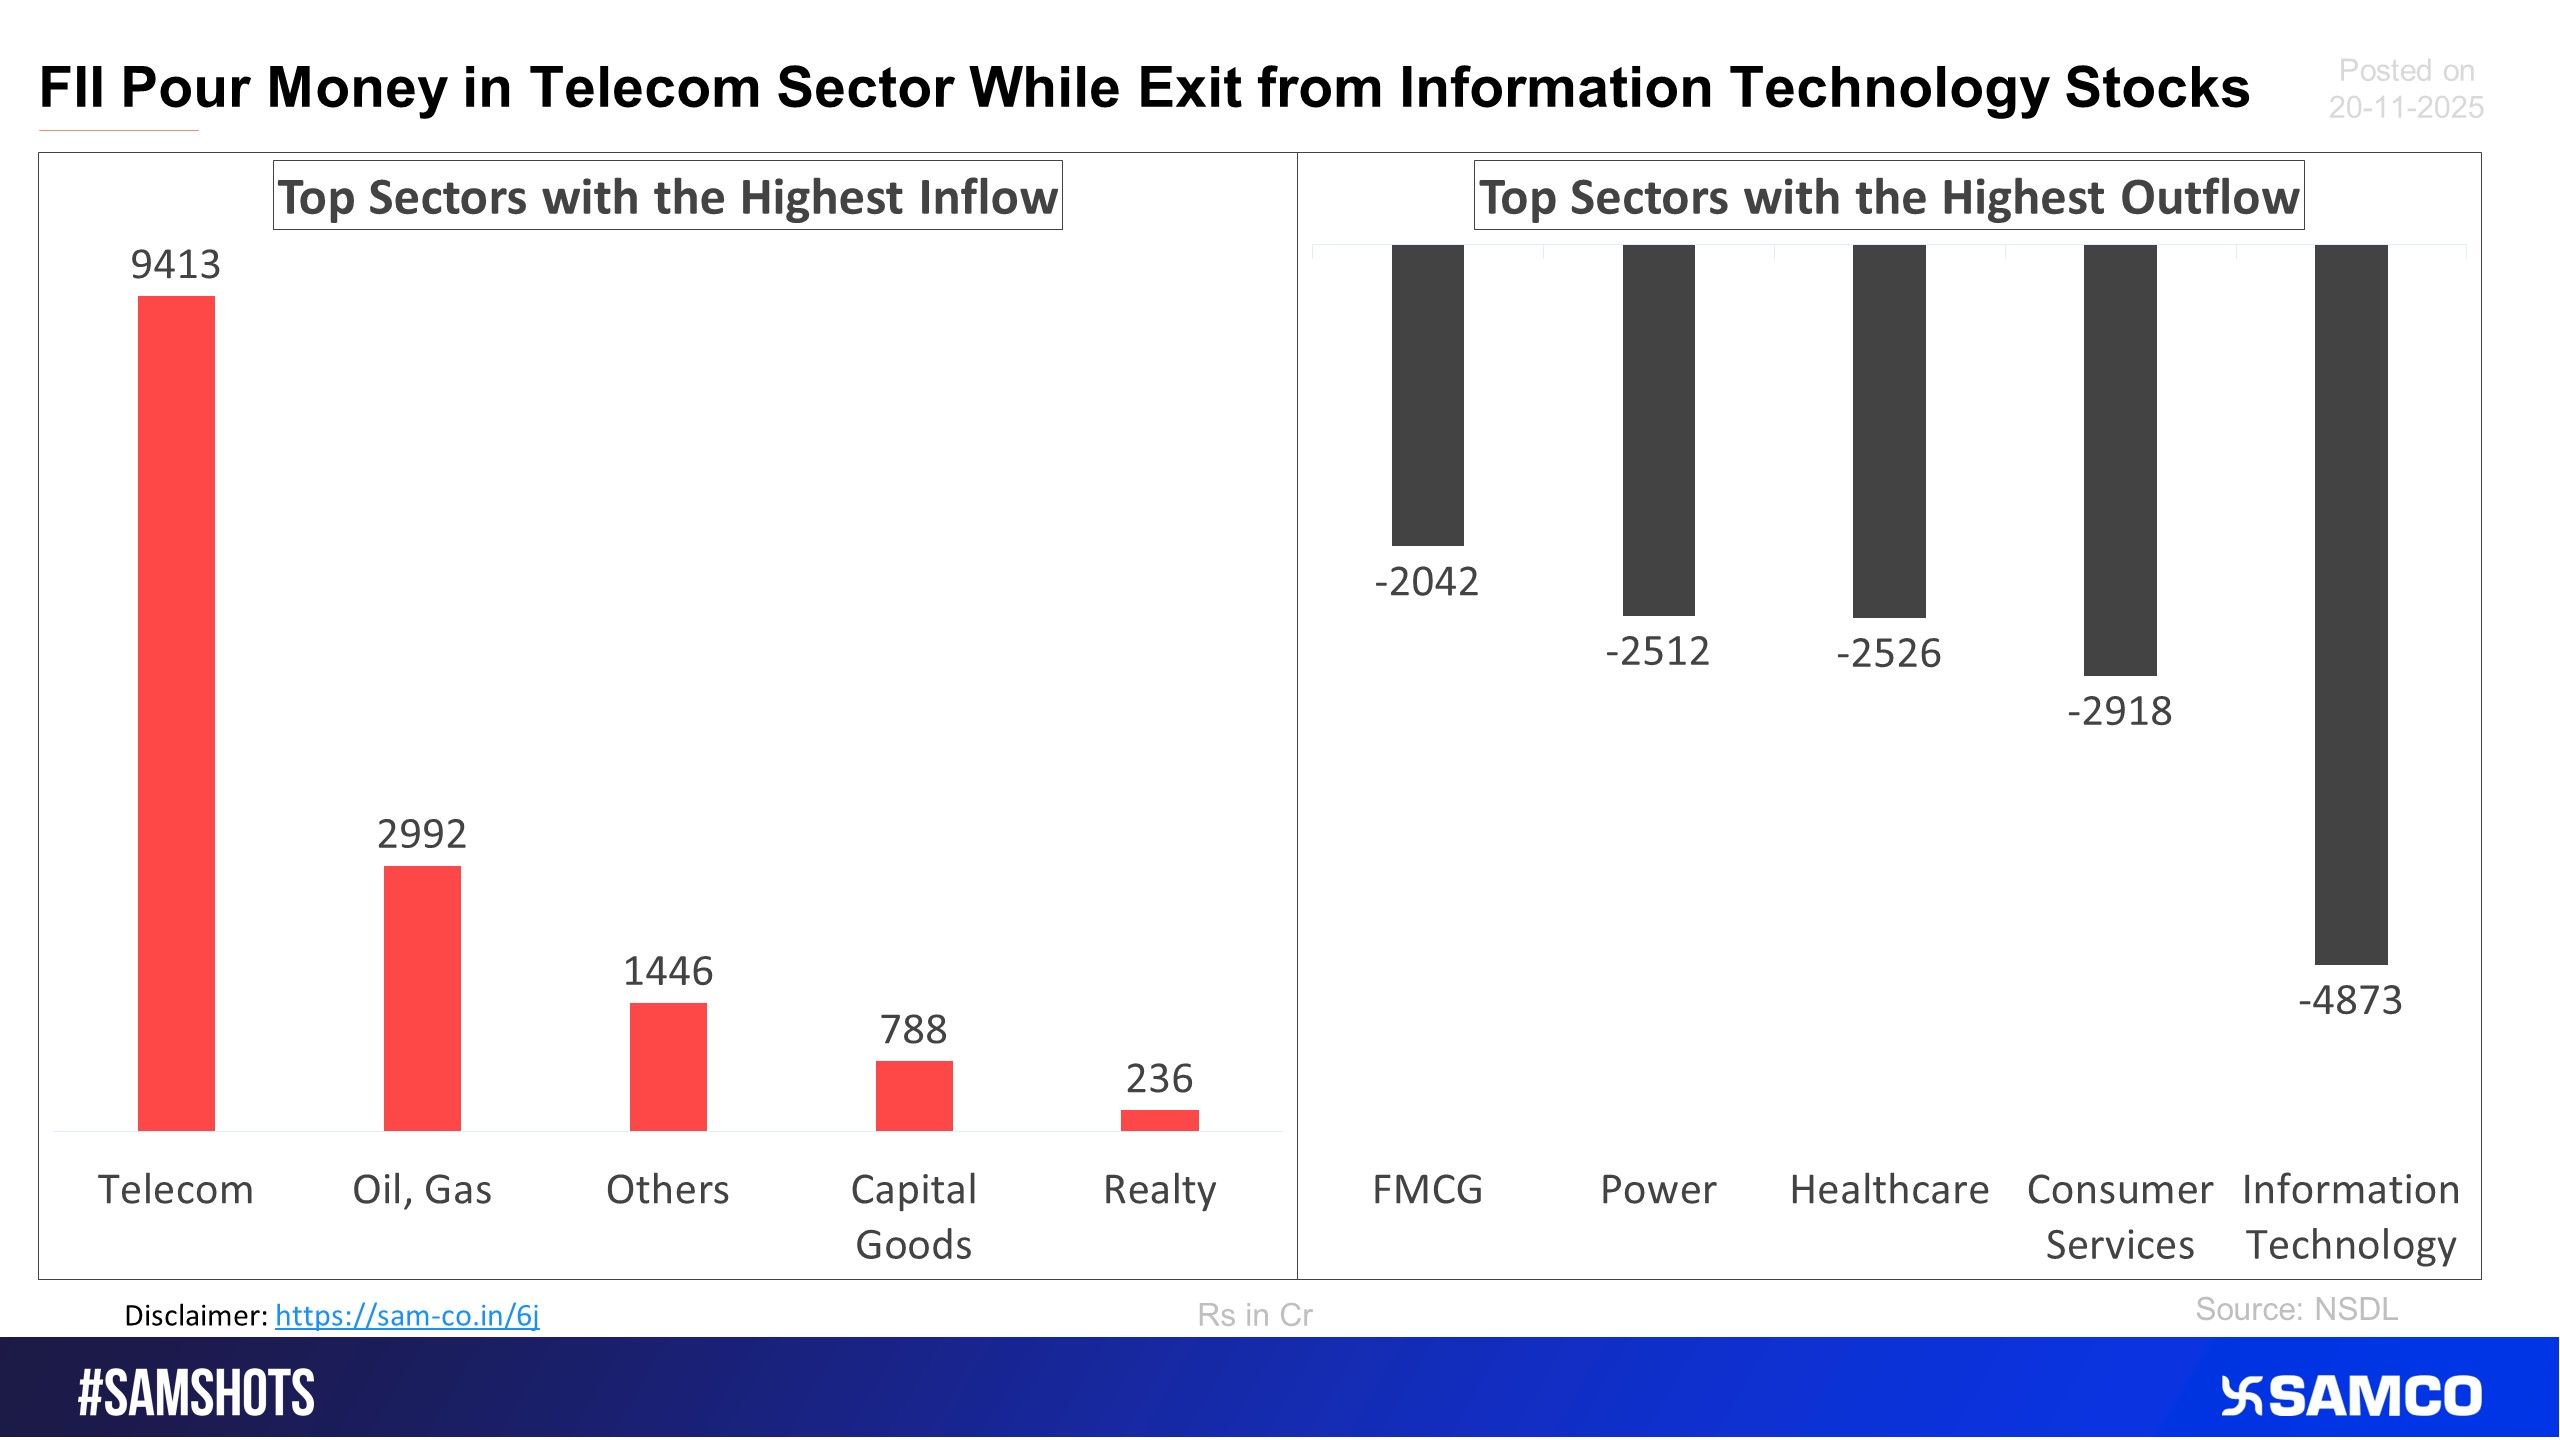
The accompanying chart shows the top 5 sectors that witnessed FPI’s highest inflow and outflow in the latest quarter.
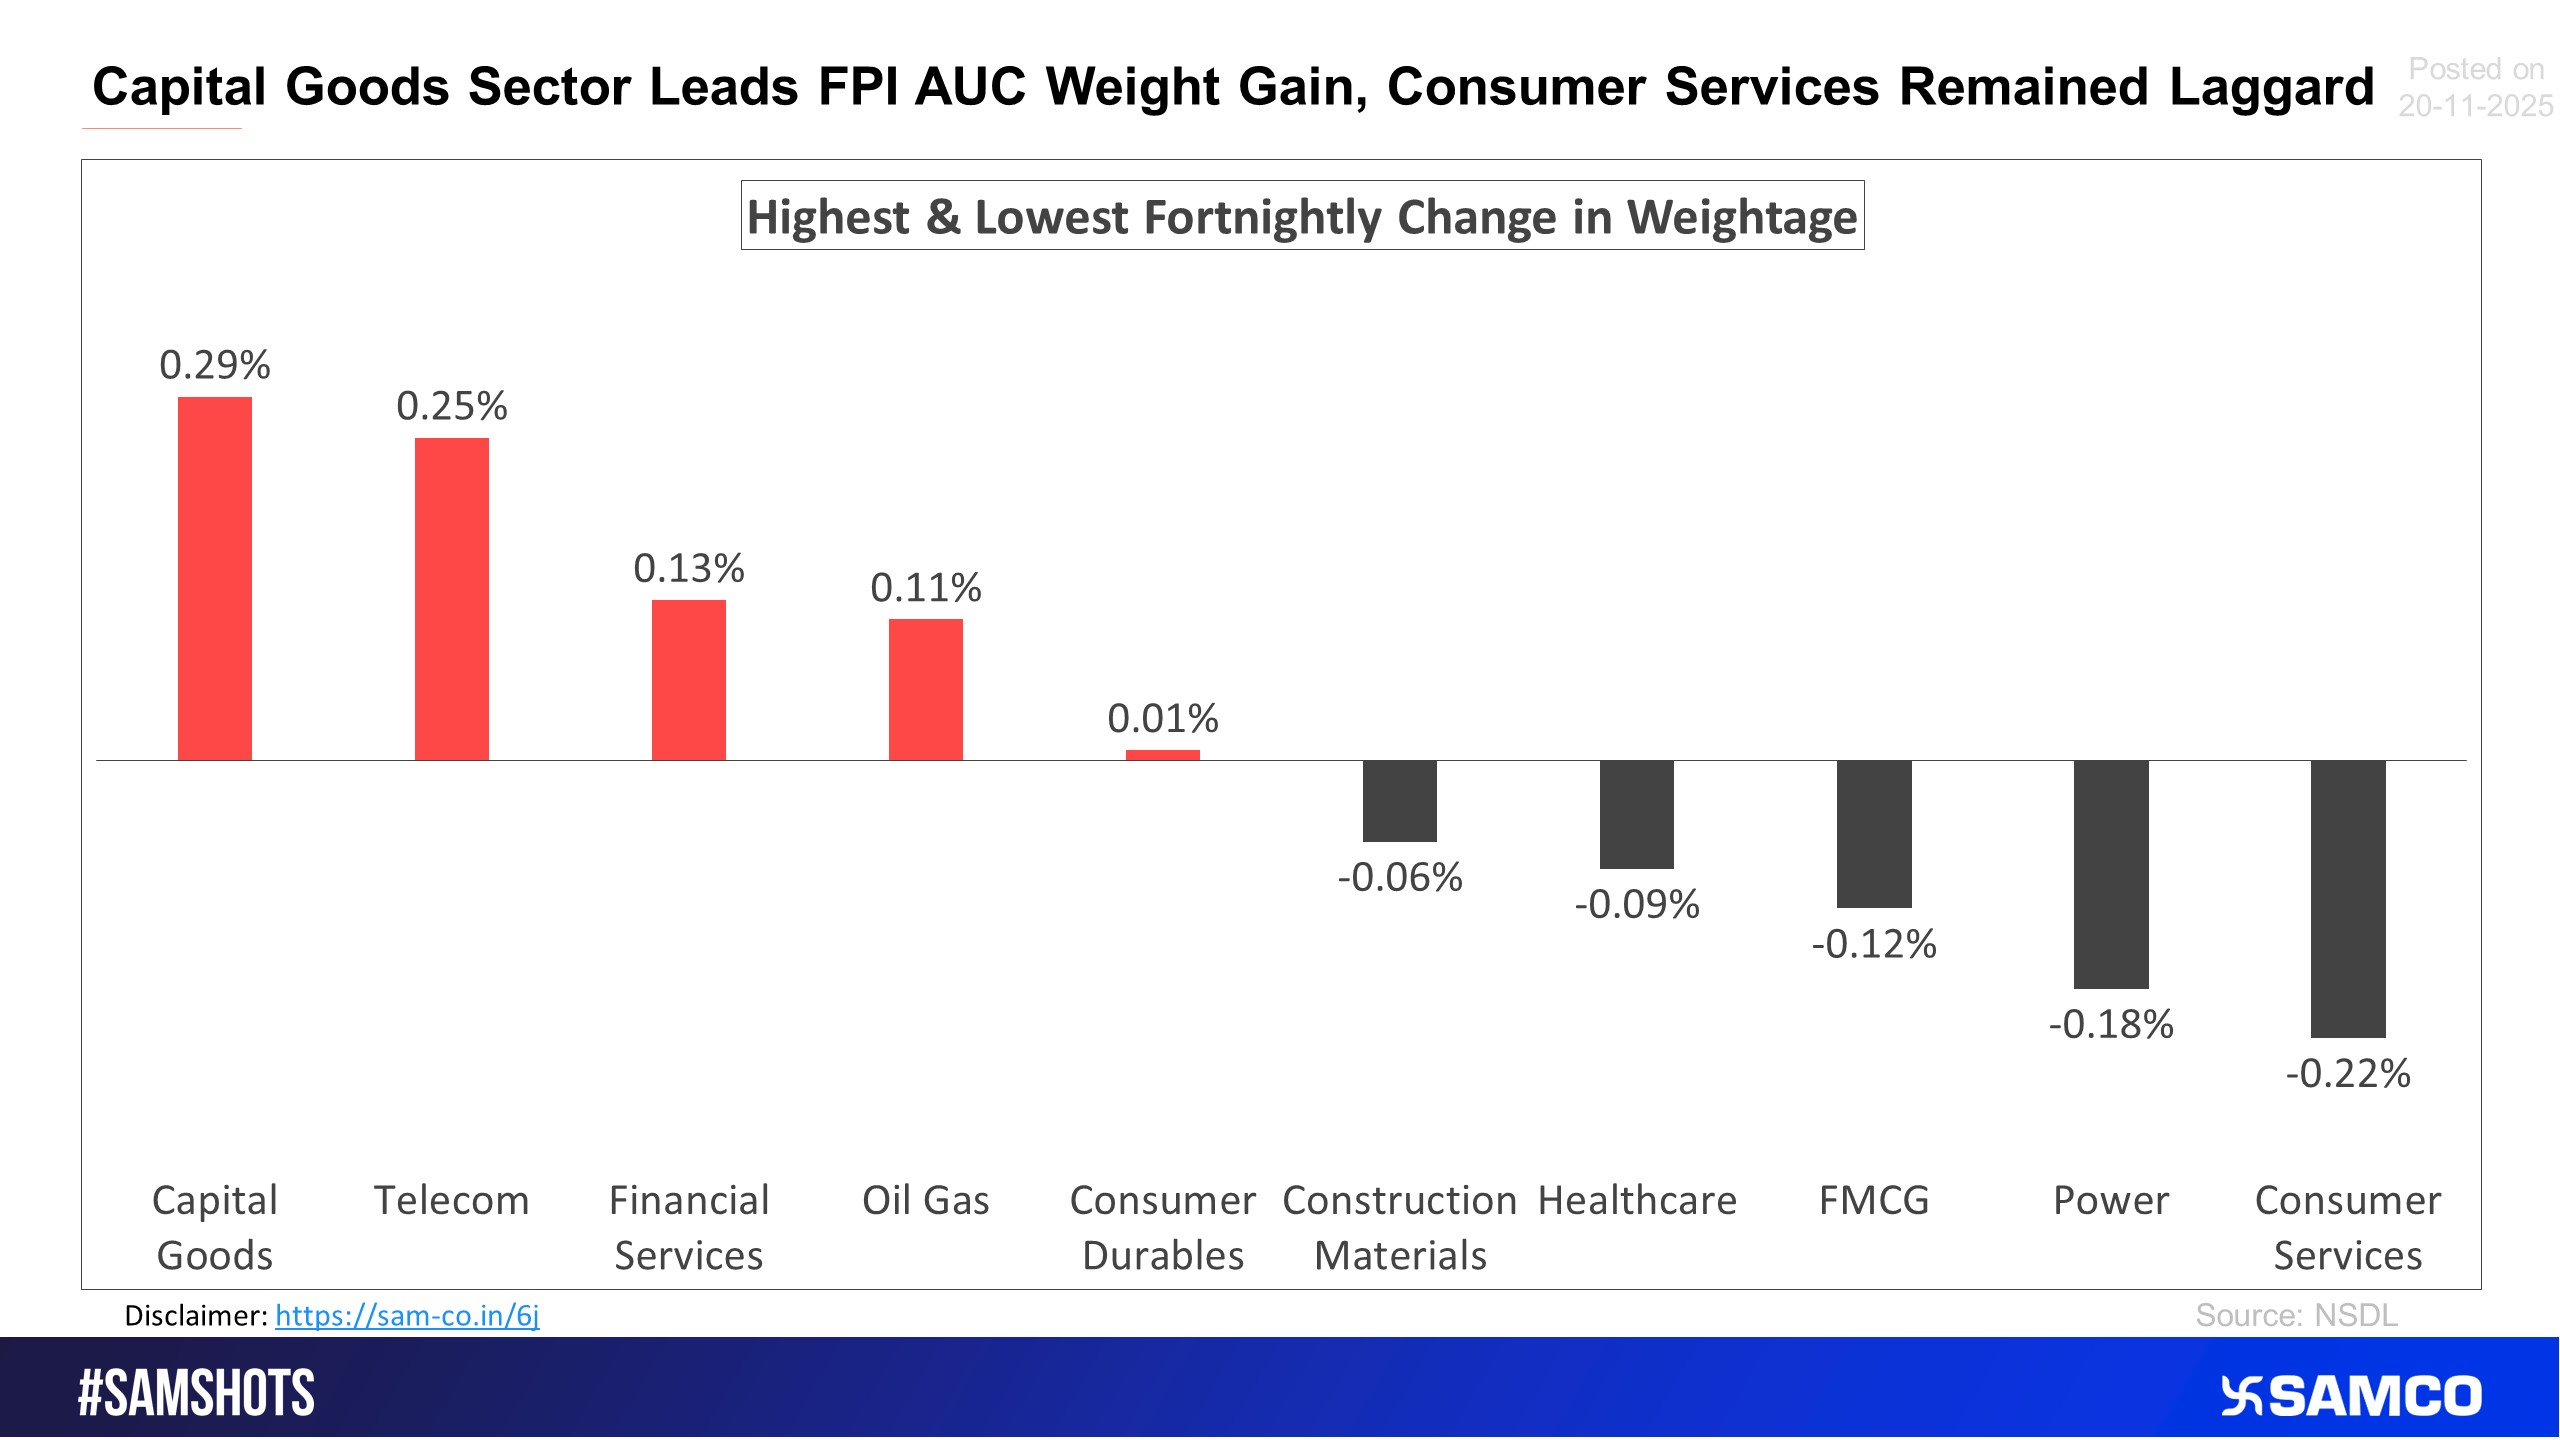
The chart below displays sectors that witnessed the highest and lowest change in the weightage of sectoral FPI holdings to the total FPI holdings compared to the previous fortnight.
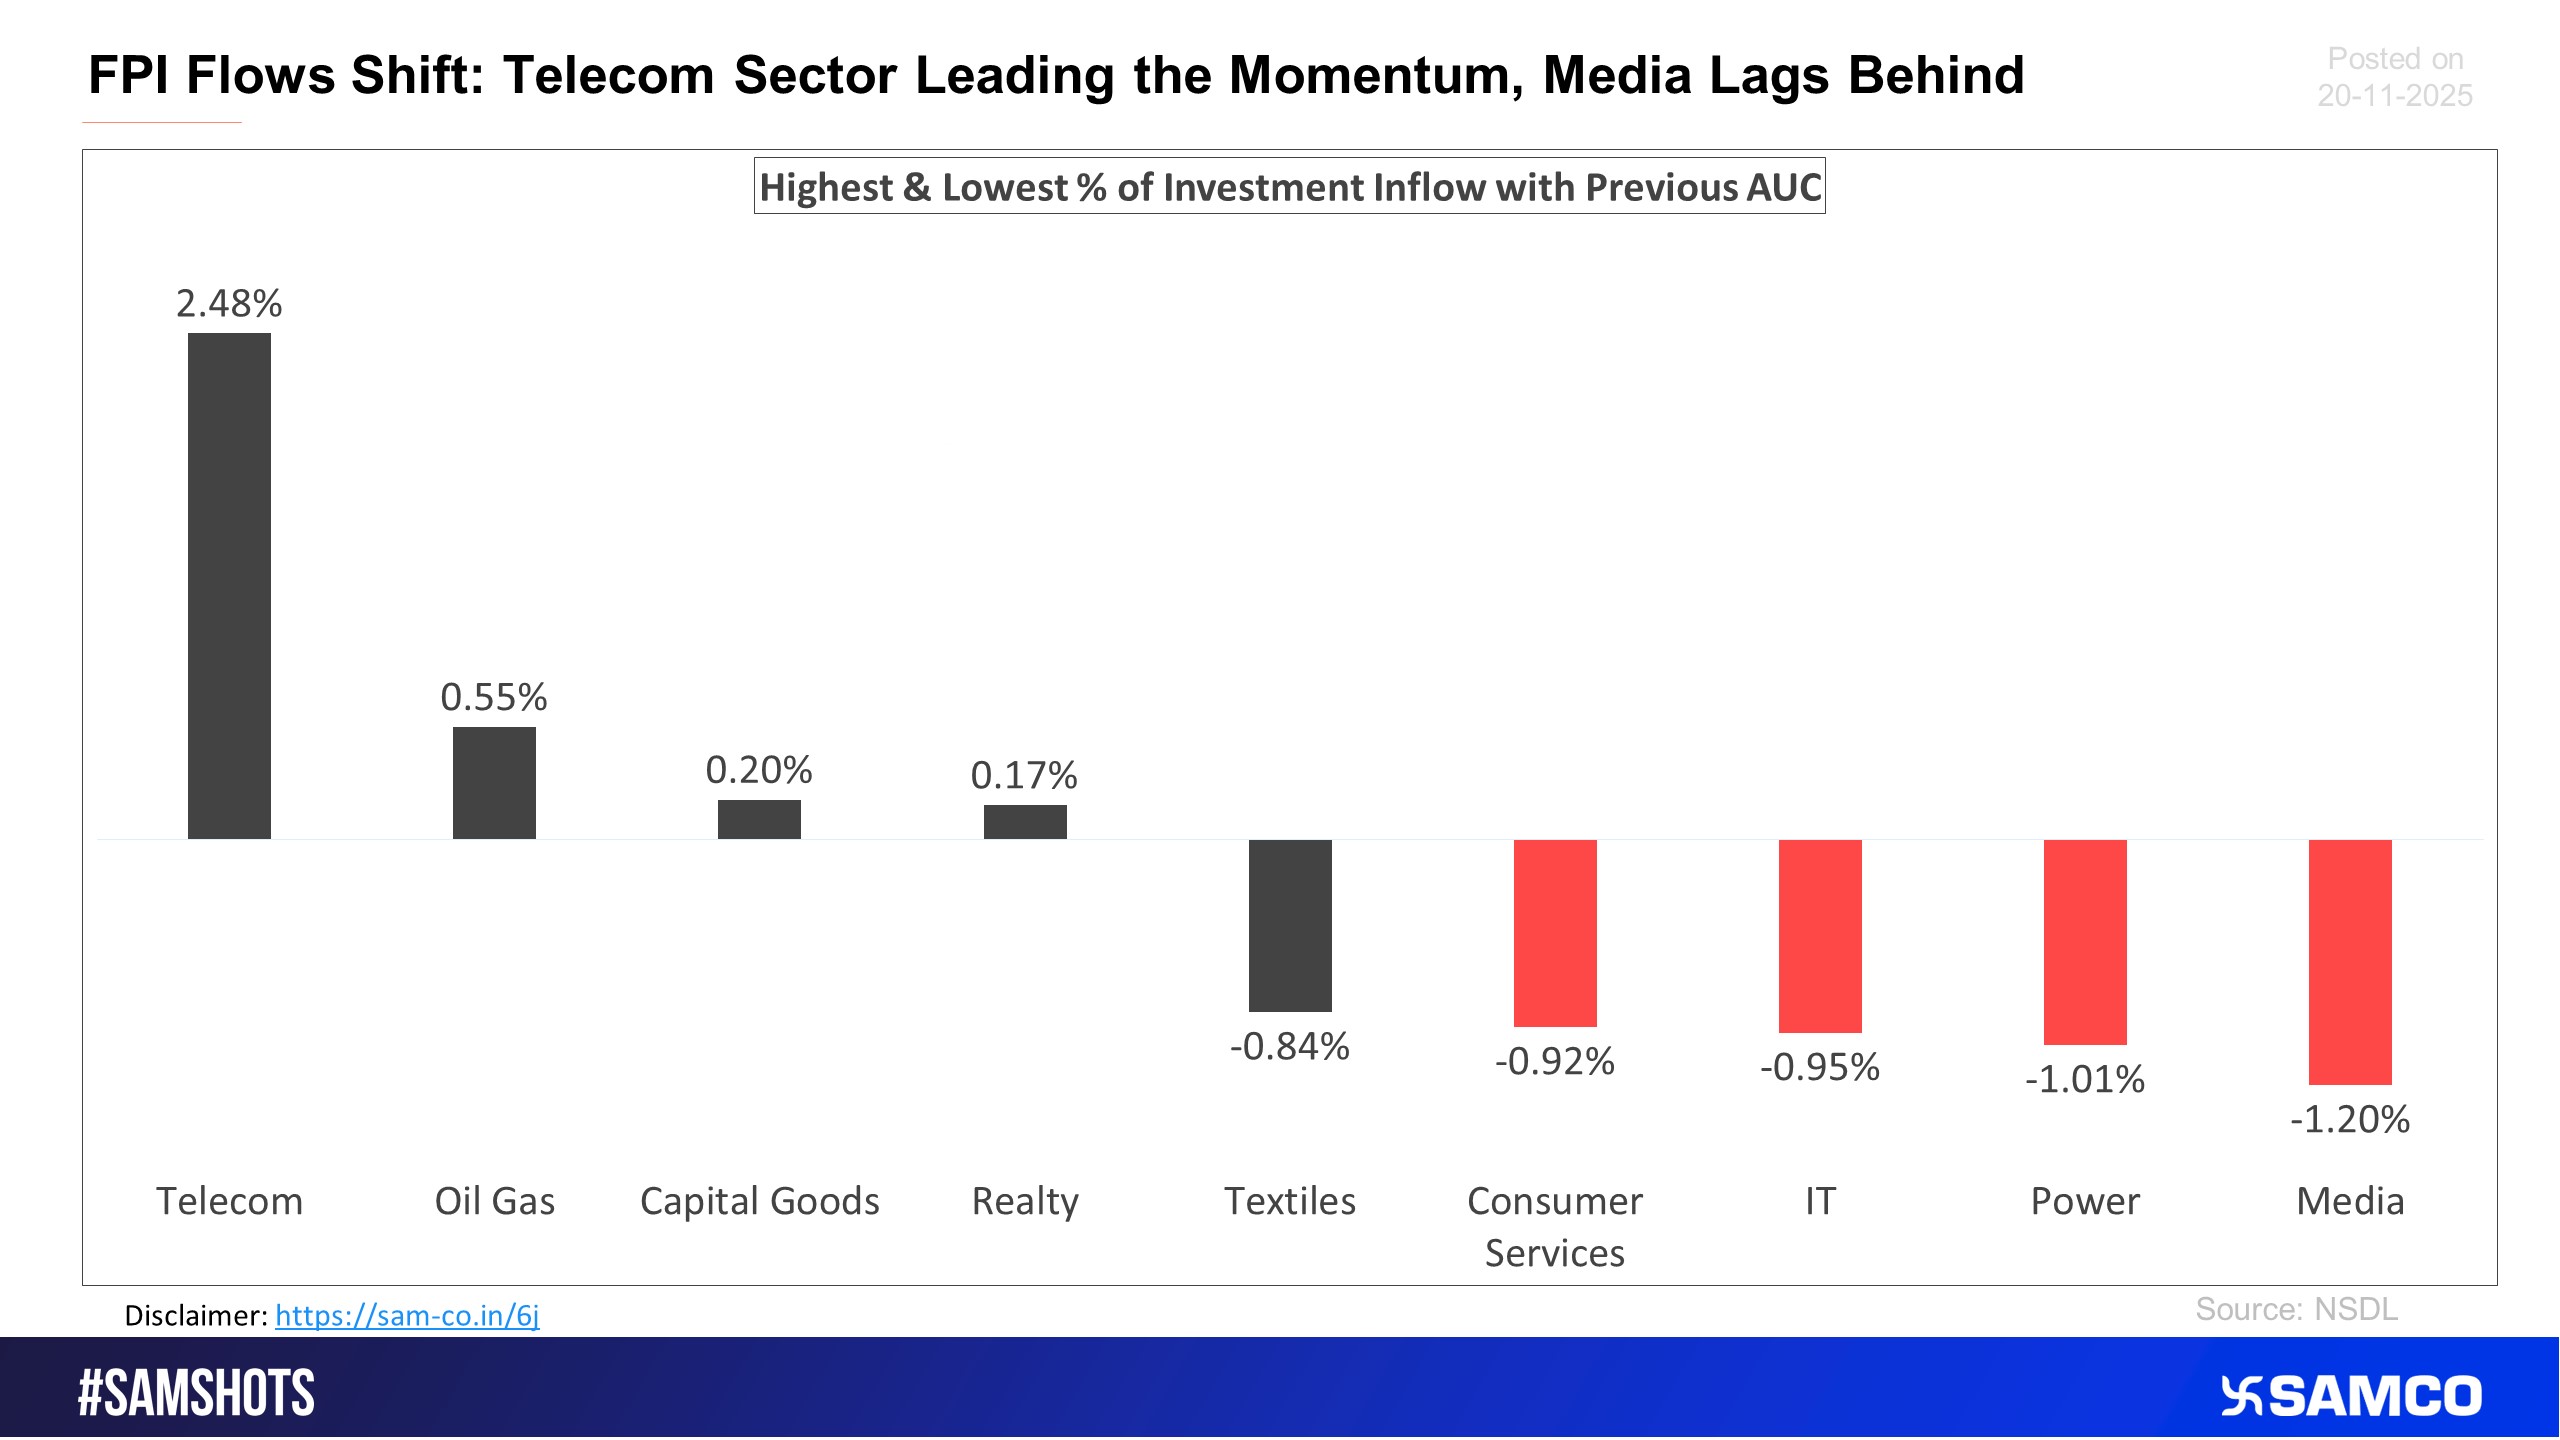
The below chart presents the highest & lowest percentage inflow of investment in the latest fortnight compared to the previous period AUC (Asset Under Custody) of FPI.
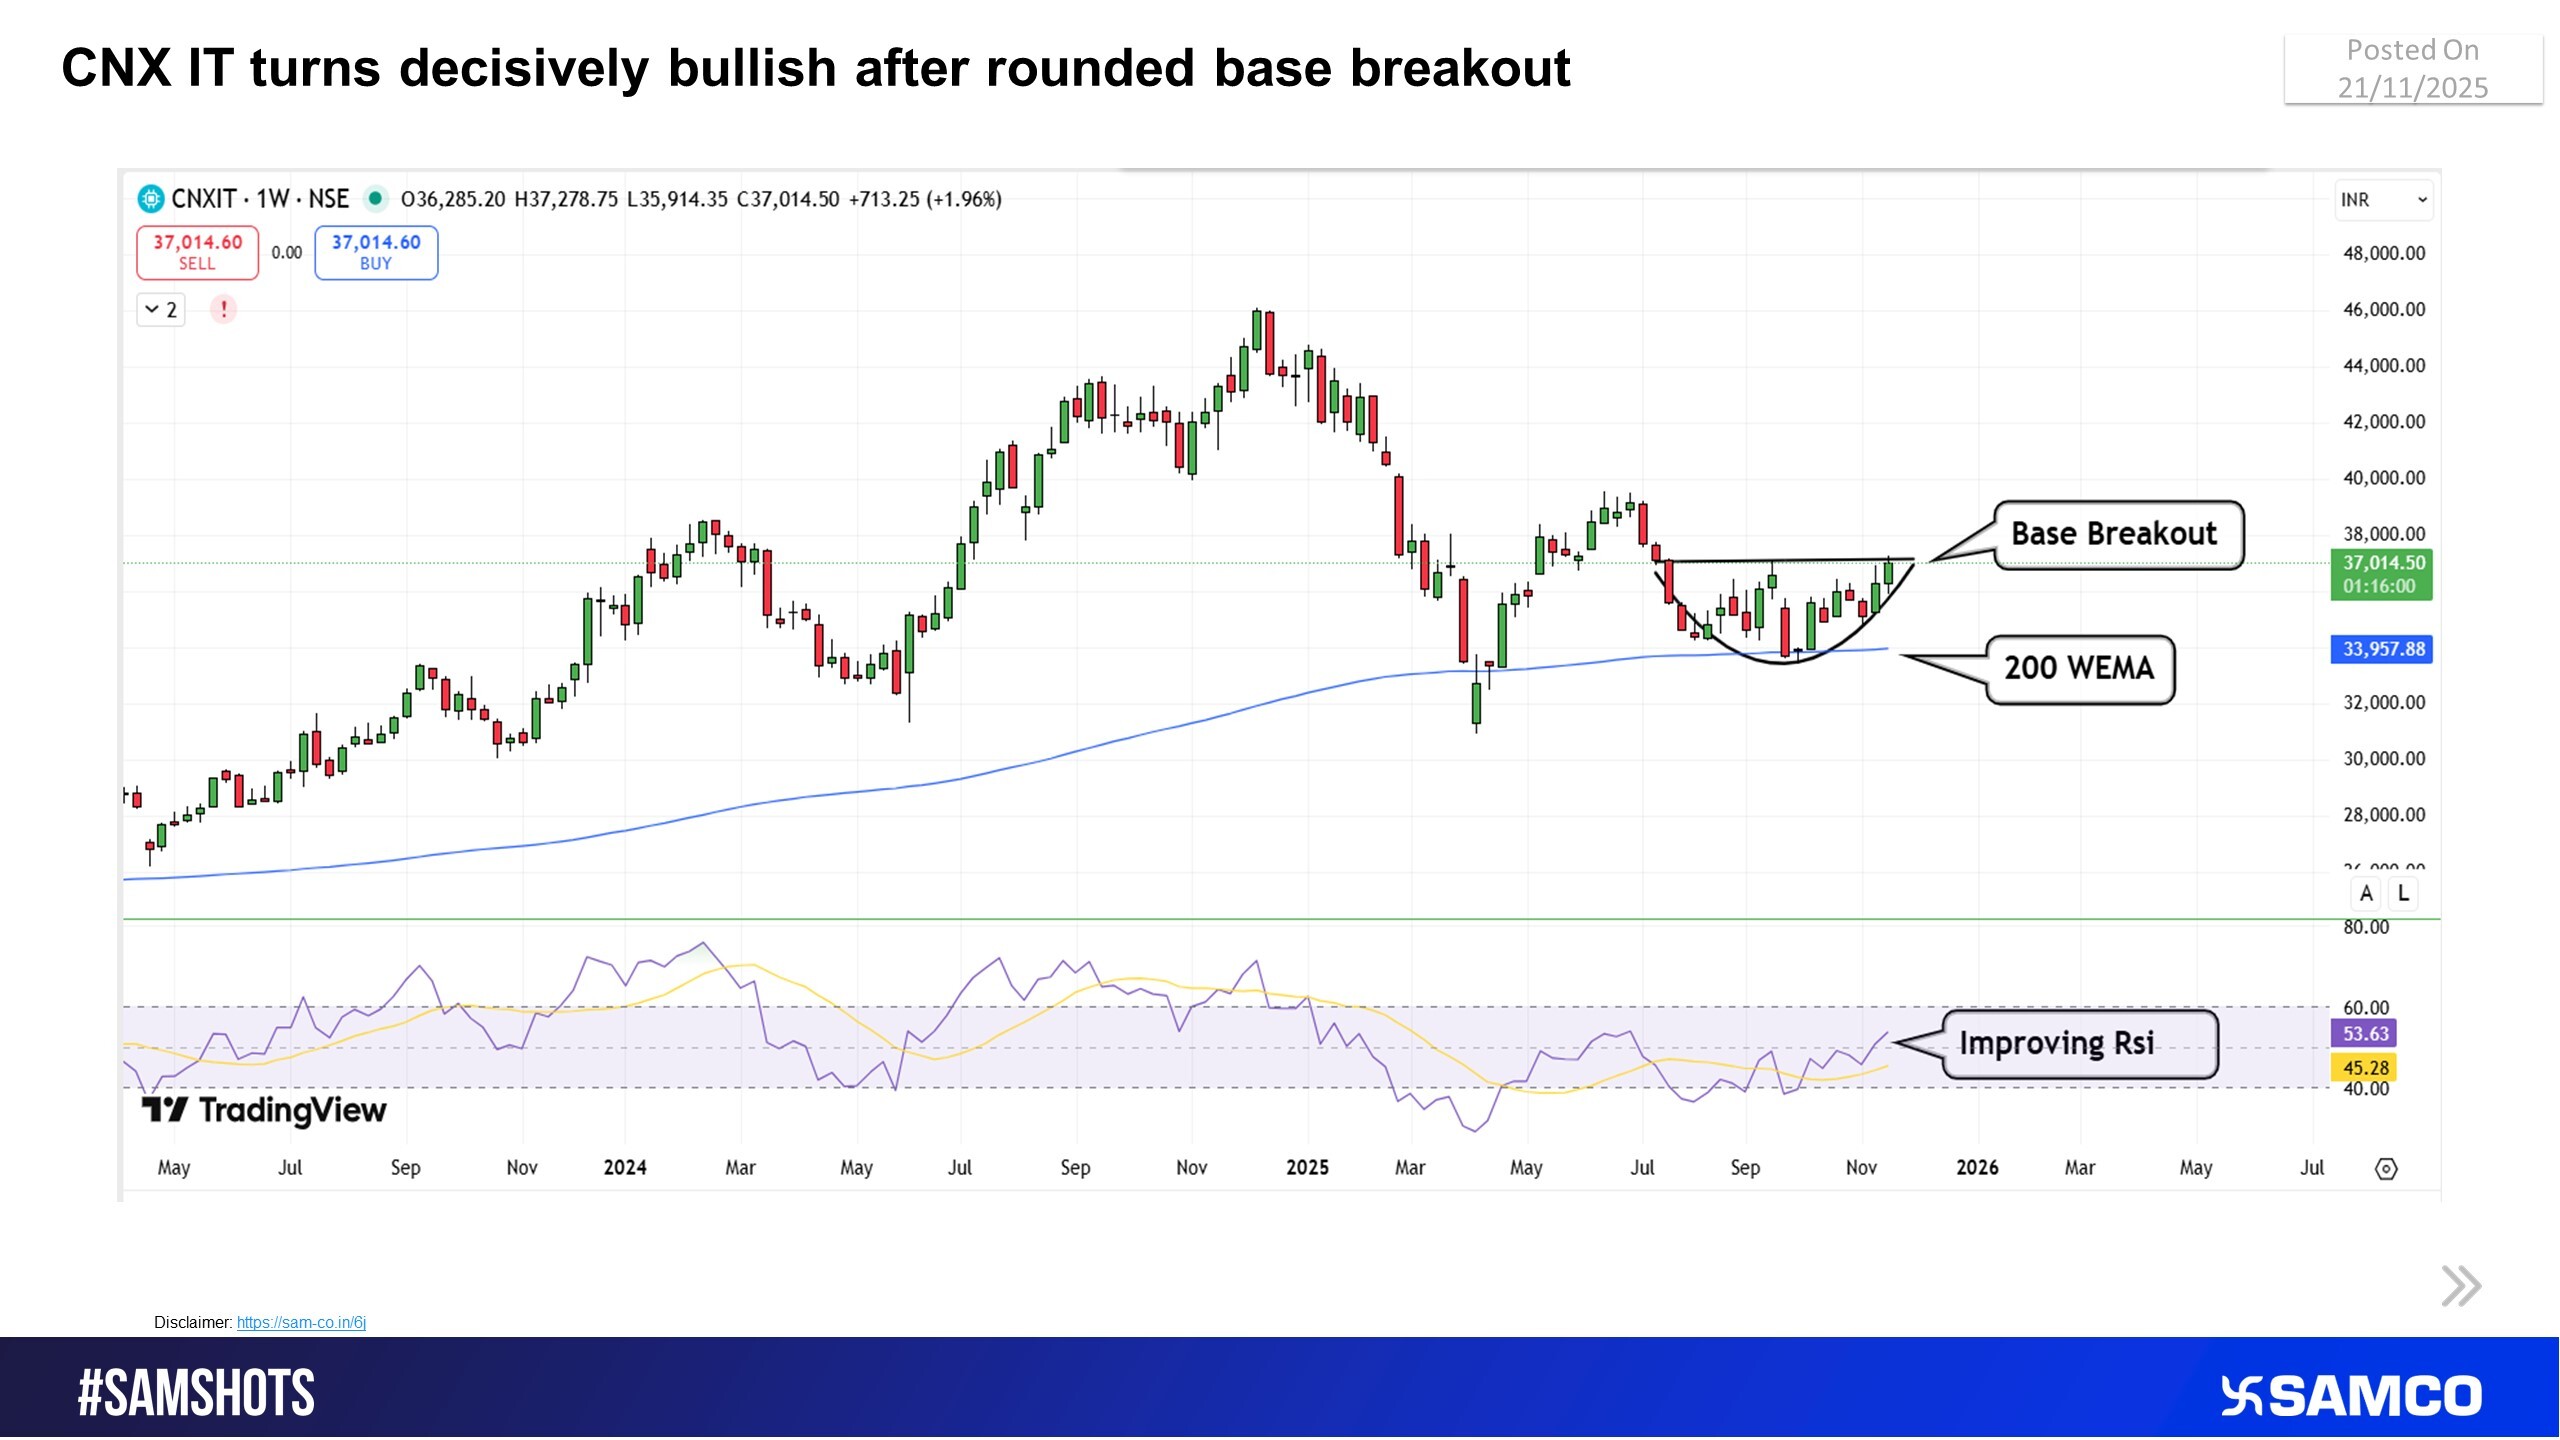
CNX IT breaks past consolidation; bullish structure firmly re-established
Source: @StatistaCharts (Statista.com)


 Easy & quick
1. Register on SCORES portal
2. Mandatory details for filling complaints on SCORES
Name | PAN | Address | Mobile | Number | E-mail ID
3. Benefits
Effective Communication
Speedy redressal of the grievances
