The Nifty 50 witnessed a highly volatile trading week ending 12 December 2025. The index opened at approximately 26,159 and initially declined by nearly 1.78%, driven by uncertainty surrounding the India–USA tariff policy and its potential implications for trade-sensitive sectors. Market sentiment, however, improved mid-week as clarity emerged on the bilateral tariff framework, signalling a more constructive stance from both countries.
A key catalyst for recovery came from the U.S. Federal Reserve’s dovish commentary and its decision to cut rates, which boosted global risk appetite and lifted investor confidence across emerging markets, including India. As a result, the Nifty 50 rebounded sharply from its lows and recovered around 1.8%, eventually closing near 26,175—almost unchanged for the week despite the initial slide.
Additionally, Mexico’s tariff imposition had minimal impact on domestic equities, indicating strong underlying market resilience and sectoral insulation. Overall, despite global trade-related jitters, the Nifty showcased stability, supported by improving macro sentiment, foreign inflows, and strength in large-cap counters.
Scroll down to understand more of such market news and perspectives for the week gone by in easily understandable charts.
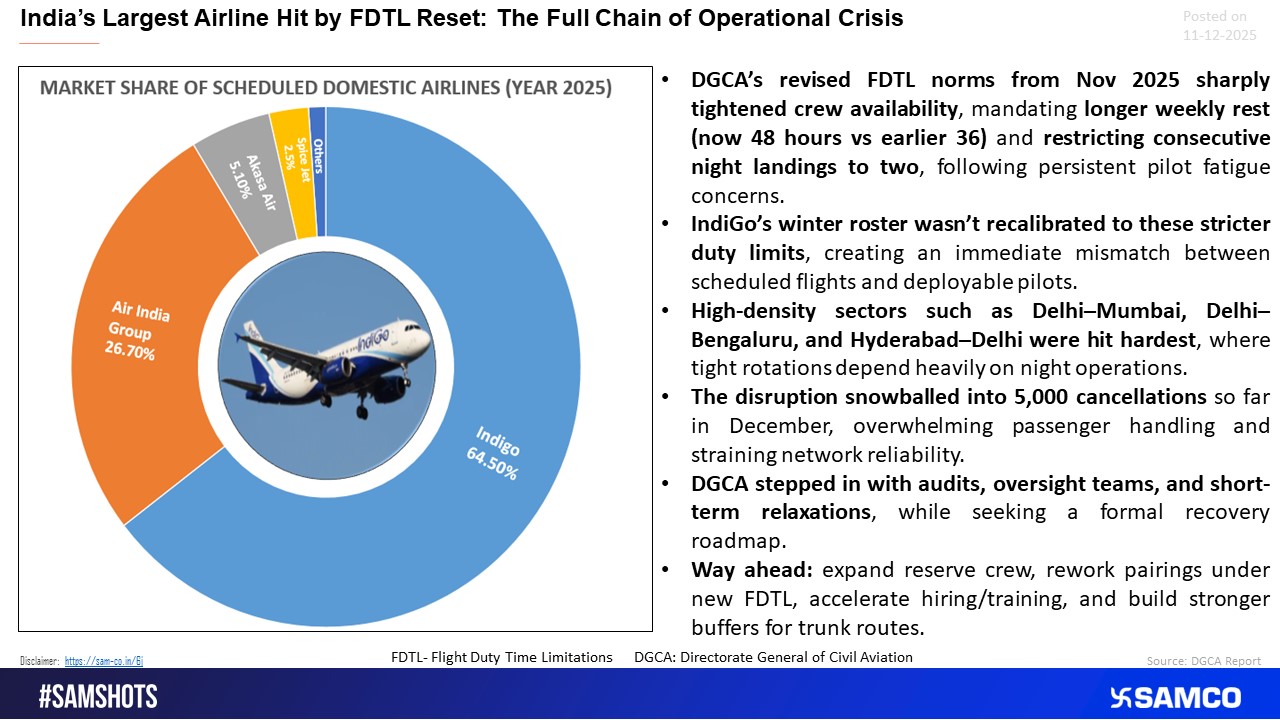
IndiGo faced major disruptions after DGCA sharply tightened FDTL norms.


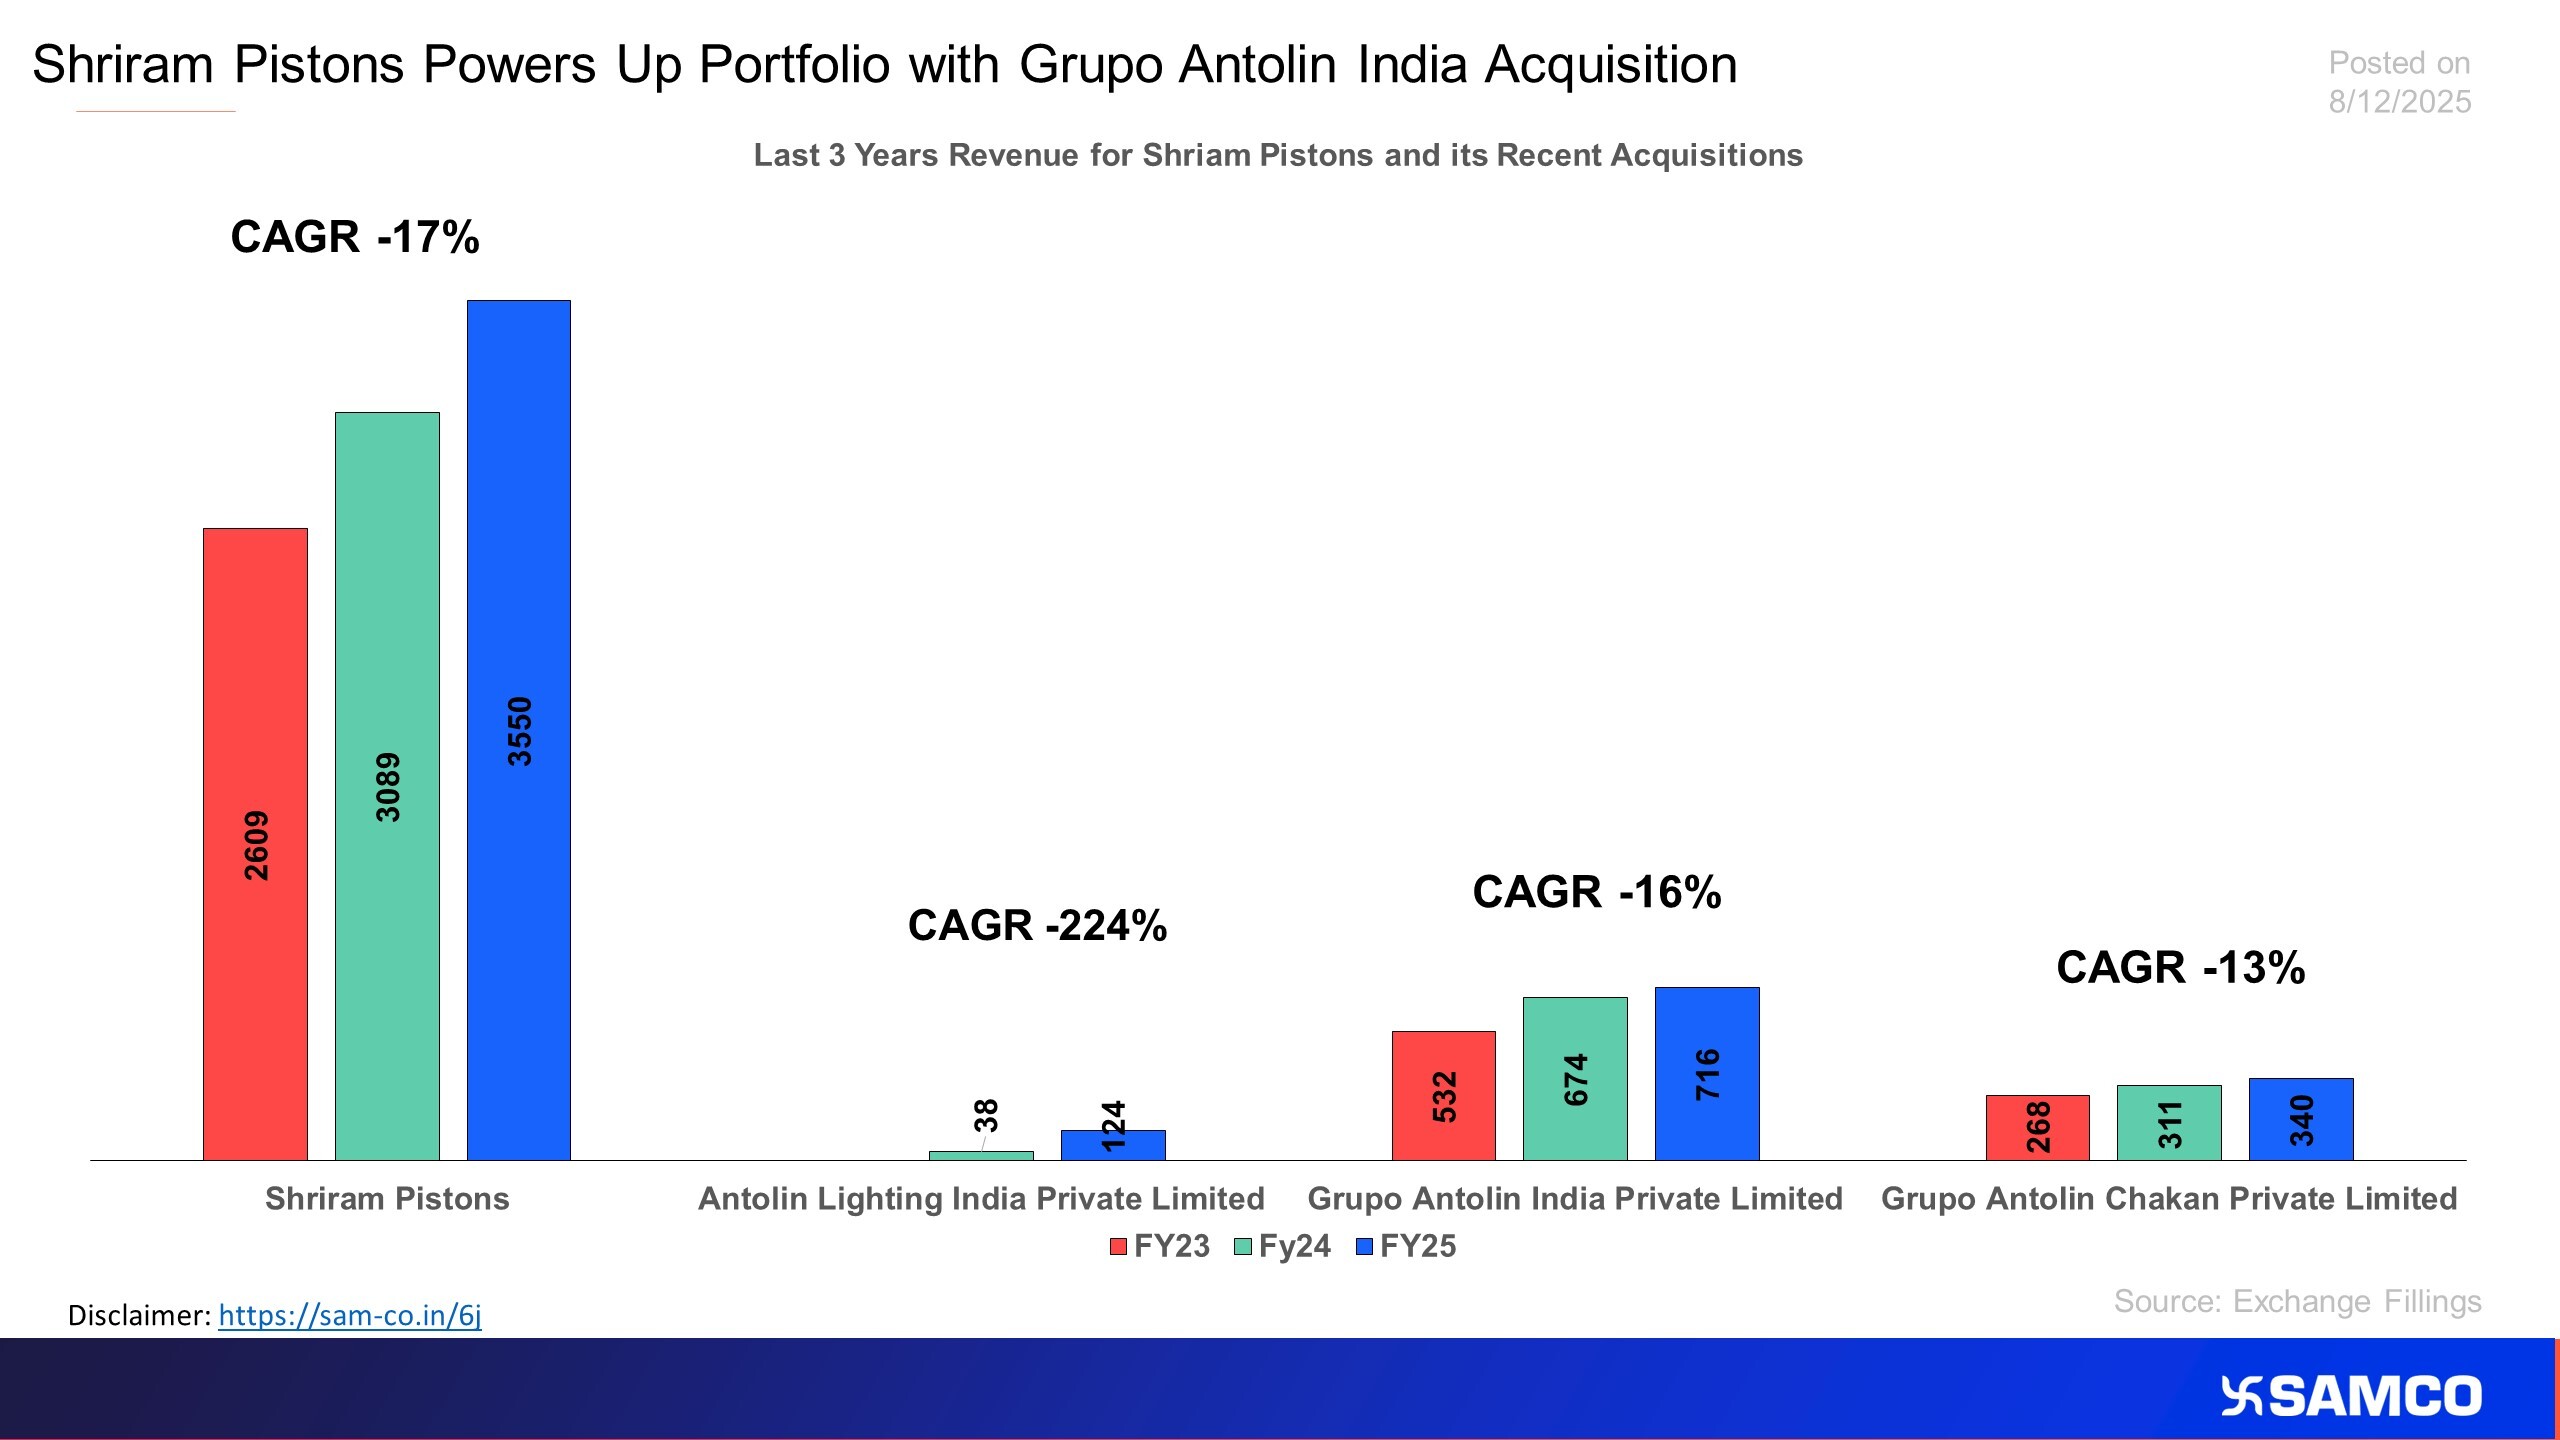
The chart analyse the potential impact of Antolin Group Companies Acquisition by Shriram Pistons
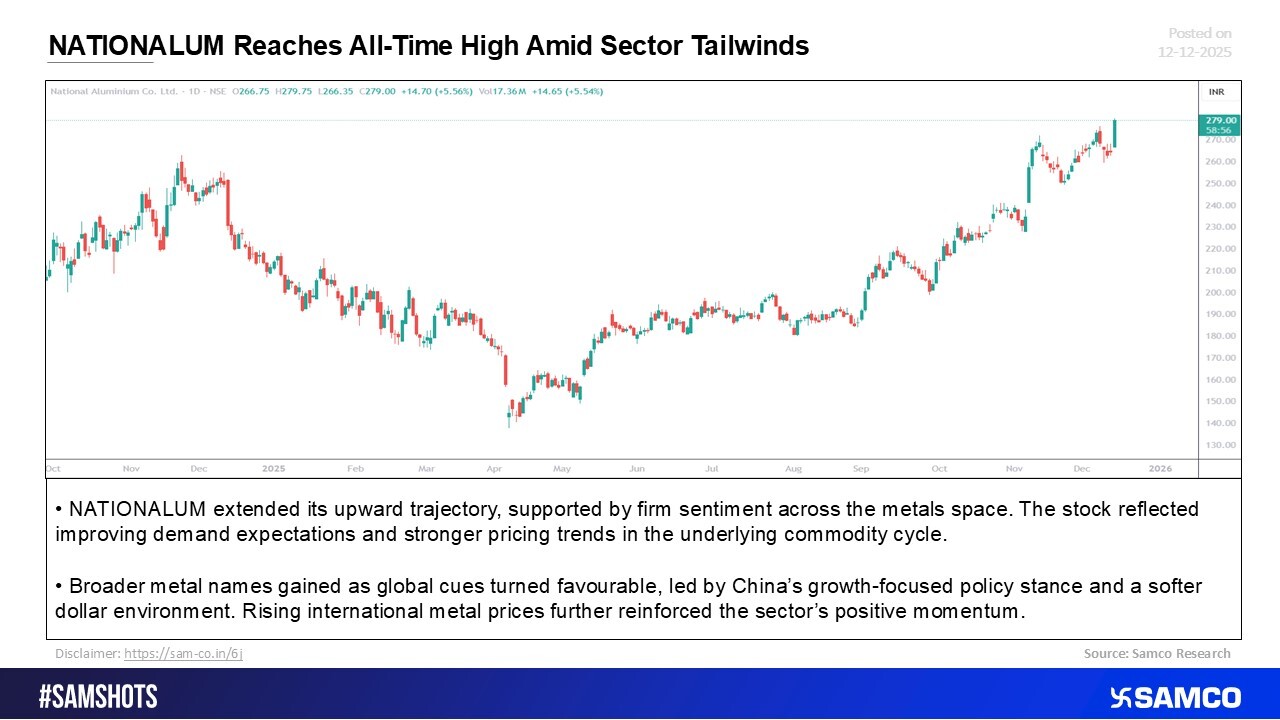
National Aluminium Touches New Peak as Metal Sector Strengthens
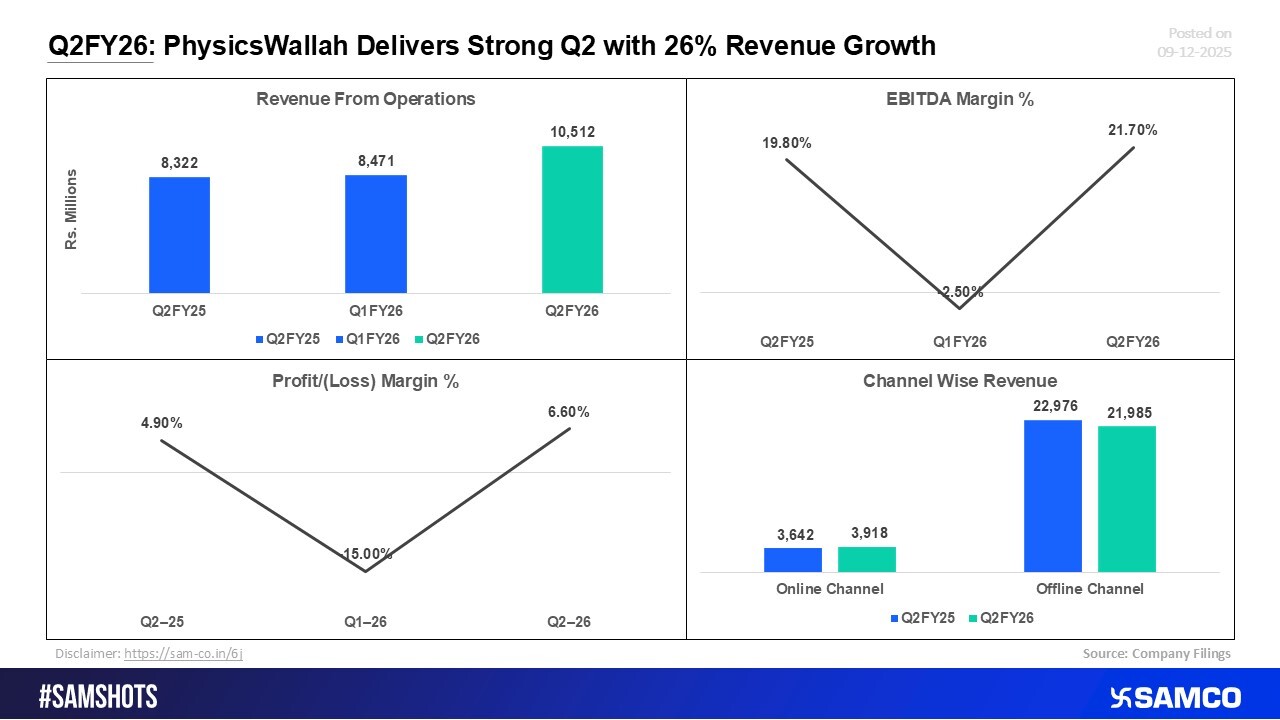
Q2FY26: PhysicsWallah Posts a Robust Quarter with Solid Revenue Expansion
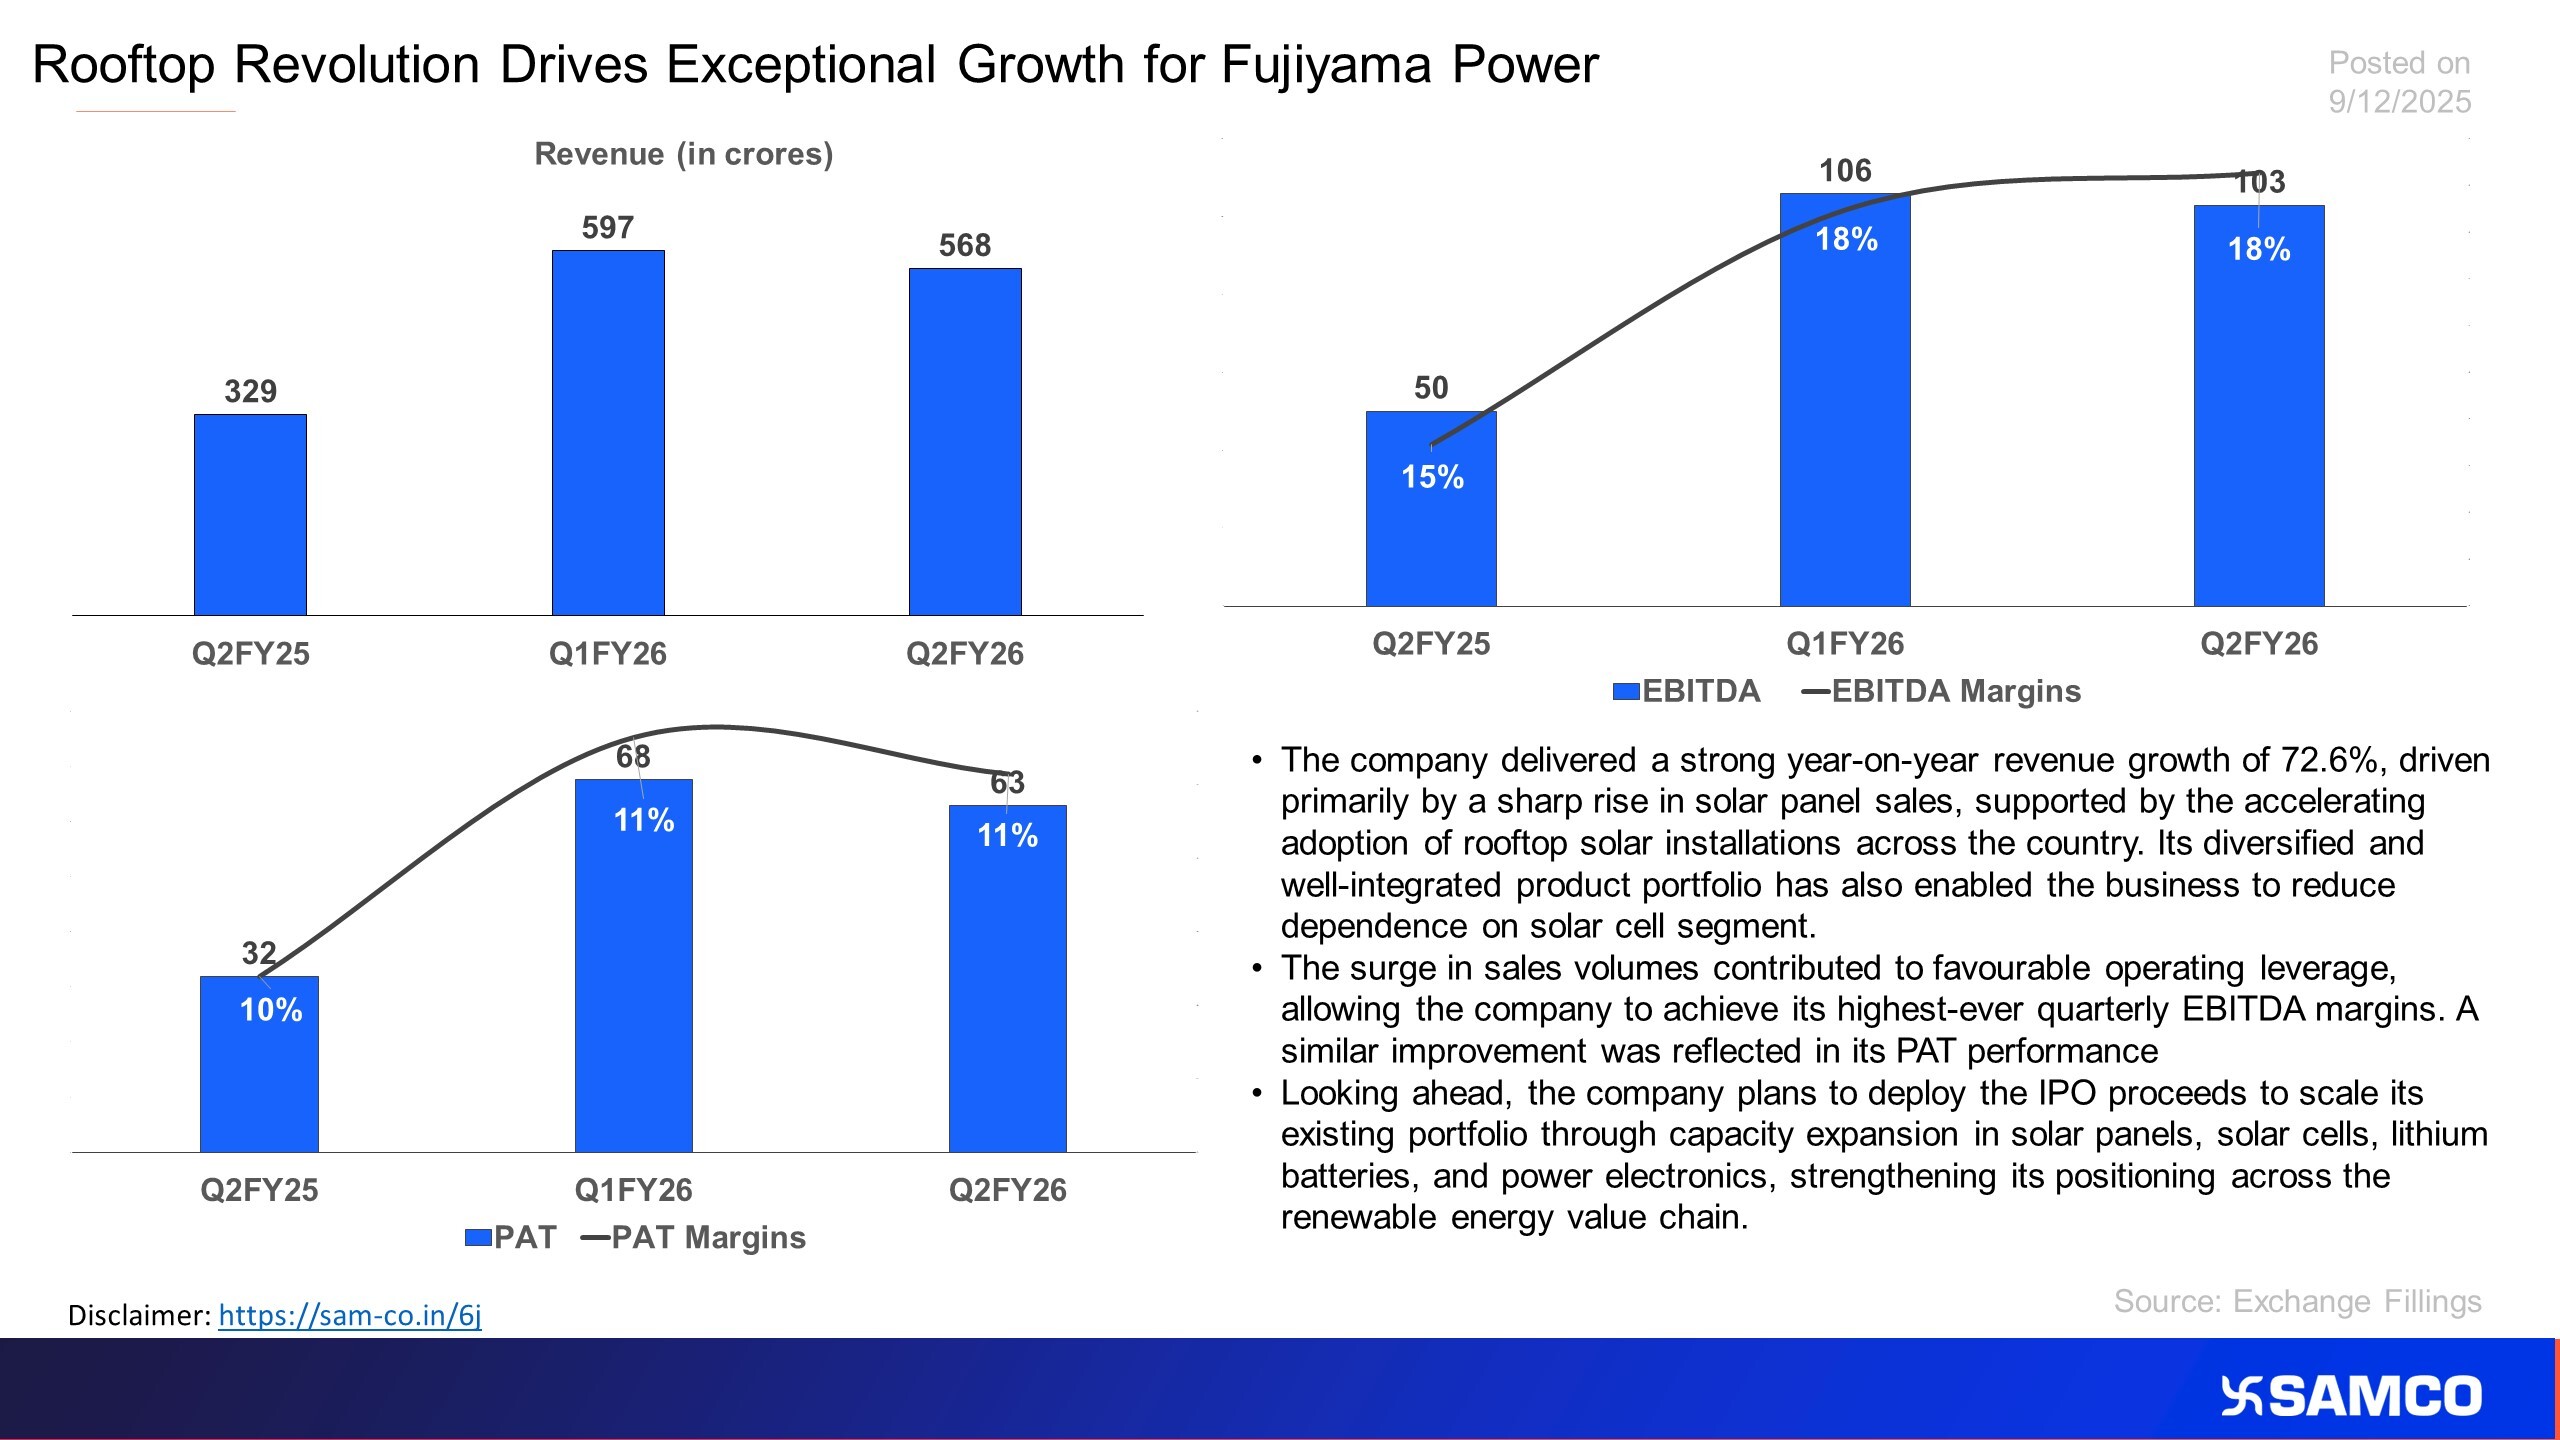
The chart evaluates the financial performance of Fujiyama Power For Q2FY26
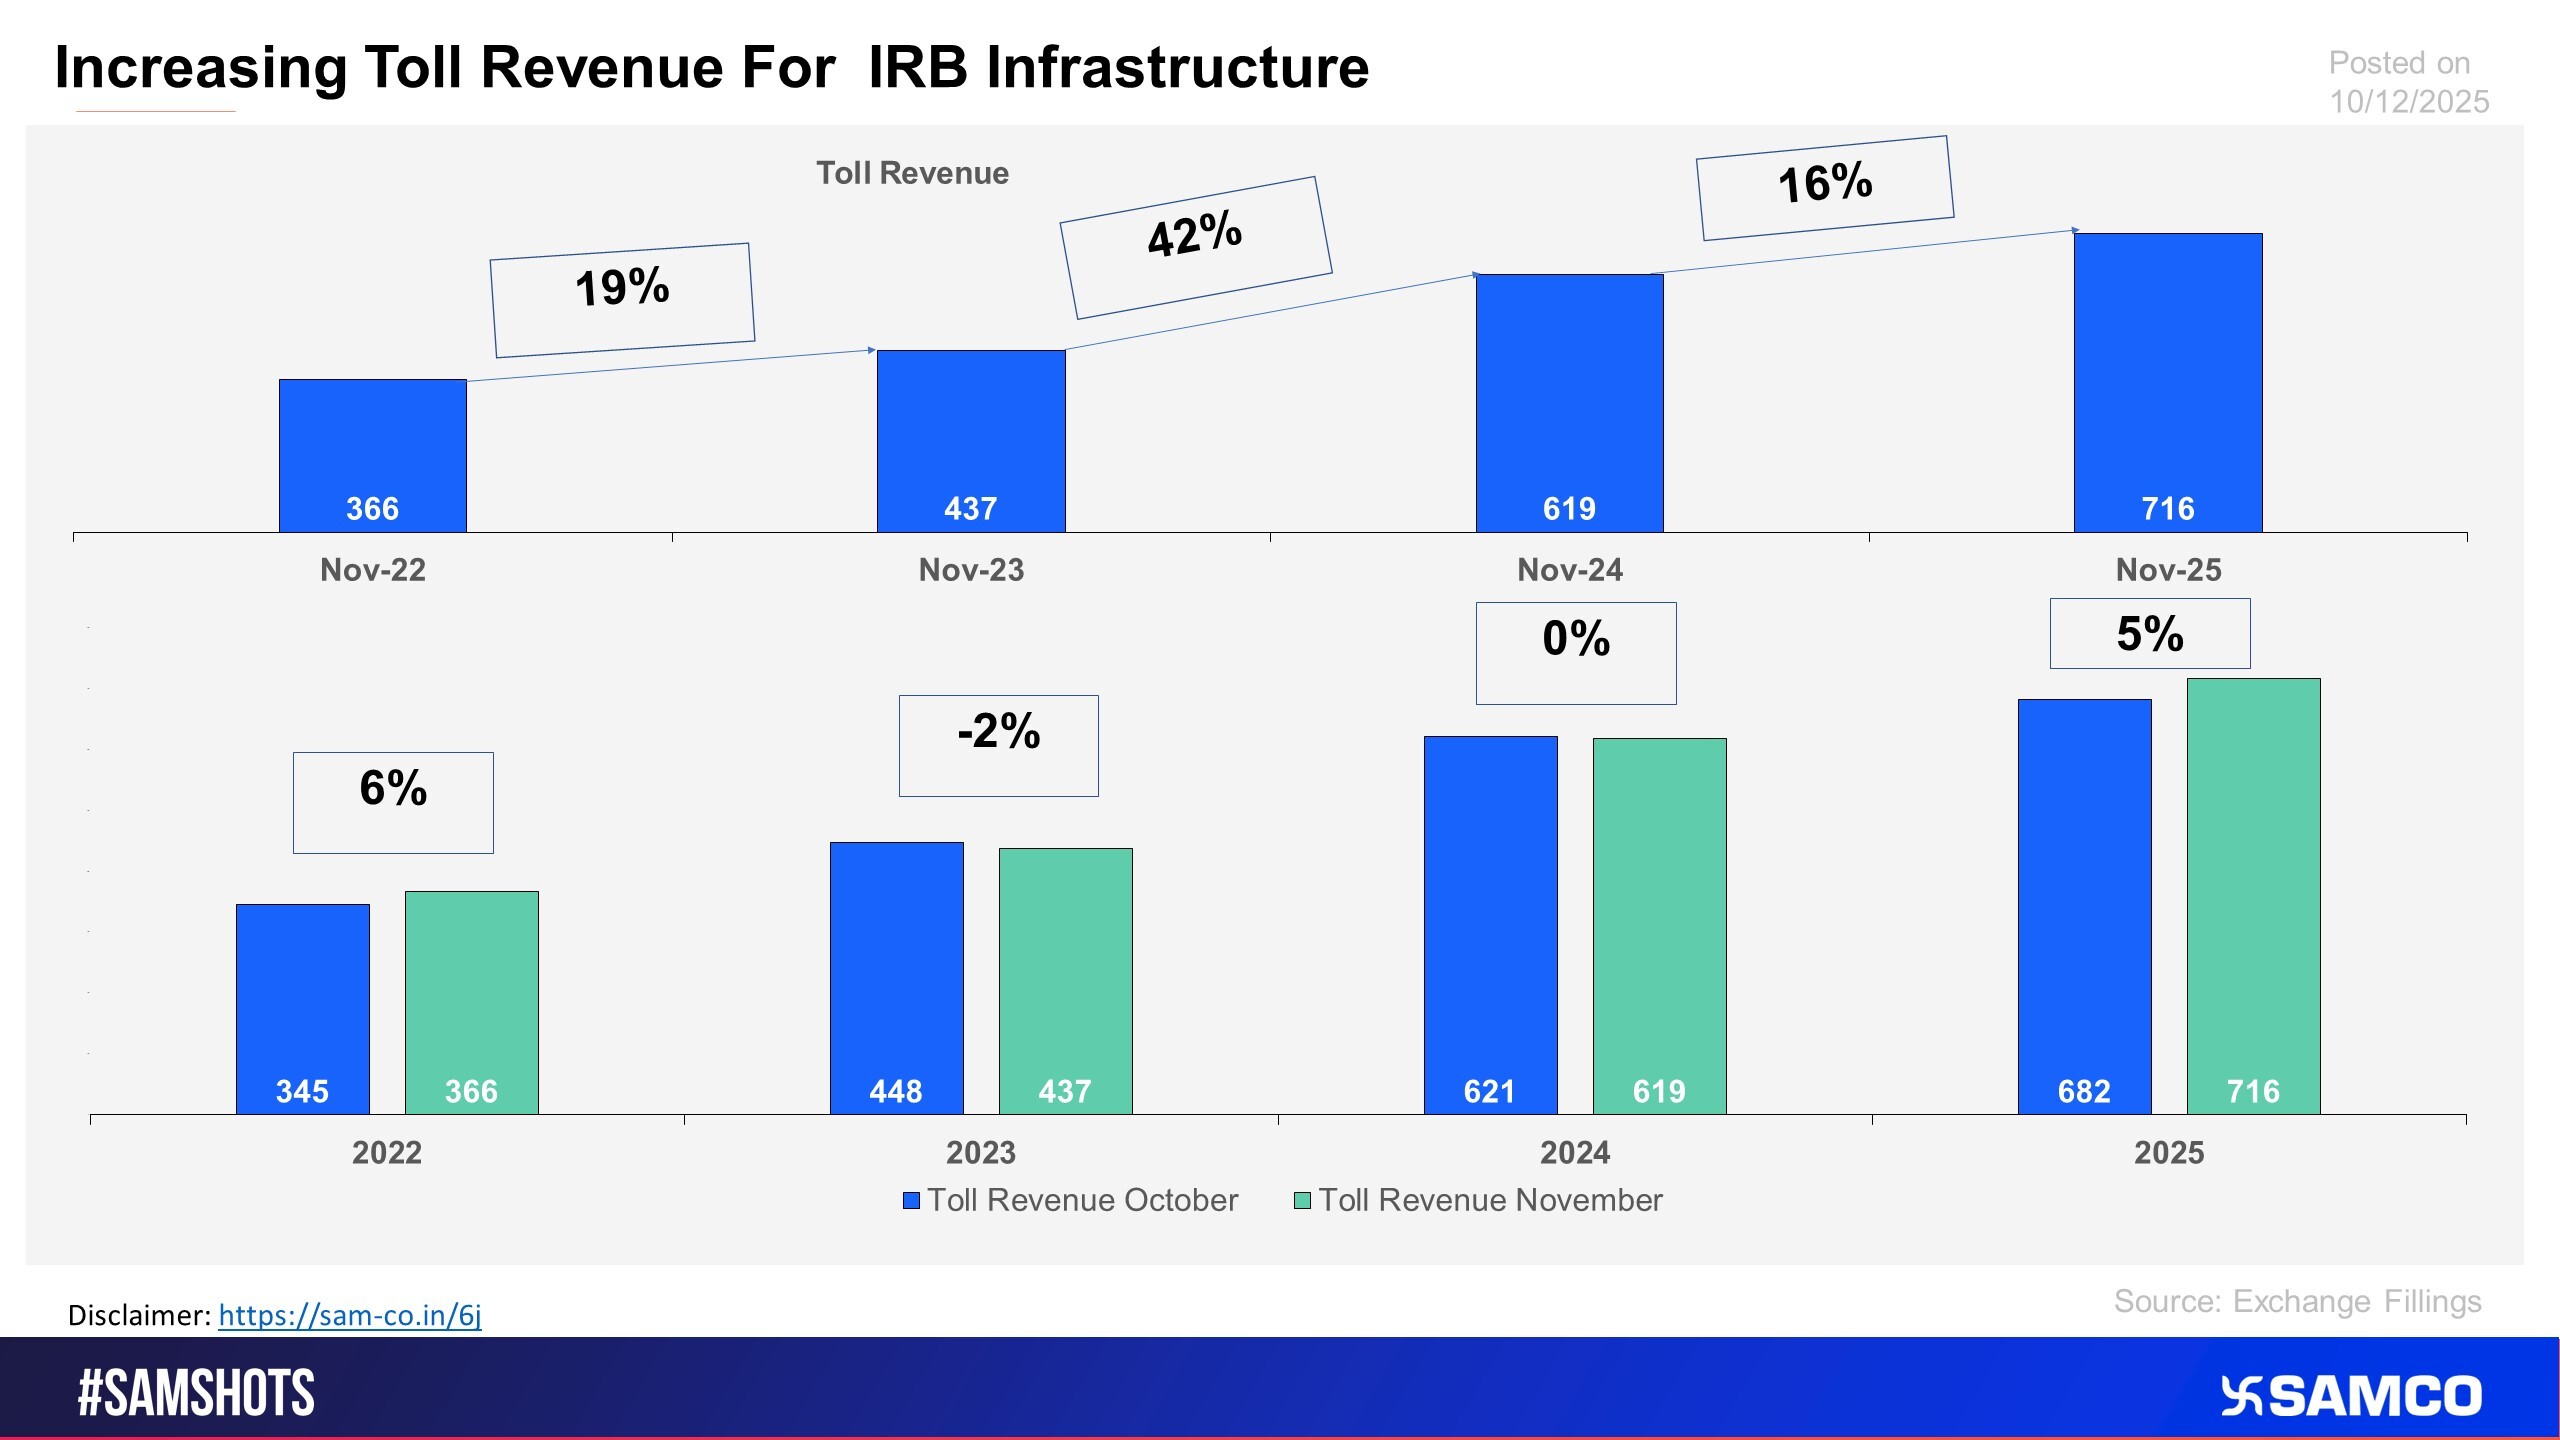
Another High Growing Toll Revenue for IRB
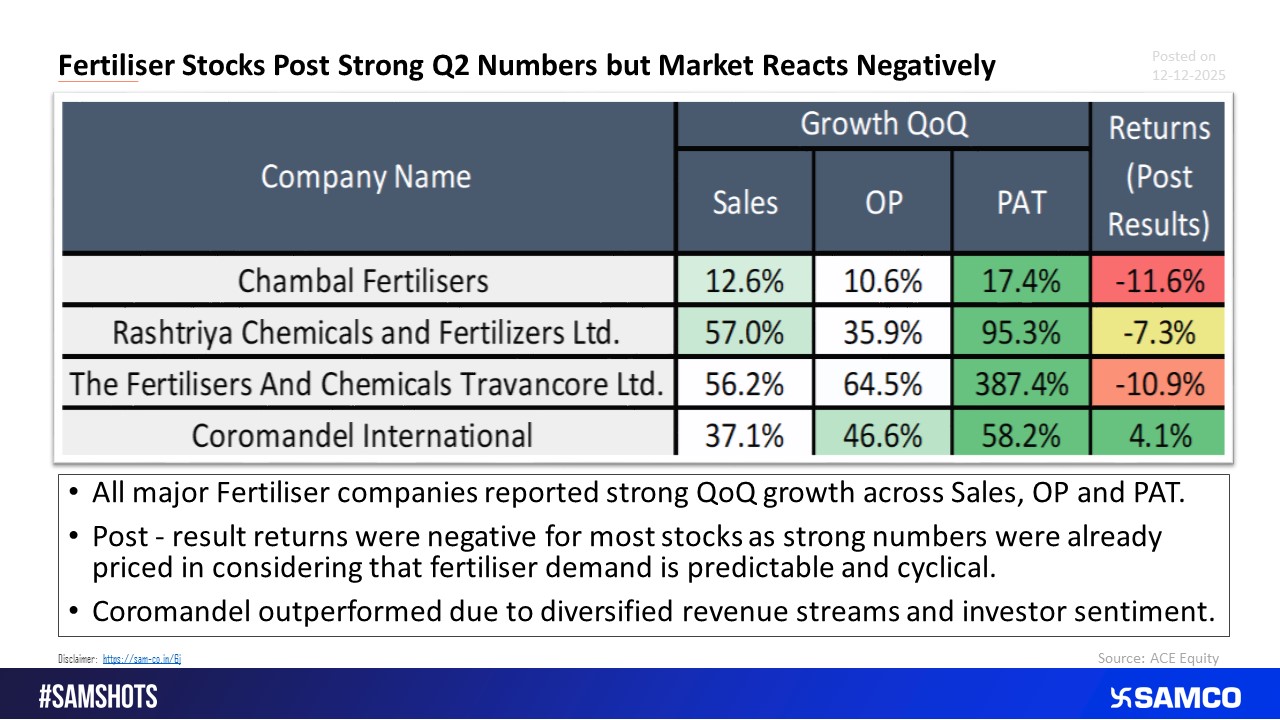
Strong Results but Negative Market Reaction for Fertilizer Stocks.
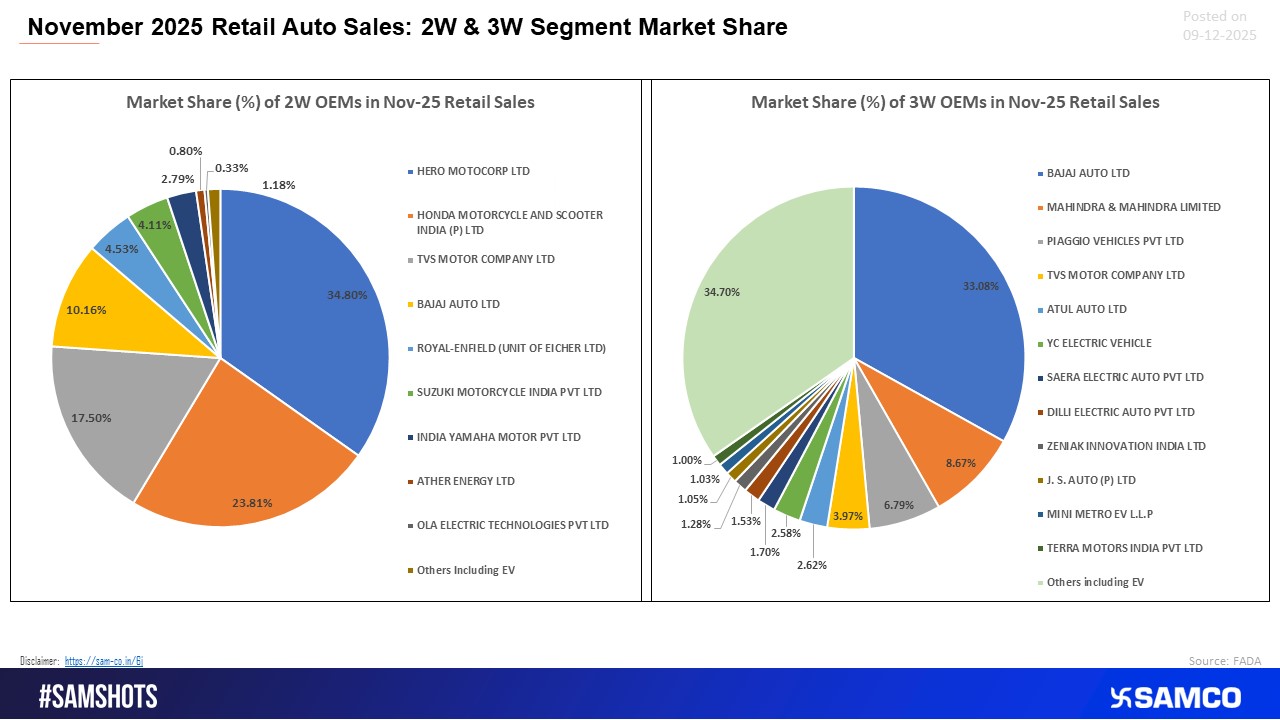
2W–3W Retail Standings, November 2025
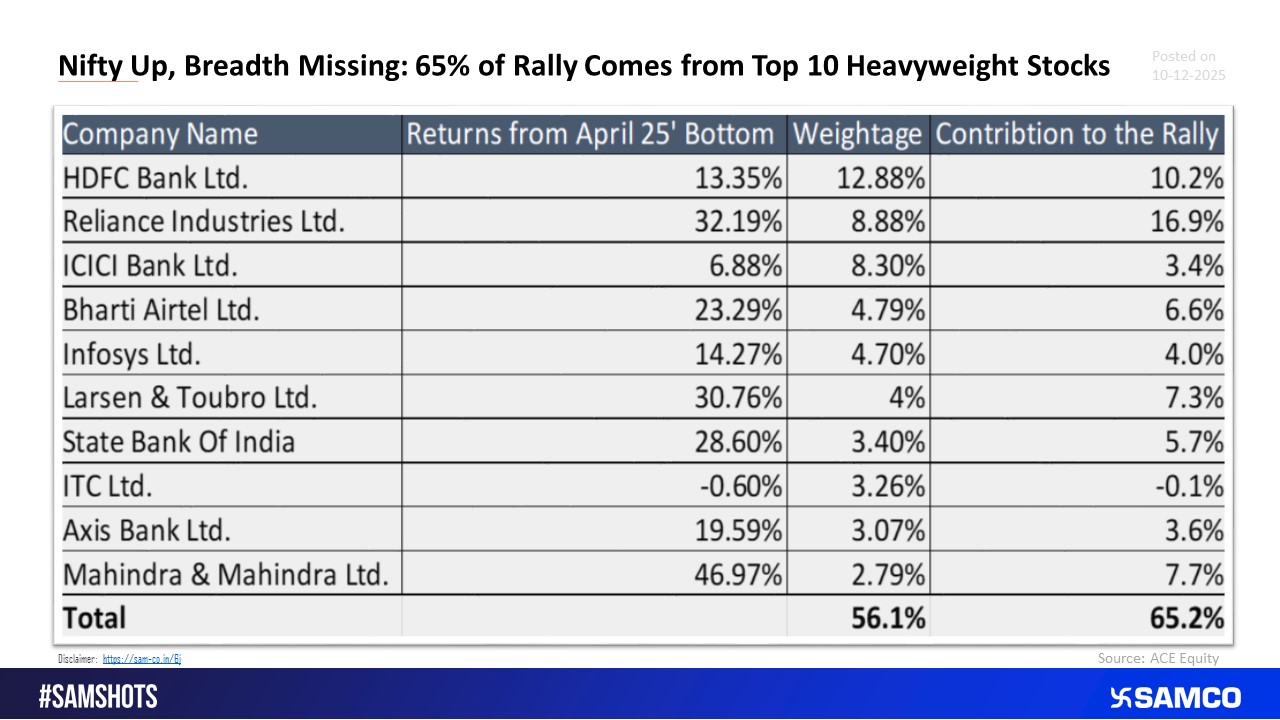
Top 10 Stocks Contribute 65% of Nifty’s Rally.
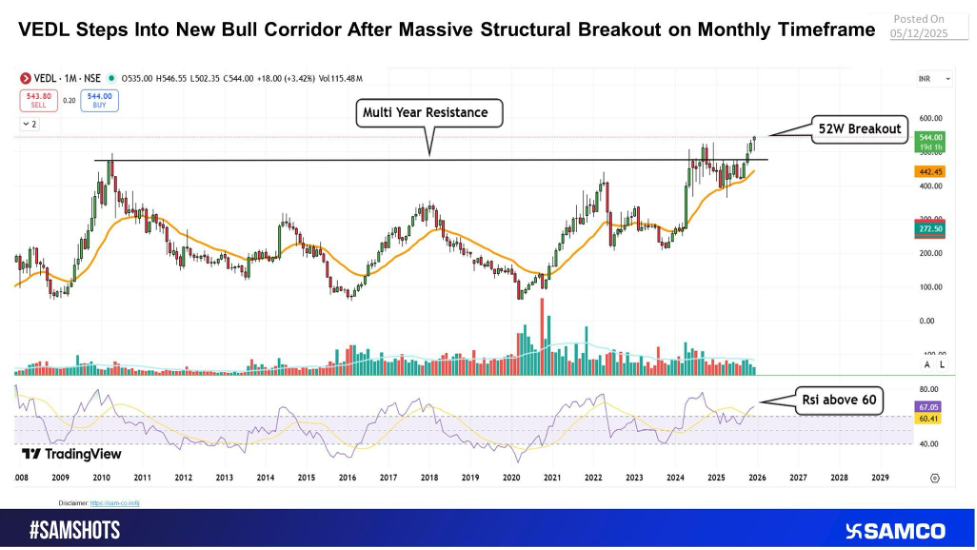
Multi-Year Base Complete: Vedanta Surges Through Decadal Resistance With Rising Volume Strength
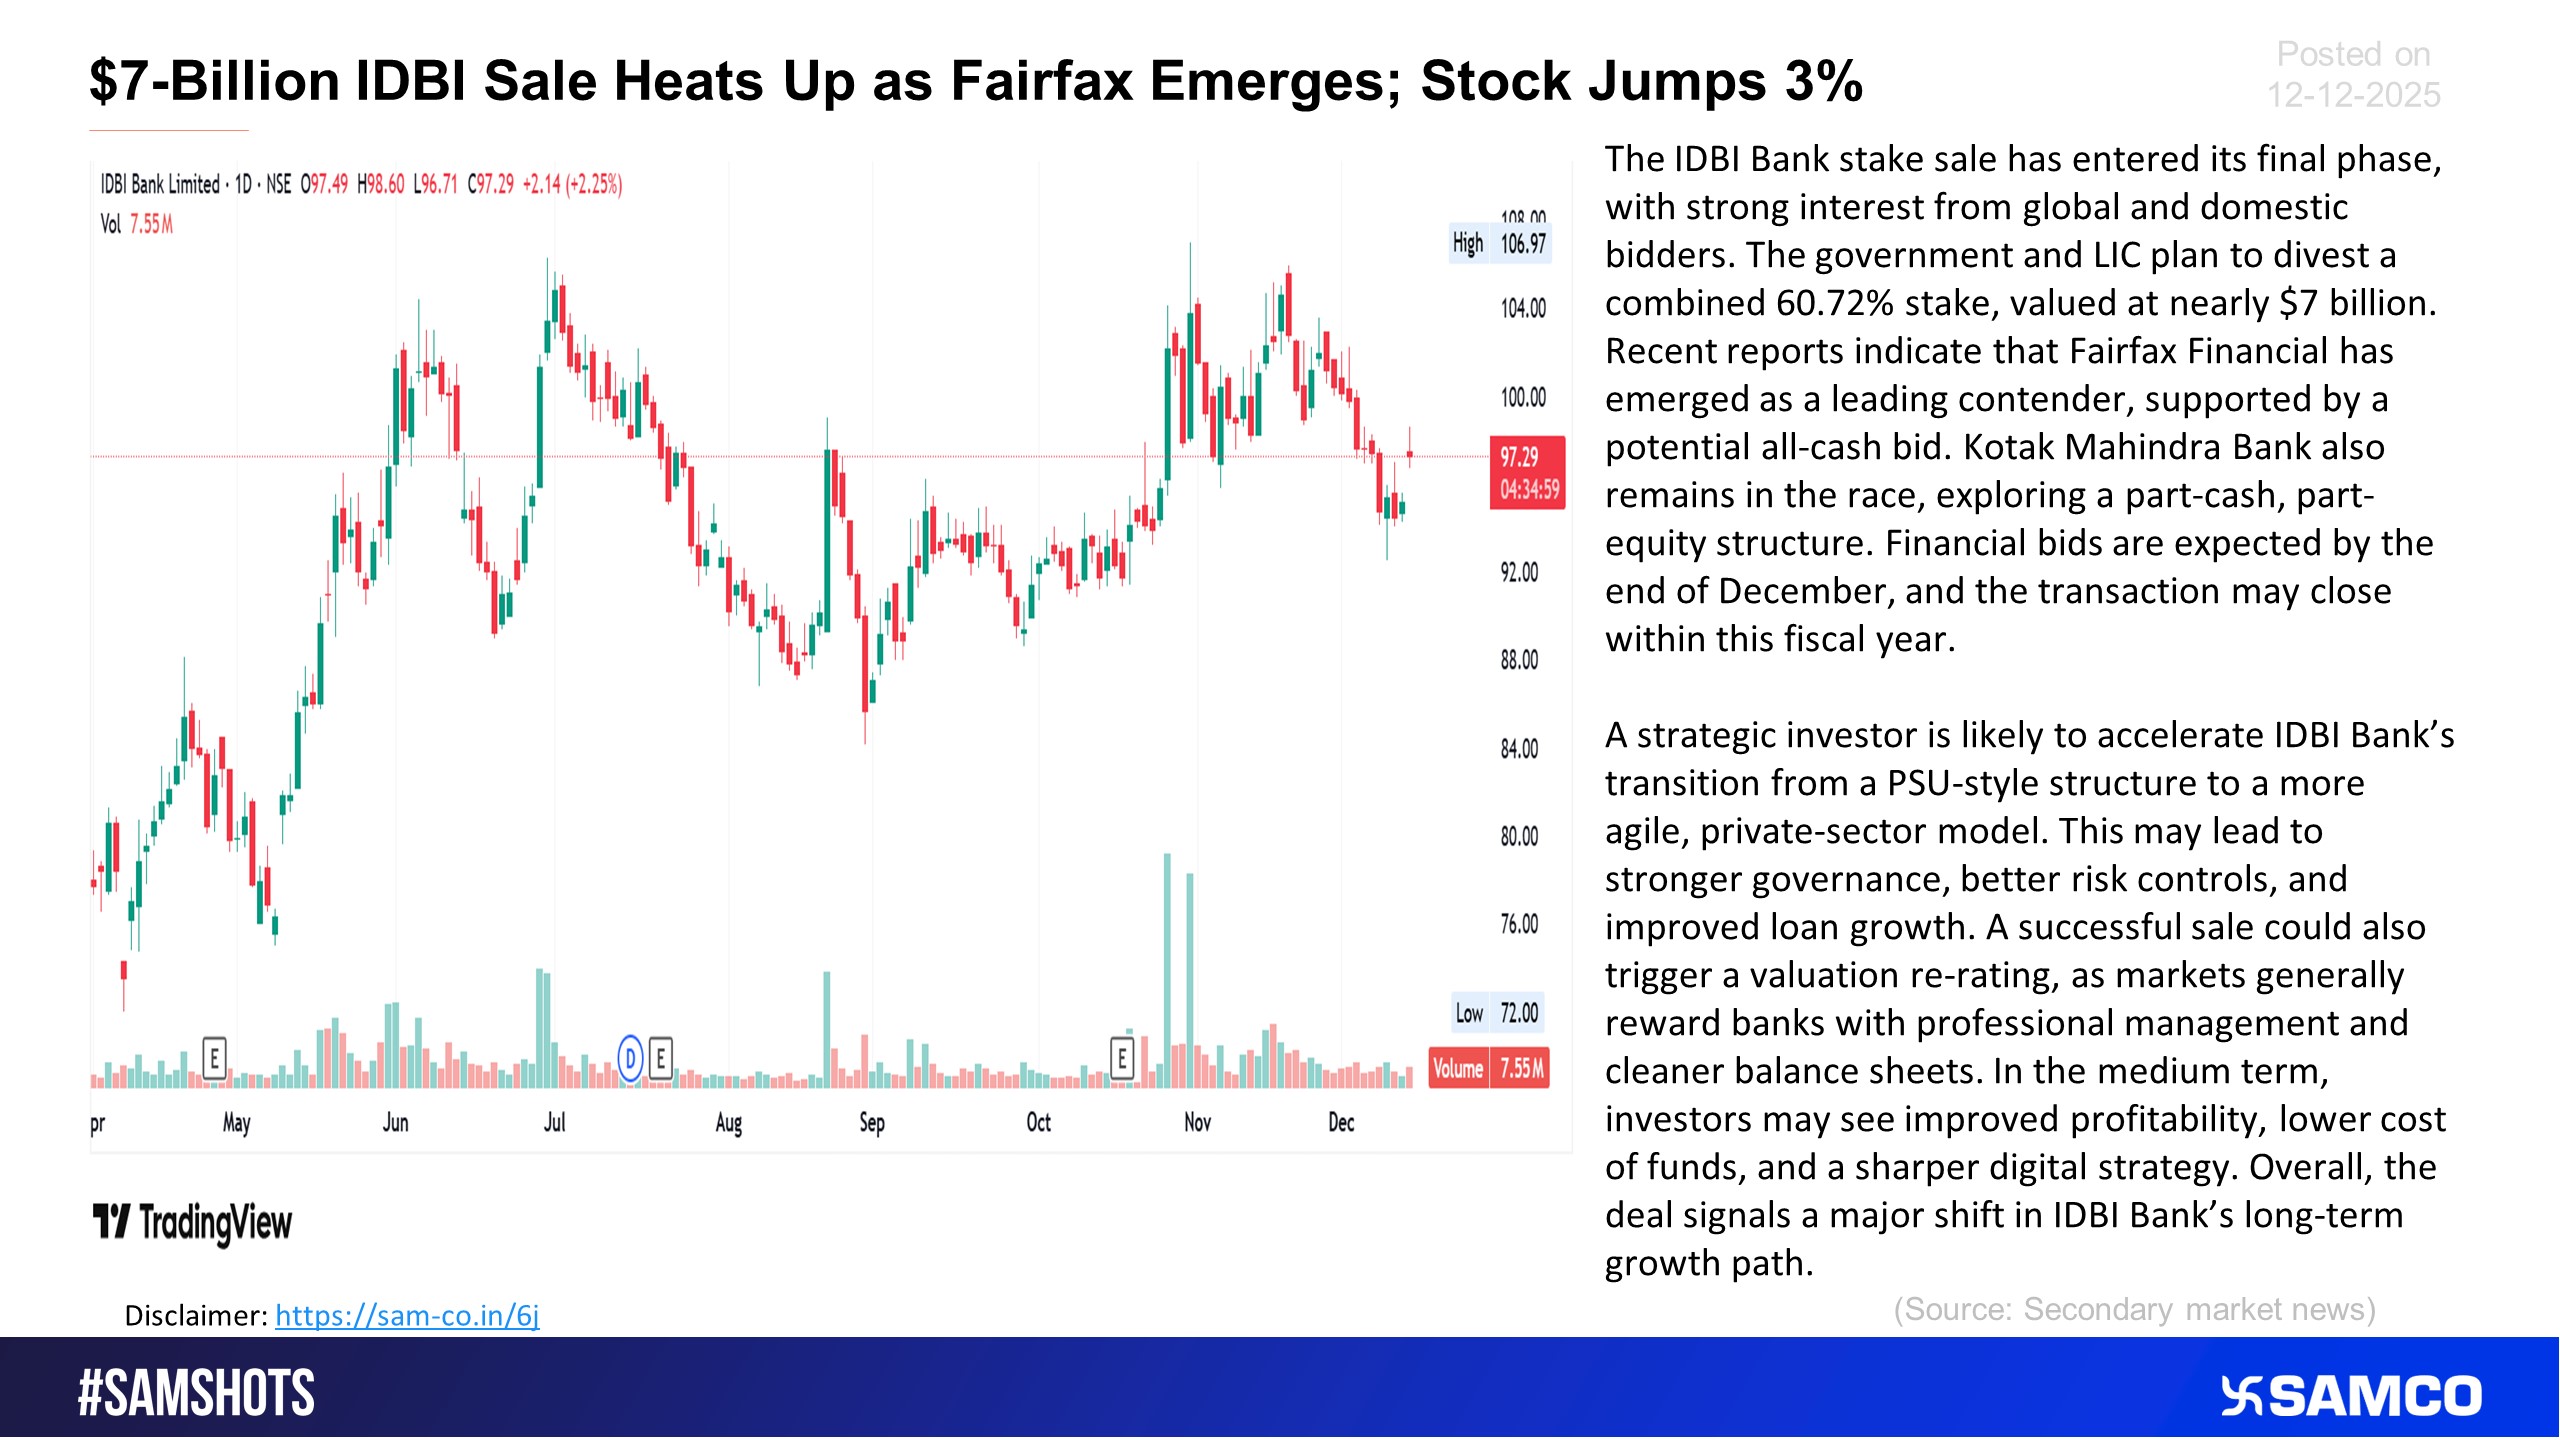
IDBI Stake Sale Momentum Builds; Fairfax Interest Drives 3% Upside.
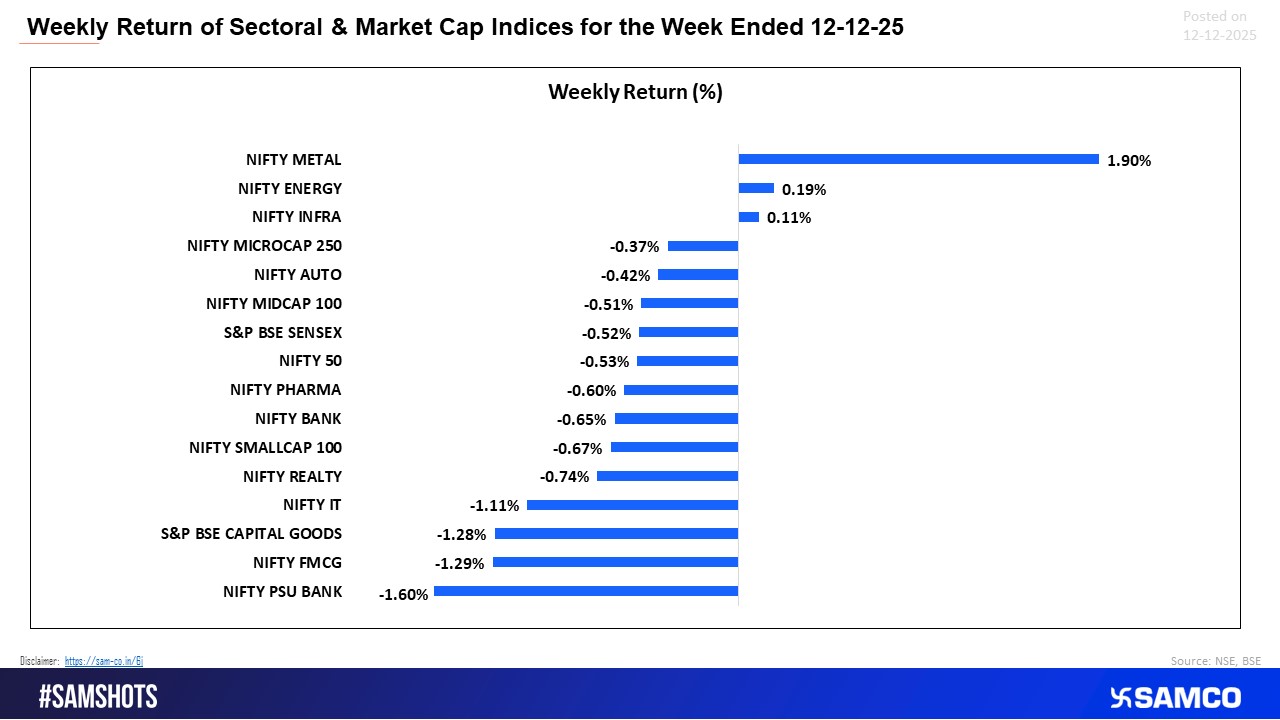
A strong week for Metals contrasted with weakness across FMCG, Capital Goods and PSU Banks.
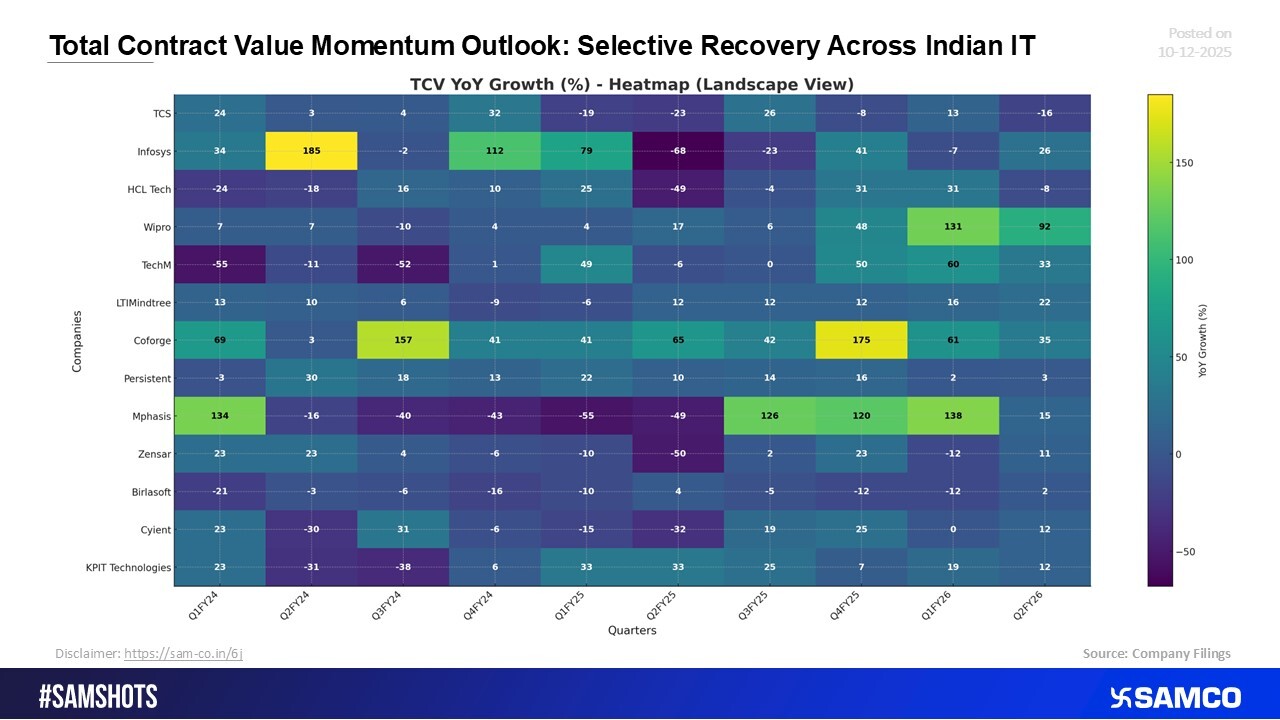
Improving TCV Trends: Indian IT Shows Early Signs of Selective Recovery
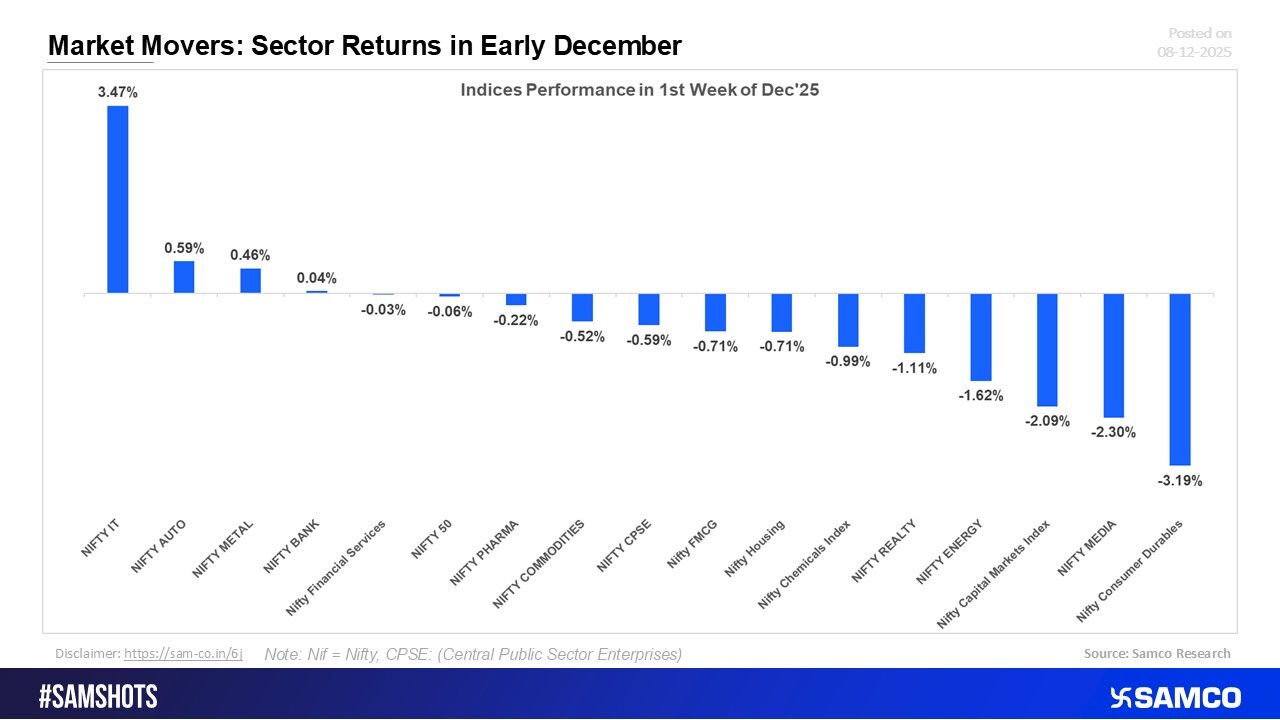
Last Week’s Market Leaders: Sector Performance in Early December
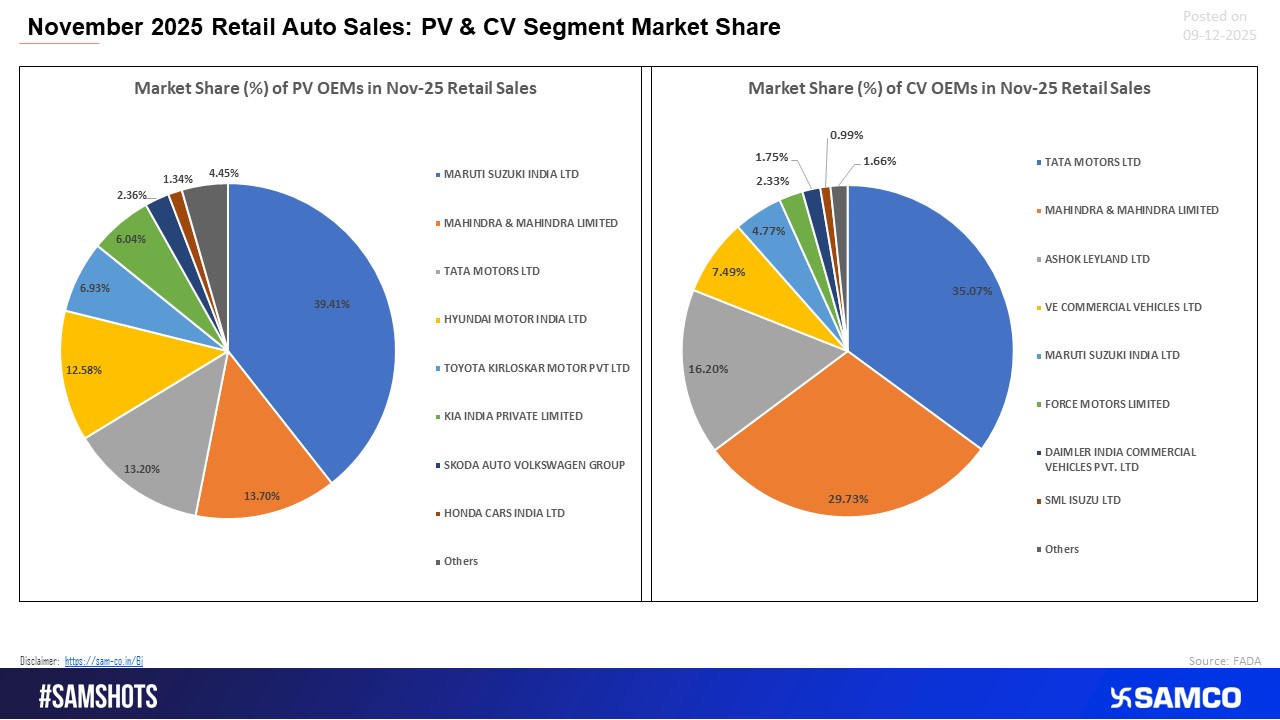
PV–CV Retail Standings, November 2025
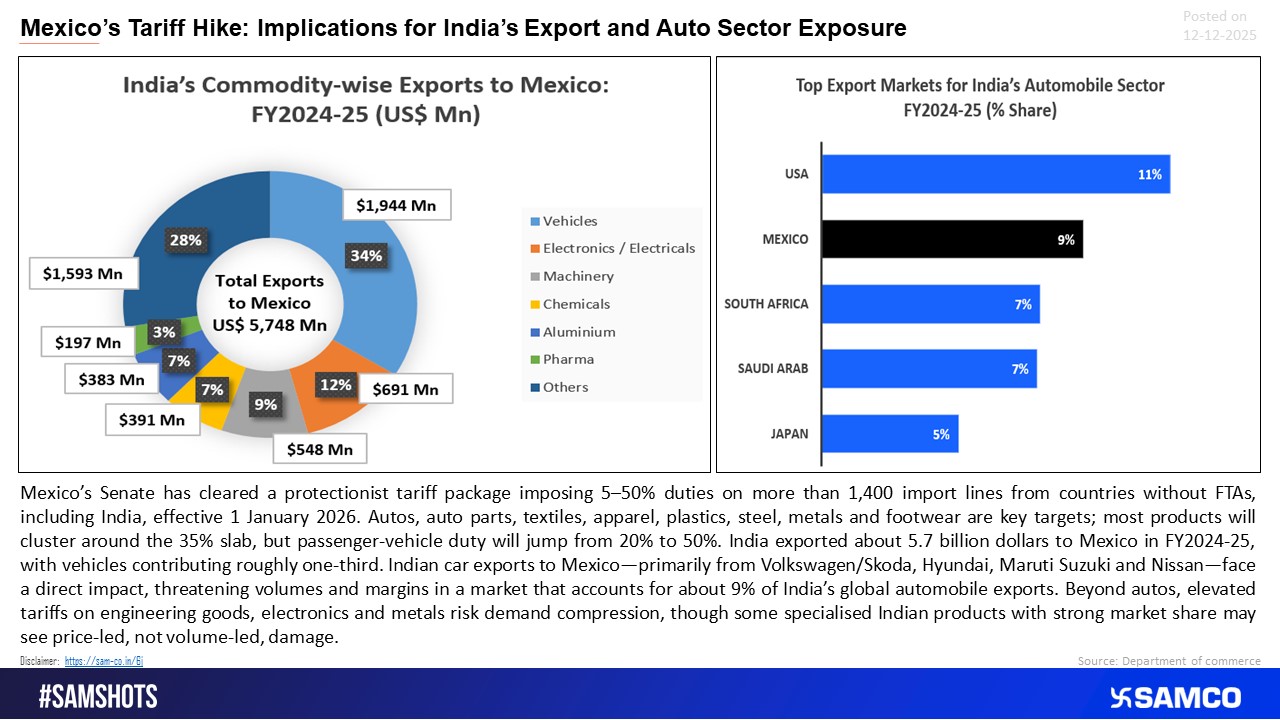
Mexico’s New Tariffs Pose Direct Risk to India’s Vehicle Export Market
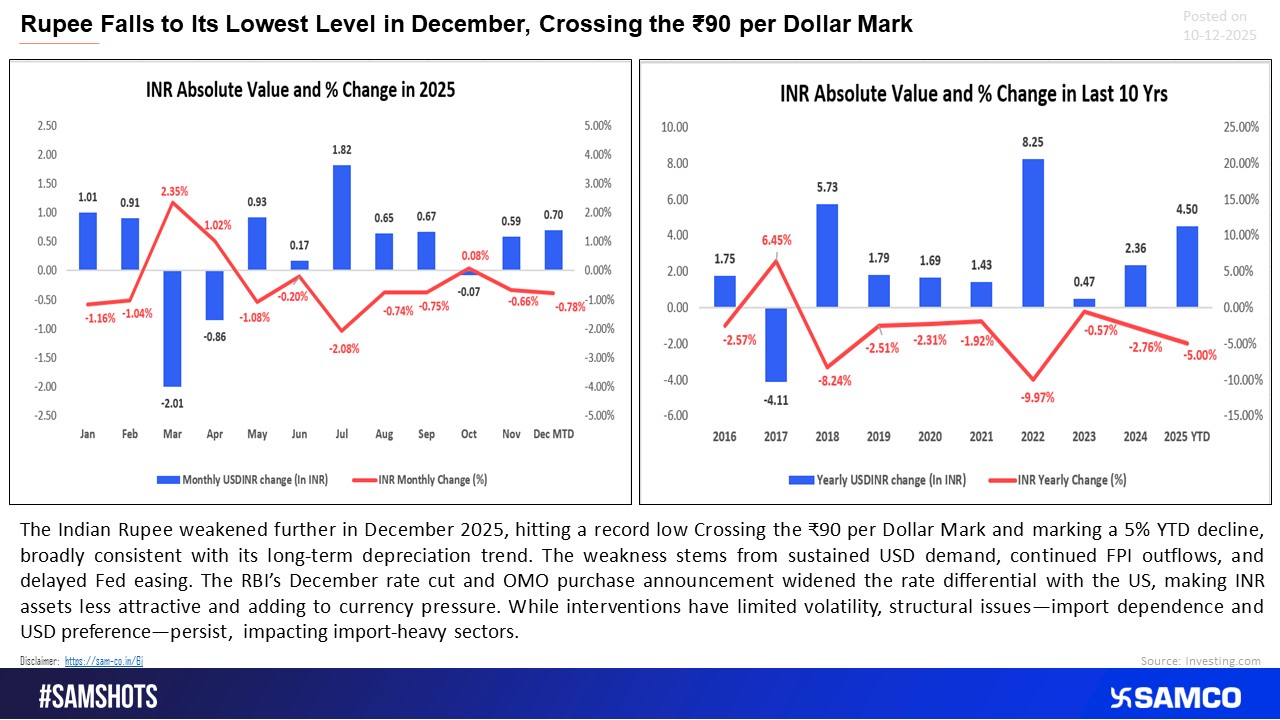
INR dropped past ?90 as pressure on the currency persisted.
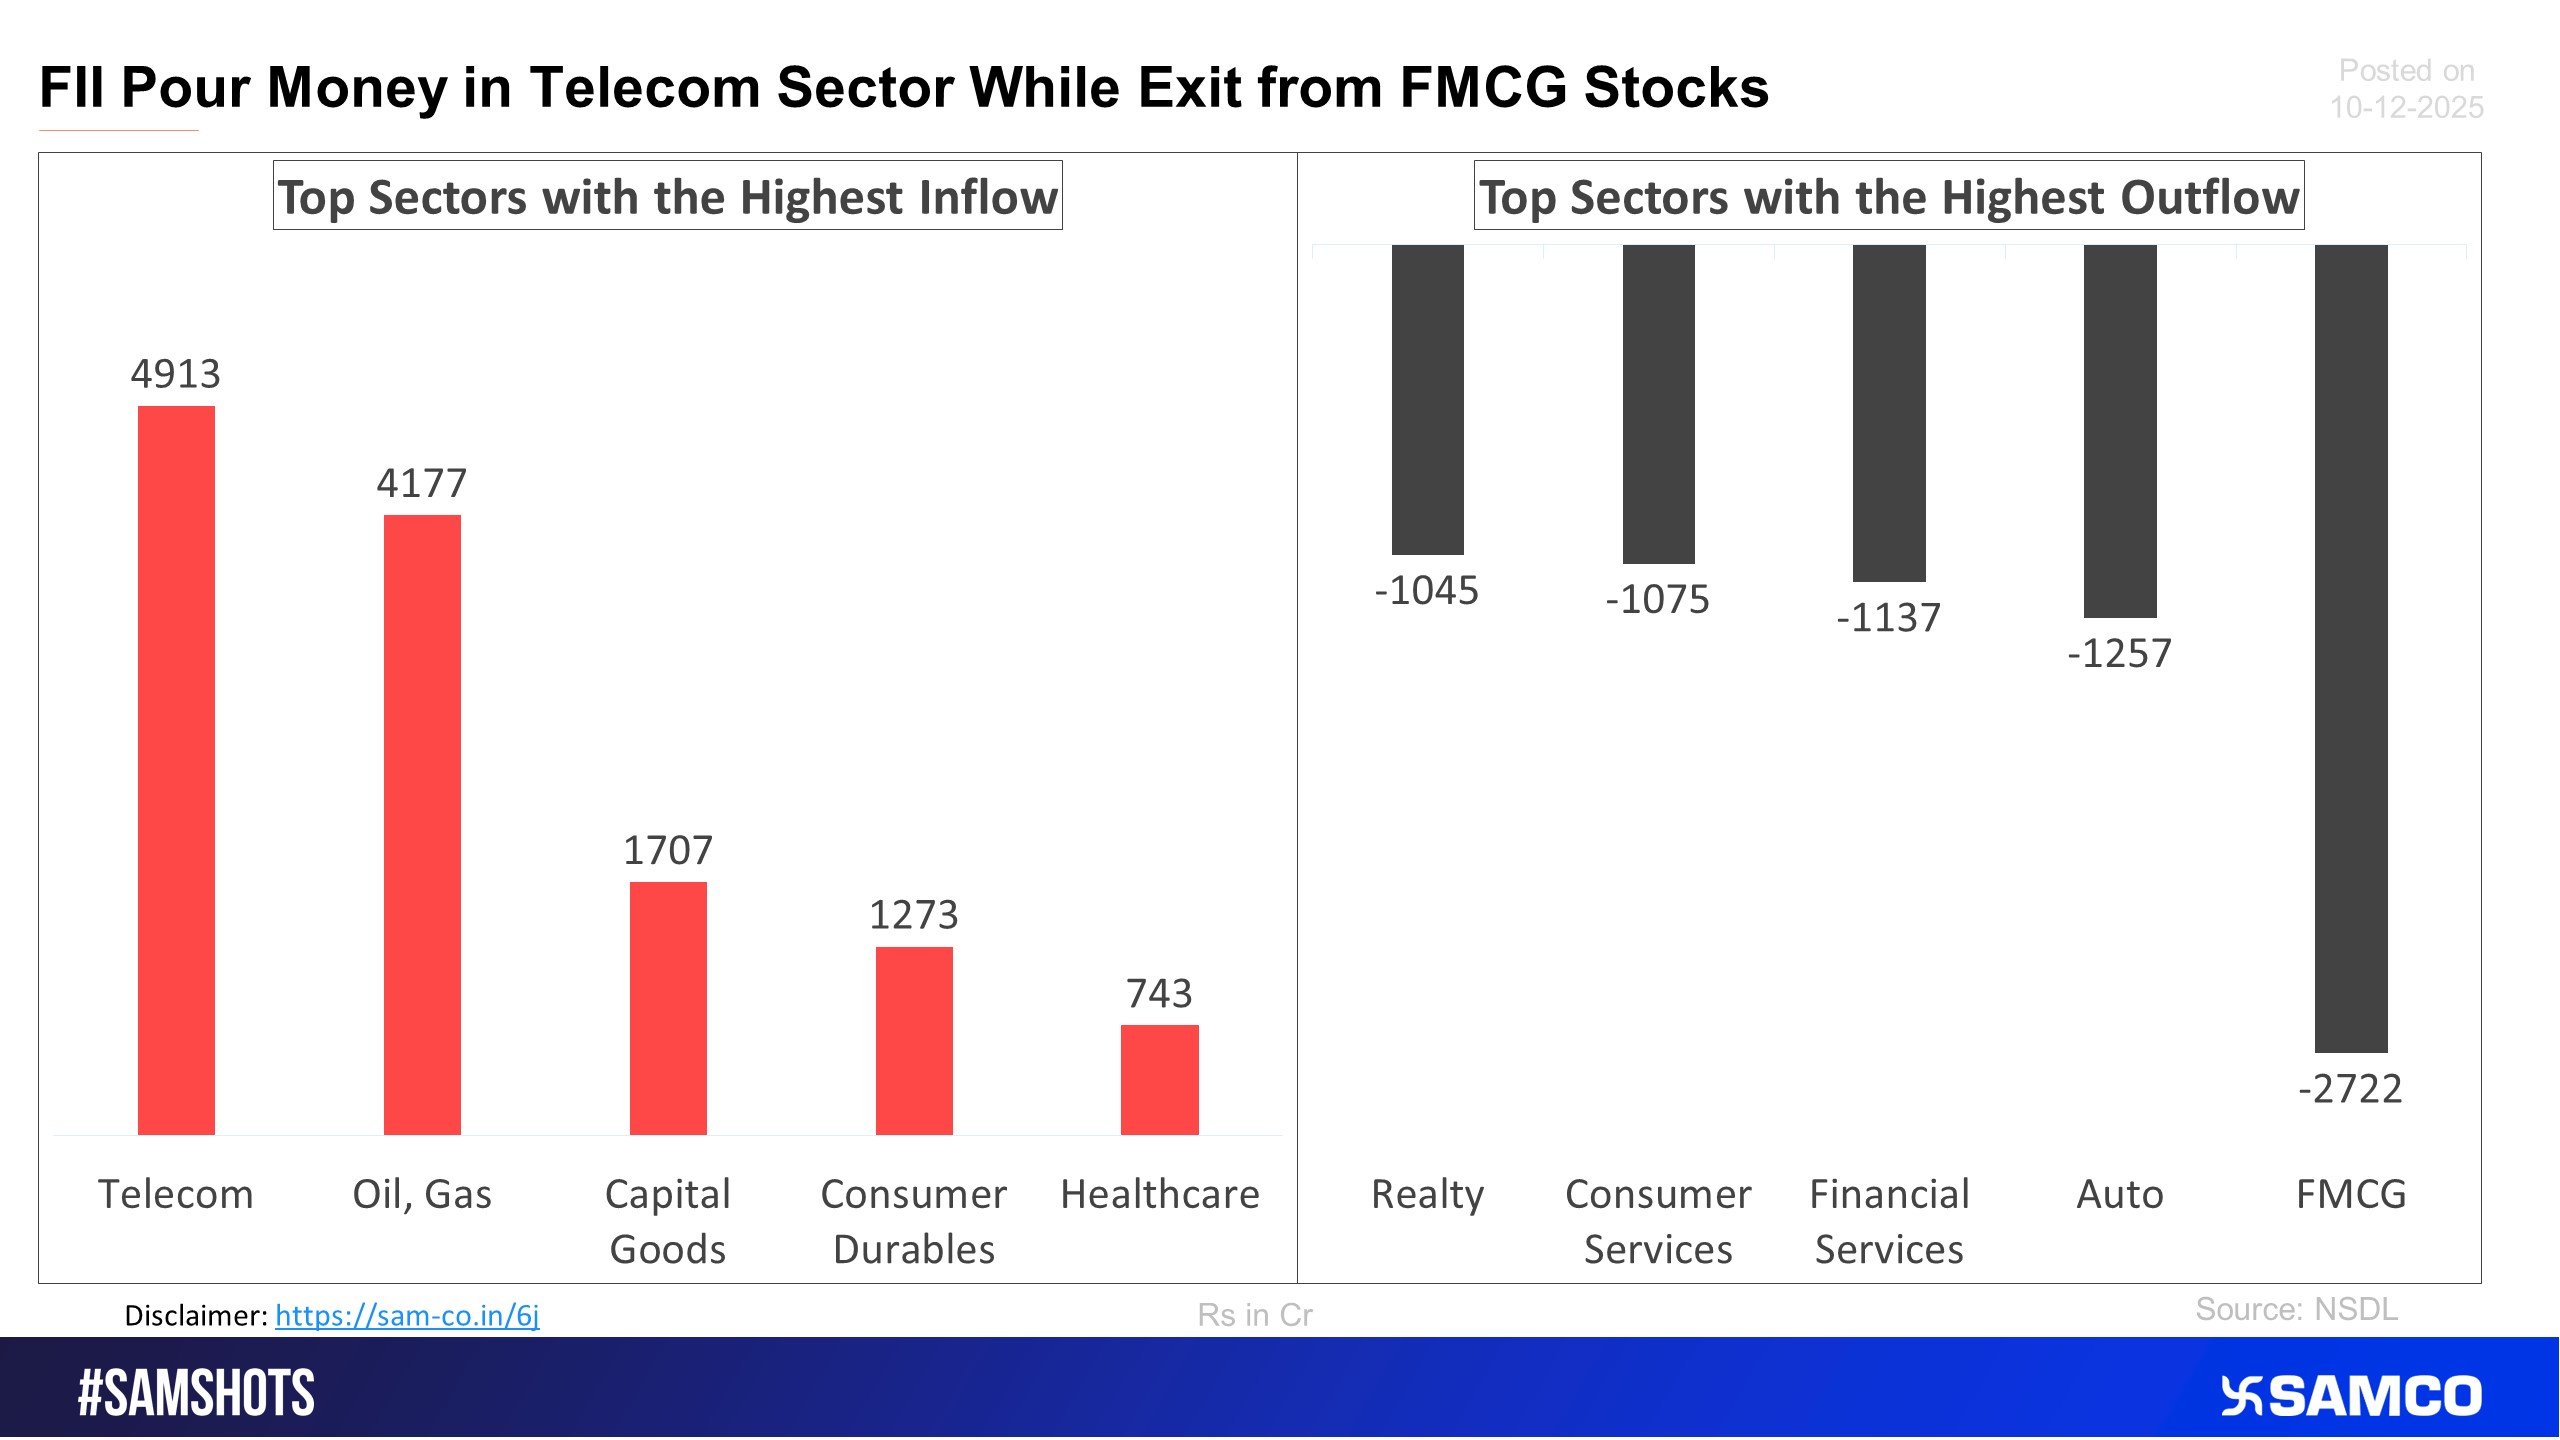
The accompanying chart shows the top 5 sectors that witnessed FPI’s highest inflow and outflow in the latest quarter.
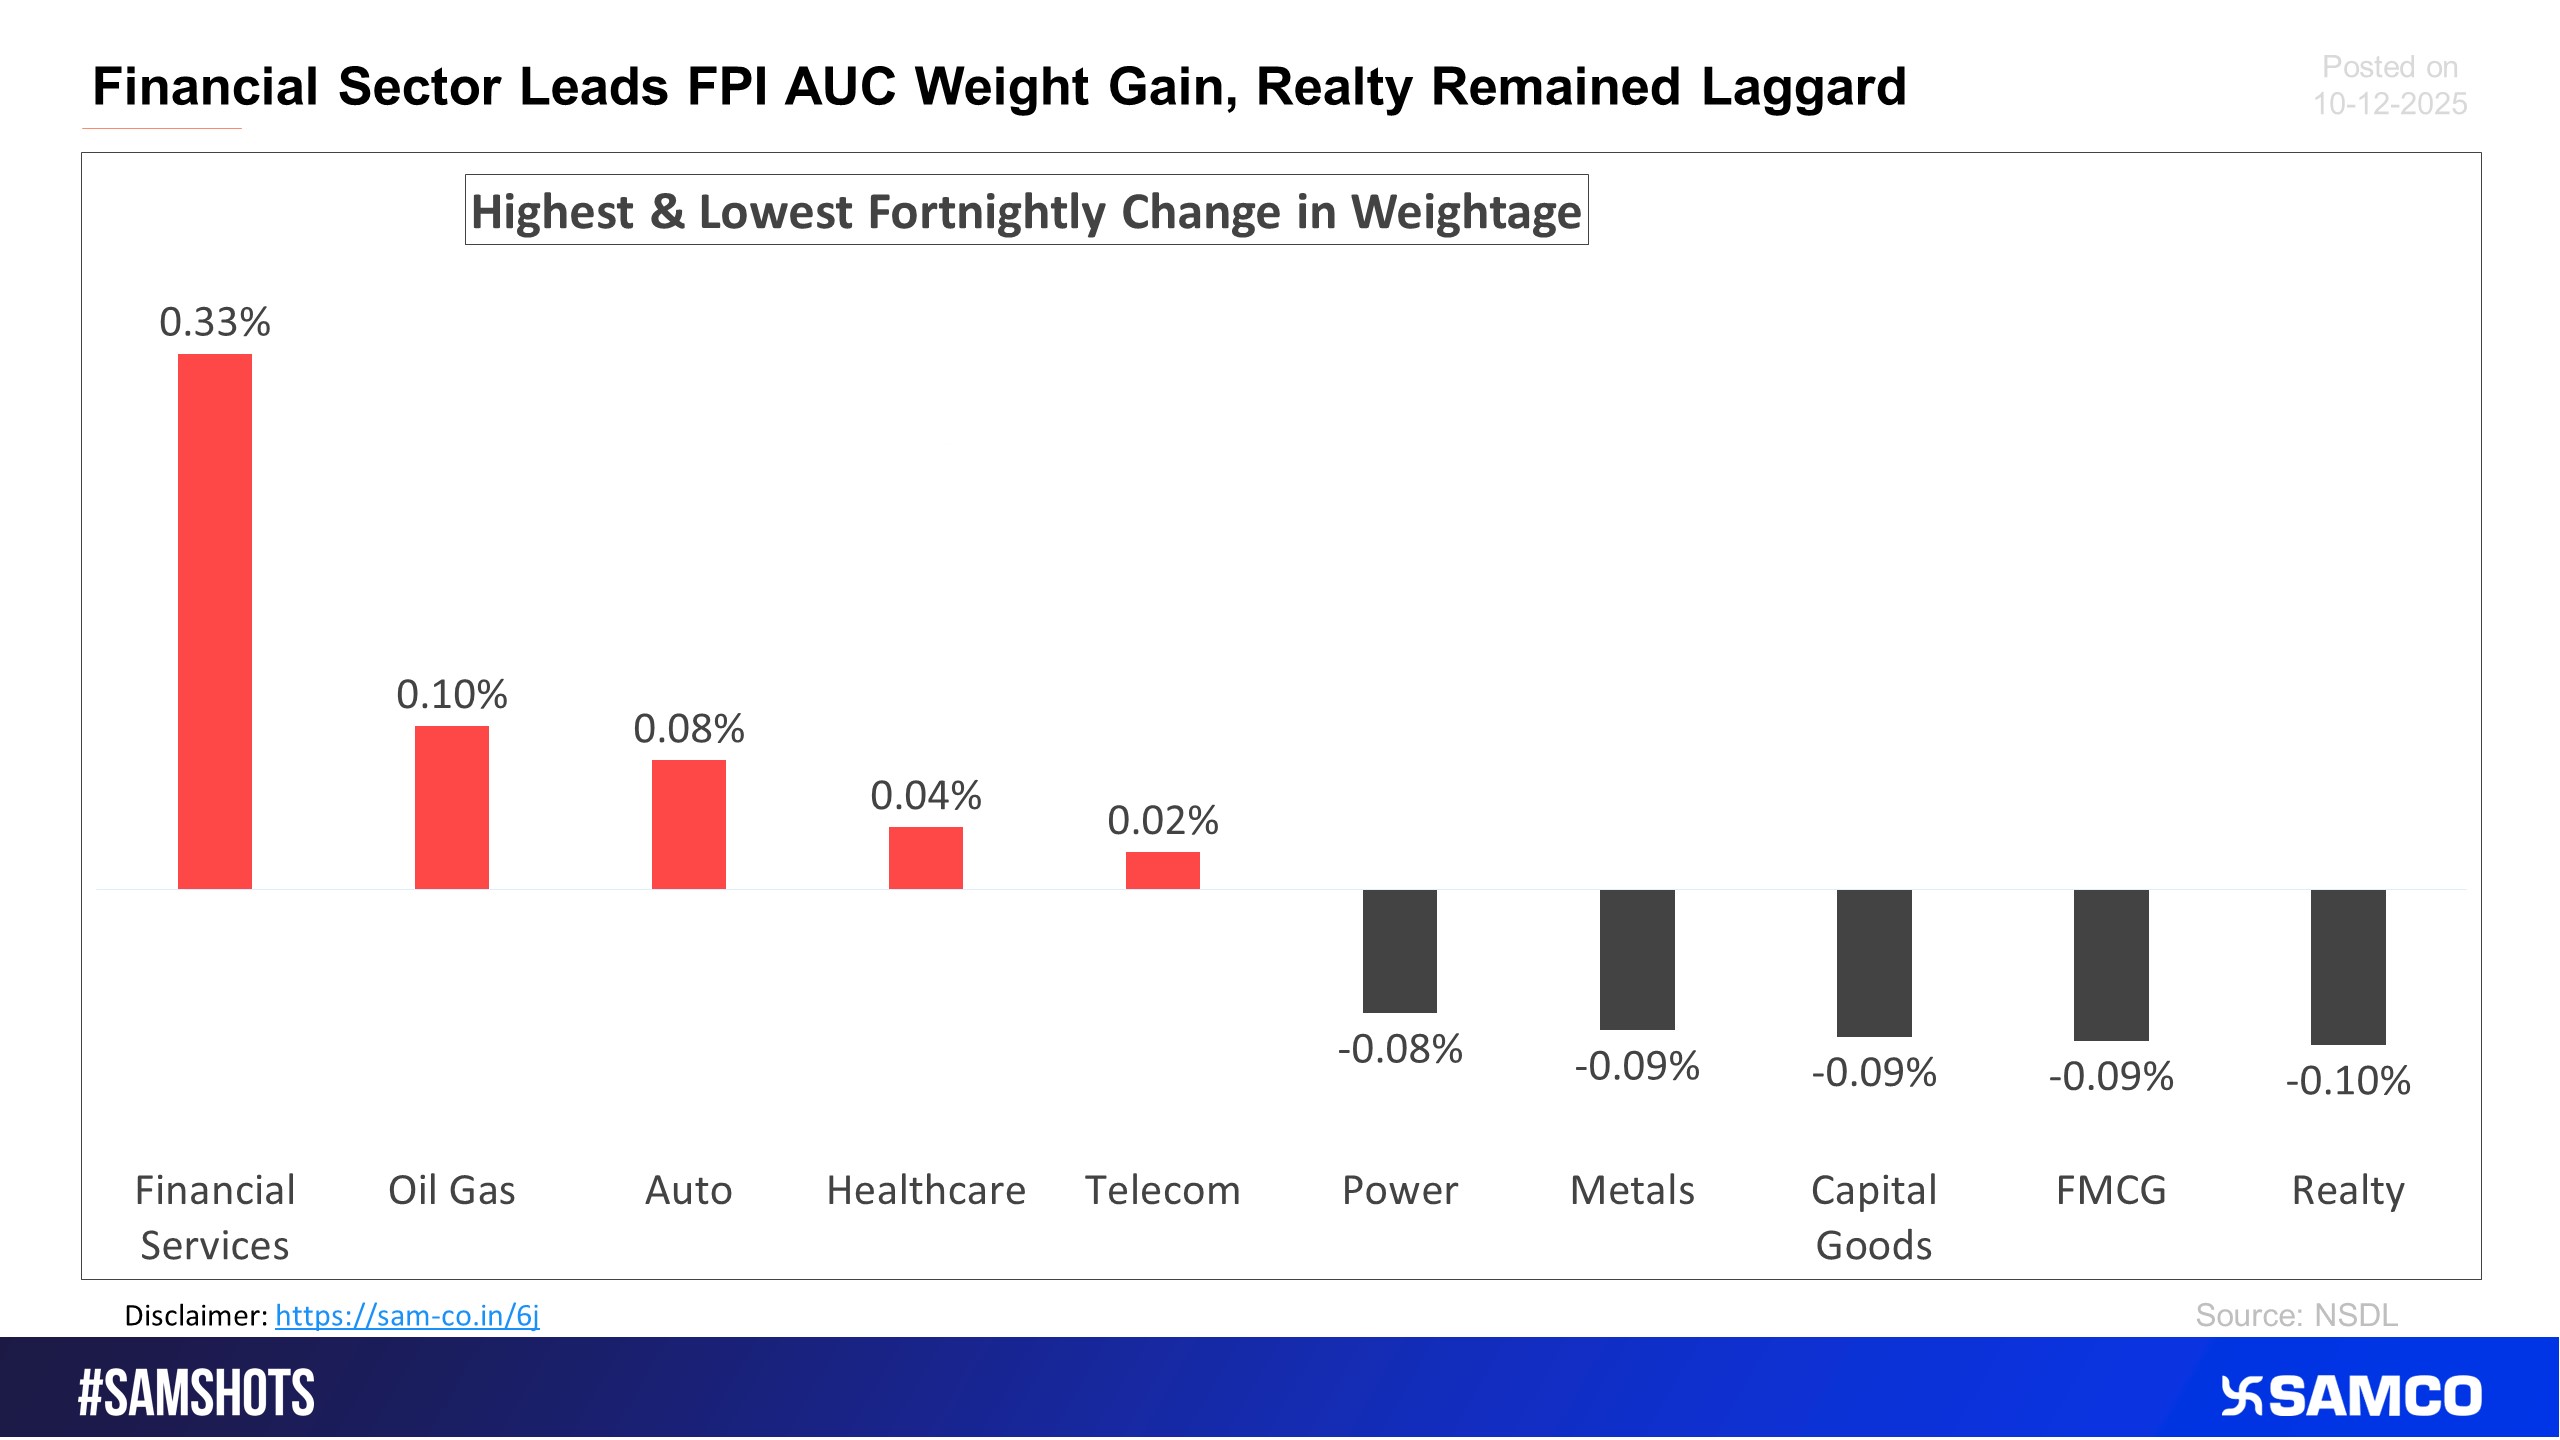
The chart below displays sectors that witnessed the highest and lowest change in the weightage of sectoral FPI holdings to the total FPI holdings compared to the previous fortnight.
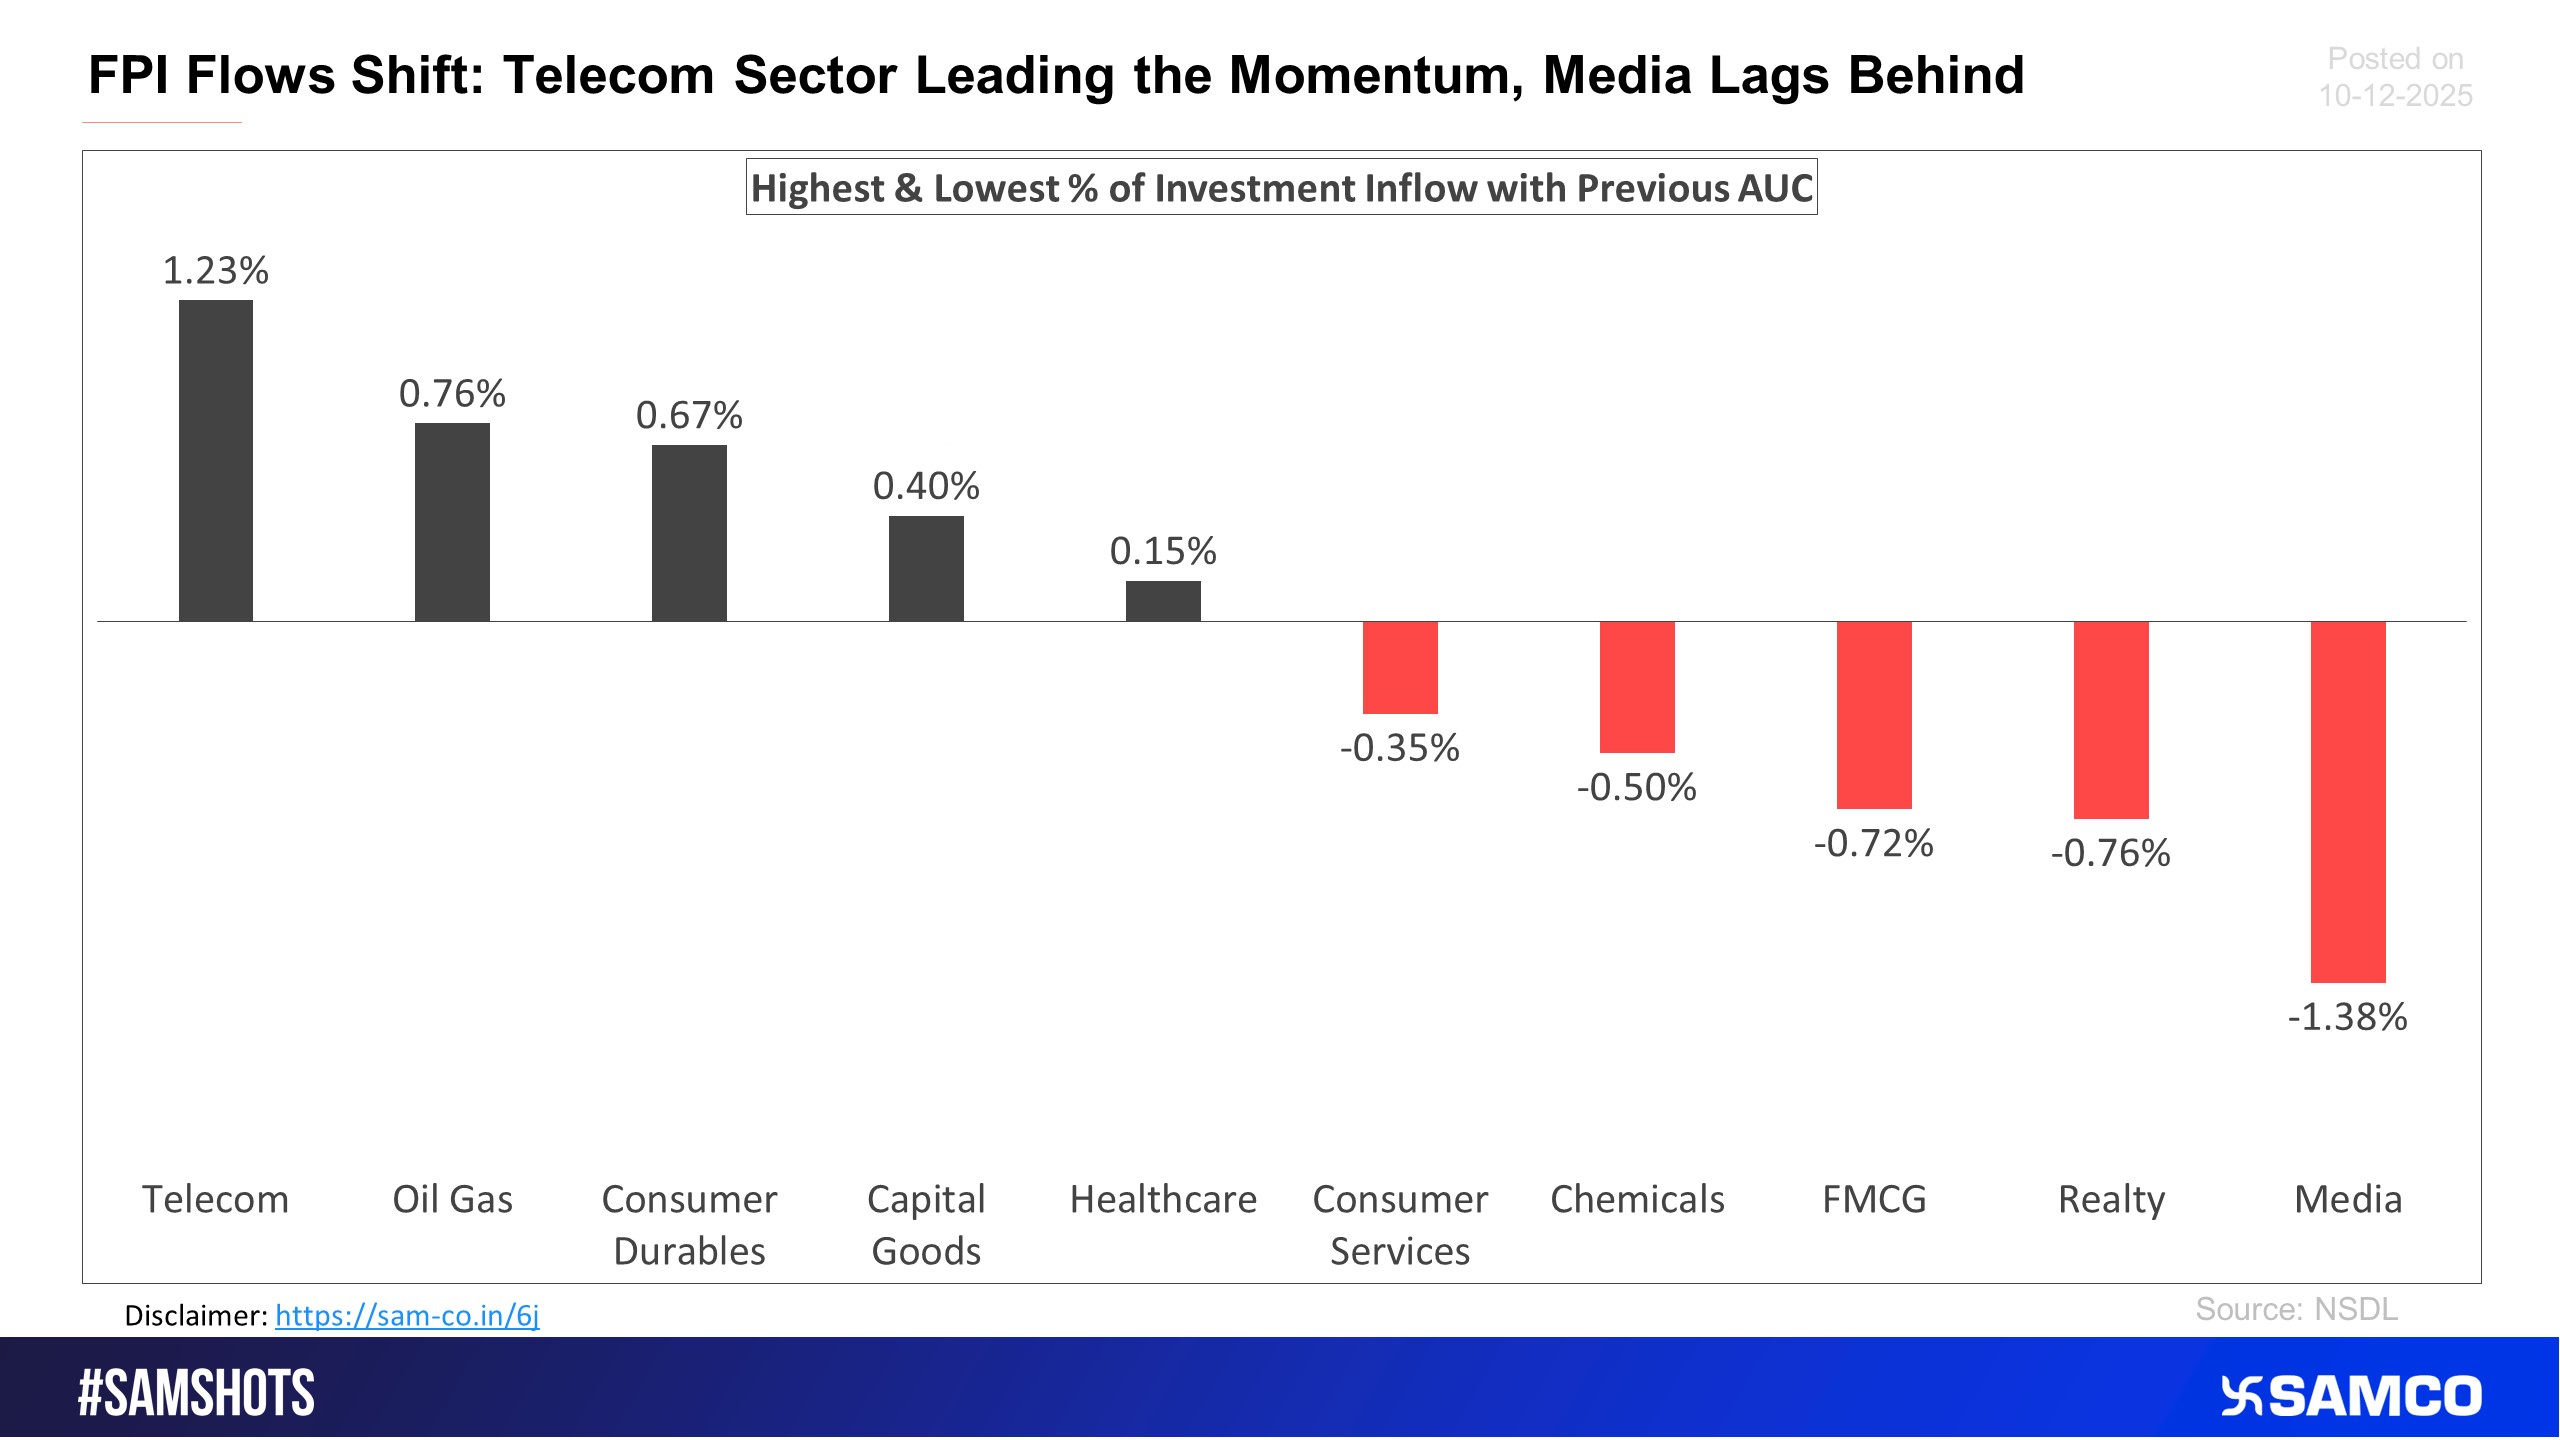
The below chart presents the highest & lowest percentage inflow of investment in the latest fortnight compared to the previous period AUC (Asset Under Custody) of FPI.


 Easy & quick
1. Register on SCORES portal
2. Mandatory details for filling complaints on SCORES
Name | PAN | Address | Mobile | Number | E-mail ID
3. Benefits
Effective Communication
Speedy redressal of the grievances
