


Business Overview
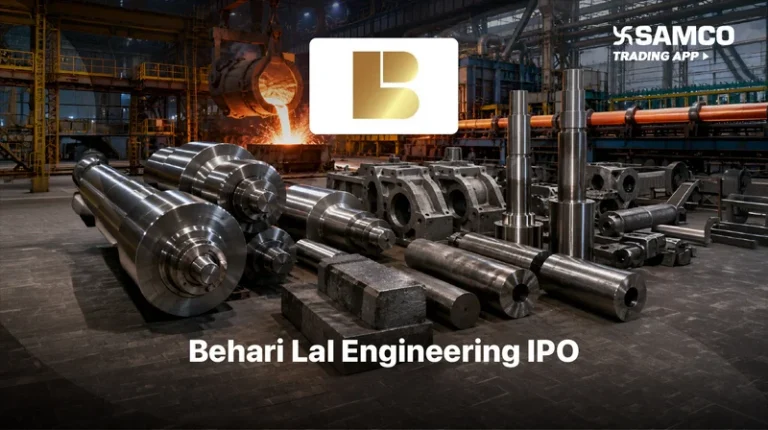
Behari Lal Engineering Limited is an integrated iron and steel manufacturing company specialising in customised engineering solutions, operating out of Mandi Gobindgarh, Punjab. The Company manufactures four categories of precision engineered components — metal rolls for rolling mills across grades including alloy cast steel, adamite, graphitic steel and S.G. iron; engineering castings in special grades weighing 500 kg to 20 MT; carbon, alloy and stainless steel bars in sections from 6 mm to 230 mm; and forging ingots and forged shafts/blocks of 500 kg to 15 tonnes. In Fiscal 2026 alloy steel products contributed ₹244.61 crore or 45.81% of revenue from operations, metal rolls ₹140.74 crore or 26.35%, engineering castings ₹104.34 crore or 19.54% and forging ingots and forged shafts/blocks ₹23.48 crore or 4.40%. According to CRISIL, the Company is one of India’s largest metal rolls producers, meeting 10.00–11.5% of the country’s demand in Fiscal 2026.
The Company commenced its journey in the steel industry in 1995 as a steel trader before establishing itself as a manufacturer, and has since built a fully integrated digital steel melting shop with ladle refining furnace and vacuum degassing, a foundry, heat treatment facilities, machine shops and rolling mills. Its facilities hold ISO 9001-2015, ISO 14001:2015 and ISO 45001:2018 certifications, a BIS licence under ISO 14650:2023 and IS 2062:2011, a Central Boilers Board ‘Certificate for Approval of Well known steel makers’ for boiler quality ingots up to 15 MT per piece, PED 2014/68/EU compliance, ZED certification and green steel certificates. Following a scheme of amalgamation, Belco Special Steels Private Limited became the Company’s Rolling Mill Division and Parkash Multimetals Private Limited was absorbed into its SMS and Foundry Division.
The Company operates 2 manufacturing facilities in Mandi Gobindgarh spread across approximately 790,000 square feet with a combined installed capacity of 119,690 MT, and has commenced construction of a third facility at Village Salani, Tehsil Amloh. It had catered to 1,825 customers as of March 31, 2026 and has exported to 21 countries across 5 continents. As on May 31, 2026 the Order Book stood at ₹178.57 crore and the workforce comprised 667 trained employees and 359 persons engaged on a contract basis. Revenue from operations grew at a CAGR of 9.41% and profit after tax at a CAGR of 34.38% between Fiscal 2024 and Fiscal 2026, reaching ₹534.03 crore and ₹64.64 crore respectively in Fiscal 2026.
IPO Details
| Particulars | Details |
|---|---|
| IPO Date | August 12, 2026 to August 14, 2026 |
| Issue Type | Book Built Offer (Fresh Issue and Offer for Sale) |
| Listing Date | August 19, 2026 (BSE and NSE) |
| Face Value | ₹10 per equity share |
| Price Band | ₹271 to ₹285 per equity share |
| Lot Size | 52 equity shares |
| Minimum Retail Investment | ₹14,820 (52 shares at the cap price) |
| Issue Size | ₹302 crore (1,05,83,158 equity shares) |
| Fresh Issue | ₹93.00 crore (32,63,157 equity shares) |
| Offer for Sale | ₹209 crore (73,20,001 equity shares) |
| Post-Issue Market Cap | ₹1,205.62 crore (at the cap price) |
| Promoter & Promoter Group Holding | Pre-Issue 88.51% / Post-Issue 70.84% |
Objects of the Offer
The Company proposes to utilise the Net Proceeds of the Fresh Issue towards the following objects. The Company will not receive any proceeds from the Offer for Sale.
| Issue Objects | Estimated Amount (₹ Cr.) |
|---|---|
| Purchase and installation of new equipment / machinery, including computers, printers and computer peripherals, along with civil work for such installation at Manufacturing Facility 1 | 19.59 |
| Purchase and installation of new roof-top solar panels at Manufacturing Facility 1 | 3.40 |
| Purchase and installation of new equipment / machinery along with civil work for such installation at Manufacturing Facility 2 | 36.65 |
| Purchase and installation of new roof-top solar panels at Manufacturing Facility 2 | 3.40 |
| Repayment and/or pre-payment, in full or part, of certain borrowings availed by the Company | 0.57 |
| General corporate purposes | NA |
Key Strengths and Opportunities
-
Long Standing Relationships with a Large Customer Base Across a Wide Array of End-User Industries
Revenue from repeat customers was ₹452.28 crore, ₹437.30 crore and ₹357.05 crore in Fiscal 2026, Fiscal 2025 and Fiscal 2024, constituting 84.69%, 86.10% and 80.04% of revenue from operations. The Company had catered to 1,825 customers up to the end of Fiscal 2026 against 1,681 in Fiscal 2025 and 1,544 in Fiscal 2024, and retained 364 customers from the preceding year, a retention rate of 62.98% which has held between 62.56% and 63.42% across the three years. The RHP lists 21 key customers associated with the Company for more than 5 years each, of which Madhav KRG Limited has been a customer for 14 years and Mangala Ispat Jaipur, Shyam Metalics and Energy and Kashmir Ispat for 12 years each. Onboarding as a supplier to global original equipment manufacturers involves identification of the supplier, assessment and audit of technical capabilities, registration, and evaluation and testing of product qualifications. According to CRISIL, these stringent processes, long gestation periods and compliance standards deter new entrants and confer preferential access to regulated and critical end-use markets. -
Diversified Product Portfolio Catering to Varied Application Industries
The product portfolio spans four categories — metal rolls, engineering castings, alloy steel products and forging ingots and forged shafts/blocks — with applications in over 10 industries including aerospace and defence, aggregate crusher manufacturing, automobile, cement, engineering, finished steel manufacturing, infrastructure, power and railways. In Fiscal 2026 alloy steel products contributed ₹244.61 crore or 45.81% of revenue from operations, metal rolls ₹140.74 crore or 26.35%, engineering castings ₹104.34 crore or 19.54% and forging ingots and forged shafts/blocks ₹23.48 crore or 4.40%. By end-user industry, automobiles accounted for ₹206.39 crore or 38.65% of Fiscal 2026 revenue, infrastructure ₹110.45 crore or 20.68%, aggregate crusher manufacturing ₹98.02 crore or 18.35% and engineering – industrial equipment ₹90.00 crore or 16.85%. Revenue from engineering – industrial equipment rose from ₹20.98 crore in Fiscal 2024 to ₹90.00 crore in Fiscal 2026, broadening the base beyond the traditional automobile and infrastructure end-markets. -
Strategically Located and Flexible Manufacturing Facilities Supporting High Capacity Utilisation
The 2 manufacturing facilities at Mandi Gobindgarh are spread across approximately 790,000 square feet with a combined installed capacity of 119,690 MT, comprising finished steel processing capacity of 54,690 MT and rolling mill capacity of 65,000 MT. Total capacity utilisation was 87.71% in Fiscal 2026, 90.30% in Fiscal 2025 and 85.47% in Fiscal 2024, with the SMS and Foundry Division running at 94.47% in Fiscal 2026 on production of 51,664 MT. According to CRISIL, many competitors focus on a single product, whereas the Company’s manufacturing and machining processes are overlapping and fungible, allowing installed capacity to be redirected across alloy steel products, engineering castings and metal rolls depending on the product being manufactured in a given period. Mandi Gobindgarh offers connectivity via National Highway 44 and State Highway 12A, with 2 dry ports around 40 km away and Chandigarh International Airport 60 km away, and access to the Amritsar-Kolkata Industrial Corridor. -
Track Record of Financial Performance and Consistent Growth
Revenue from operations rose from ₹446.08 crore in Fiscal 2024 to ₹507.91 crore in Fiscal 2025 and ₹534.03 crore in Fiscal 2026, while EBITDA rose 66.15% over the same period from ₹60.99 crore to ₹101.33 crore and profit after tax rose 80.61% from ₹35.79 crore to ₹64.64 crore. EBITDA margin expanded from 13.67% to 16.01% to 18.97% and PAT margin from 8.02% to 10.43% to 12.10% across the three years. EBITDA per tonne improved from ₹7,433.60 in Fiscal 2024 to ₹9,125.51 in Fiscal 2025 and ₹11,494.66 in Fiscal 2026, a 54.63% increase over two years. Net worth grew from ₹193.66 crore to ₹306.10 crore while net debt fell from ₹40.74 crore to ₹16.64 crore, taking the debt-equity ratio to 0.06 times from 0.21 times. Return on capital employed stood at 27.11% and return on equity at 23.60% in Fiscal 2026, against 21.98% and 22.83% respectively in Fiscal 2024.
Key Risks
-
Declining Revenue from the Largest End-User Industry
Automobiles, the Company’s largest end-user industry, contributed ₹206.39 crore or 38.65% of Fiscal 2026 revenue from operations, down in absolute terms from ₹248.07 crore or 55.61% in Fiscal 2024. The top four end-user industries — automobiles, infrastructure, aggregate crusher manufacturing and engineering – industrial equipment — together accounted for 94.53% of Fiscal 2026 revenue. If the decline in automobile revenue continues and is not offset by other industries, financial condition, business and growth prospects could be adversely affected. -
Raw Material Cost Is the Largest Expense and Is Procured Without Long-Term Supply Arrangements
Cost of materials consumed was ₹280.66 crore, ₹271.65 crore and ₹274.52 crore in Fiscal 2026, 2025 and 2024, constituting 61.02%, 60.78% and 68.62% of total expenses. Scrap and ferro alloys are sourced from domestic and international suppliers through purchase orders only, with imports of ₹10.29 crore in Fiscal 2026 from countries including Canada, China and the UAE. Inability to procure quality raw materials at commercially acceptable rates in a timely manner could adversely affect the ability to meet customer demand. -
Limited Revenue Visibility from the Order Book
The Order Book stood at ₹178.57 crore as on May 31, 2026, and at ₹118.29 crore, ₹93.00 crore and ₹85.55 crore as on March 31 of 2026, 2025 and 2024 respectively. The RHP states that the Order Book is neither indicative of future growth nor a guarantee of future revenues, and that orders may be cancelled, put in abeyance or delayed. If customers renege on purchase orders or payment terms, anticipated revenues may not materialise and recourse to dispute resolution could be time consuming and expensive.
Financial Snapshot
| Key Performance Indicator | Units | FY 2026 | FY 2025 | FY 2024 |
|---|---|---|---|---|
| Revenue from Operations | ₹ Cr. | 534.03 | 507.91 | 446.08 |
| Revenue Growth | % | 5.14 | 13.86 | NA |
| Total Income | ₹ Cr. | 546.52 | 516.30 | 449.96 |
| EBITDA | ₹ Cr. | 101.33 | 81.31 | 60.99 |
| EBITDA Margin | % | 18.97 | 16.01 | 13.67 |
| PAT | ₹ Cr. | 64.64 | 52.95 | 35.79 |
| PAT Margin | % | 12.10 | 10.43 | 8.02 |
| Cash Profit | ₹ Cr. | 79.42 | 62.43 | 48.41 |
| Basic and Diluted EPS | ₹ | 16.56 | 13.56 | 10.07 |
| RoE | % | 23.60 | 24.31 | 22.83 |
| RoCE | % | 27.11 | 28.24 | 21.98 |
| RoNW | % | 21.12 | 21.92 | 18.48 |
| Net Worth | ₹ Cr. | 306.10 | 241.62 | 193.66 |
| Total Borrowings | ₹ Cr. | 17.78 | 7.58 | 41.21 |
| Net Debt | ₹ Cr. | 16.64 | 5.12 | 40.74 |
| Debt to Equity | (x) | 0.06 | 0.03 | 0.21 |
| Debt Service Coverage Ratio | (x) | 5.27 | 9.13 | 1.08 |
| Current Ratio | (x) | 4.28 | 3.82 | 3.06 |
| Net Working Capital | ₹ Cr. | 192.45 | 145.37 | 119.64 |
| Working Capital Days | Days | 132 | 104 | 98 |
| Inventory Days | Days | 57 | 42 | 34 |
| Debtor Days | Days | 60 | 56 | 67 |
| Cash Conversion Cycle | Days | 93 | 72 | 89 |
| Cash Flow from Operations | ₹ Cr. | 27.54 | 61.89 | 37.14 |
| Purchase of PP&E, Intangibles and CWIP | ₹ Cr. | 26.65 | 26.50 | 14.85 |
| Sales Volume | MT | 88,152.20 | 89,103.48 | 82,042.18 |
| Sales Volume Growth | % | (1.07) | 8.61 | 18.76 |
| EBITDA per Tonne | ₹ | 11,494.66 | 9,125.51 | 7,433.60 |
| Total Capacity Utilisation | % | 87.71 | 90.30 | 85.47 |
| Order Book (as on March 31) | ₹ Cr. | 118.29 | 93.00 | 85.55 |
Peer Comparison
| Company | Total Income (₹ Cr.) | P/E (x) | RoNW (%) |
|---|---|---|---|
| Behari Lal Engineering Limited | 534.03 | 17.21 | 21.12 |
| Jayaswal Neco Industries Limited | 7,131.82 | 18.48 | 16.39 |
| AIA Engineering Limited | 4,419.86 | 34.43 | 15.53 |
| Steelcast Limited | 423.17 | 37.99 | 21.89 |
| RHI Magnesita India Limited | 4,019.95 | NA | (10.81) |
| Vardhman Special Steel Limited | 1,754.43 | 23.19 | 9.59 |
| IFGL Refractories Limited | 1,894.25 | 43.46 | 7.93 |
| Kennametal India Limited | 1,170.30 | 62.02 | 13.70 |
Valuation
| Particulars | Details |
|---|---|
| Post-Issue Market Capitalisation | ₹1,205.62 crore |
| Market Cap / Revenue from Operations (FY26) | 2.26 times |
| P/E (at Cap Price, on FY26 diluted EPS) | 17.21 times |
| P/E (at Floor Price, on FY26 diluted EPS) | 16.36 times |
| EV / EBITDA (FY26) | 11.14 times |
| NAV per Equity Share (as on March 31, 2026) | ₹78.41 |
| Post-Issue Book Value per Equity Share | ₹94.34 |
| P/B (at Cap Price, on post-issue book value) | 3.02 times |
| Order Book (May 31, 2026) / FY26 Revenue | 0.33 times |
| Industry P/E (Highest / Lowest / Average) | 62.02 / 18.48 / 31.36 times |
| Average P/E of the 6 Profit-Making Peers | 36.60 times |