

In this article, we will discuss:
- TradingView Charts in the Samco Trading App: A Game Changer for F&O Traders
- Beyond TradingView Charts: Other Tools from Samco to Improve Your Options Trading
- Improve your Options Trading with TradingView Charts and Tools on Samco’s Trading App
Over the past few years, the Indian F&O market has been experiencing a surge in activity. Data reveals a 500% jump in the participation of retail traders between 2019 and 2022, with the numbers growing from 7.1 lakh unique individual traders in FY19 to 45.2 lakh in FY22. This rise is fuelled by several factors like increased awareness, digital platforms offering easy access, and the allure of potentially quick profits.
However, alongside this boom, there’s a sobering reality that presents a stark contrast. A study by the Securities and Exchange Board of India (SEBI) revealed that despite this growing retail participation, a whopping 89% of individual F&O traders — or nearly 9 out of 10 — suffered losses in FY22. What’s worse is the average loss was a significant ₹1.1 lakh.
So, why are so many traders enthusiastically participating in futures and options trading, only to end up with massive losses? Several factors contribute to this disconnect between participation and profitability. They include:
Lack of Adequate Knowledge and Risk Management
F&O instruments are complex and carry high risk, so they’re better suited for traders with a risk-positive approach. However, many retail participants do not adequately understand how derivatives work and which risk management strategies are crucial. Instead, they make impulsive decisions, overtrade and chase quick gains — resulting in significant losses.
Misinterpreting Volatility as Opportunity
Inexperienced traders often view a volatile market as a chance to strike it rich. However, market uncertainty works both ways; while it may magnify profits, it can also exacerbate losses. This misconception often makes traders chase the wrong side of a trade, further compounding losses.
Inadequate Risk Disclosure
Although brokers and exchanges are mandated to provide risk disclosures, these measures are not typically effective. Often, the information is presented in dense, technical language that the average trader may not understand. So, traders remain unaware of the inherent risks in futures and options trading.
Limited Access to Advanced Trading Tools
Many retail-oriented F&O platforms offer only basic charting and analysis tools. This may not be sufficient for complex strategies or in-depth market analysis. Alternatively, while some platforms offer more advanced tools like options Greeks analysis or real-time charts, they often come at a premium. This creates a barrier for cost-conscious traders.
An Effective Solution for Options Trading Success from Samco Securities
The report from SEBI indicates a massive disparity between the expectations and the reality for retail traders. This disparity in access to sophisticated tools puts individual traders at a disadvantage when compared to institutional investors, who have more resource-intensive setups.
At Samco Securities, we’re committed to bridging this divide by giving our community of traders access to the best charting tools and insights on our trading app. If you too are suffering losses, you can upgrade your options trading strategies with the right tools from Samco. These tools include charting features, options Greeks, implied volatility and more.
TradingView Charts in the Samco Trading App: A Game Changer for F&O Traders
TradingView has revolutionised the resources available to options traders by offering a suite of comprehensive and user-friendly charting capabilities. Its real-time data, customisable indicators, and a multitude of chart varieties cater to the nuanced needs of options trading, making it a highly sought-after platform.
However, access to TradingView's full range of features typically comes at a cost, and most platforms require a subscription fee. This expense can be a barrier for many traders, especially those who are new to the field or operate with limited capital. In this context, Samco Securities stands out as a notable exception.
By offering TradingView charts for free on our trading app, we have democratised access to these advanced trading tools. This initiative empowers traders at all levels by removing the financial barrier to entry and enhancing the options trading experience.
Let’s take a closer look at the advanced charting tools and options available for traders in the Samco trading community — thanks to our revolutionary partnership with TradingView.
Candles
Candlestick charts visually represent price movements, with each ‘candle’ showing the opening, closing, high and low prices in a trading session. A filled or coloured candle body shows a price decrease, while a hollow body indicates a price increase. These charts help you identify potential bullish or bearish market conditions and make it easier to spot trends and reversals.
Hollow Candles
Hollow candlestick charts are a variation of the standard candlestick charts. Here, increasing prices are represented by hollow candles and decreasing prices, by filled candles. This gives you a clear visual distinction between bullish and bearish periods and makes it easier to identify the market direction, especially in fast-paced trading phases.
Heikin Ashi
Heikin Ashi charts are a variation of candlestick charts. They use the averaged price data to smooth out market noise. This gives you charts that have a cleaner look and makes it easier to identify trends and reversals. Heikin Ashi charts are particularly useful for swing trading and analysing markets that are prone to rapid, short-term fluctuations.
Renko
Renko charts prioritise major price changes and filter out minor price movements, time and volume data. They use ‘bricks’ that appear at 45-degree angles, with each brick representing a predetermined price movement. These charts are useful if you prioritise price movements over time, and can help you identify significant trends as well as resistance/support levels.
Line Break
Line Break charts consist of a series of vertical blocks or lines that represent price movements. These charts ignore the time factor and focus solely on price changes. A new line or block is created only when the price moves significantly. They offer a clear view of the prevailing market sentiment and potential reversals.
Kagi
Kagi charts also focus on price action and ignore time, making them useful in markets where price action is more important than time intervals. They use a series of vertical lines to represent general supply and demand levels. The thickness of the lines changes based on price dynamics, thus providing insights into market trends.
Point & Figure
These charts are unique because they exclude both time and volume from their analysis and focus solely on price movements. They use columns of Xs (for rising prices) and Os (for falling prices) to represent the price direction. This gives you a distinctive view of price trends and resistance/support levels, especially if you have a long-term focus.
Area
Area charts are similar to line charts, but the area below the line is filled with colour. This emphasises the magnitude of values and gives you a sense of the trading volume or quantity beneath the line. Such charts are useful for studying volume or quantity trends over time.
HLC Area
High-Low-Close (HLC) area charts focus on three main data points: the high, low and closing prices. They combine the key elements of line and area charts, with the area between the line (close price) and the lowest point often shown in colour. You can use these charts to focus on daily volatility and closing prices, which are crucial for options trading.
Beyond TradingView Charts: Other Tools from Samco to Improve Your Options Trading
In addition to the TradingView charts that are integrated into the Samco trading app, you also enjoy access to a wide range of other essential insights to improve your options trading strategy. These insights include hidden truths in your past trades, such as your winning and losing strike rates, the average profit and loss sizes for your trades, the average holding period for your winning and losing trades, and the Samco trade score — a proprietary metric that quantifies your trading success.
In addition to these unique hidden insights, you can also access the Options Greeks like the delta, gamma, theta and vega. Here’s how you can leverage these Greeks to improve your options trading strategies.
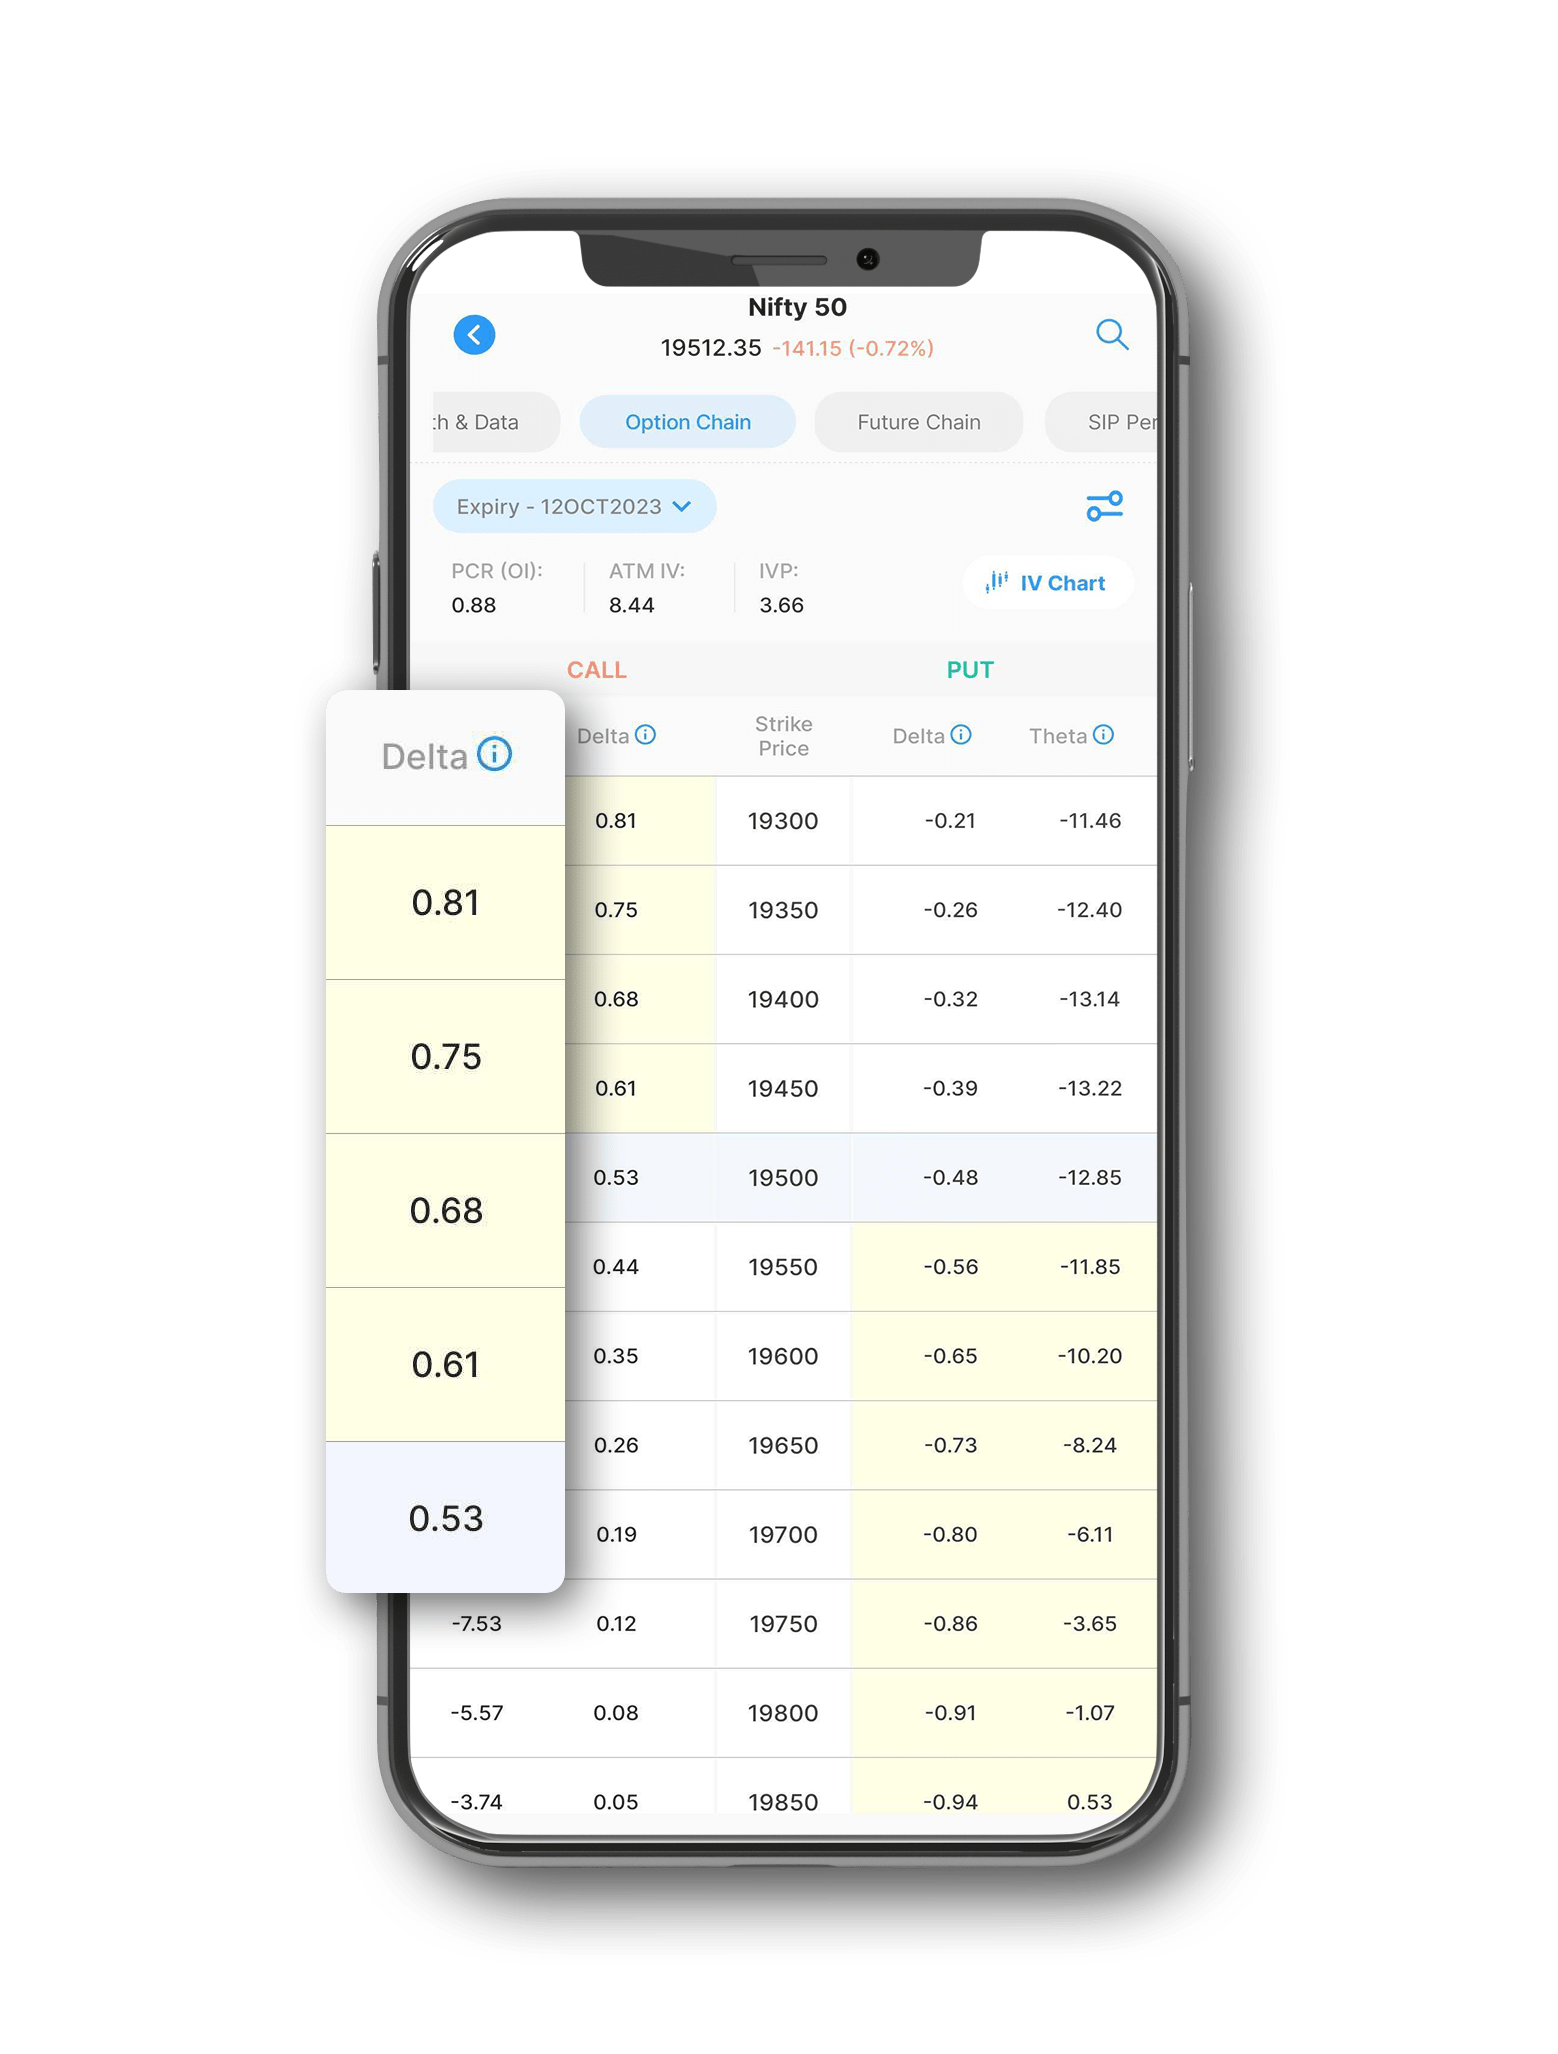
An option’s delta measures how much its price changes for every ₹1 change in the underlying asset's price. The delta can have values from -1 to +1. Negative deltas simply indicate that the option’s price moves in the direction opposite to the underlying asset’s price.
Practical Use in Options Trading : This options Greek can be extremely useful in directional options trading. For instance, if you expect a stock’s price to rise, you can buy call options with a high delta to maximise the profit potential. Conversely, if you expect the price to drop, you may want to buy puts with a high negative delta to improve the potential for profits.
Additionally, this Greek can also be used to create a delta-neutral portfolio, where you balance positive and negative deltas to reduce directional risk in multi-legged options trading strategies.
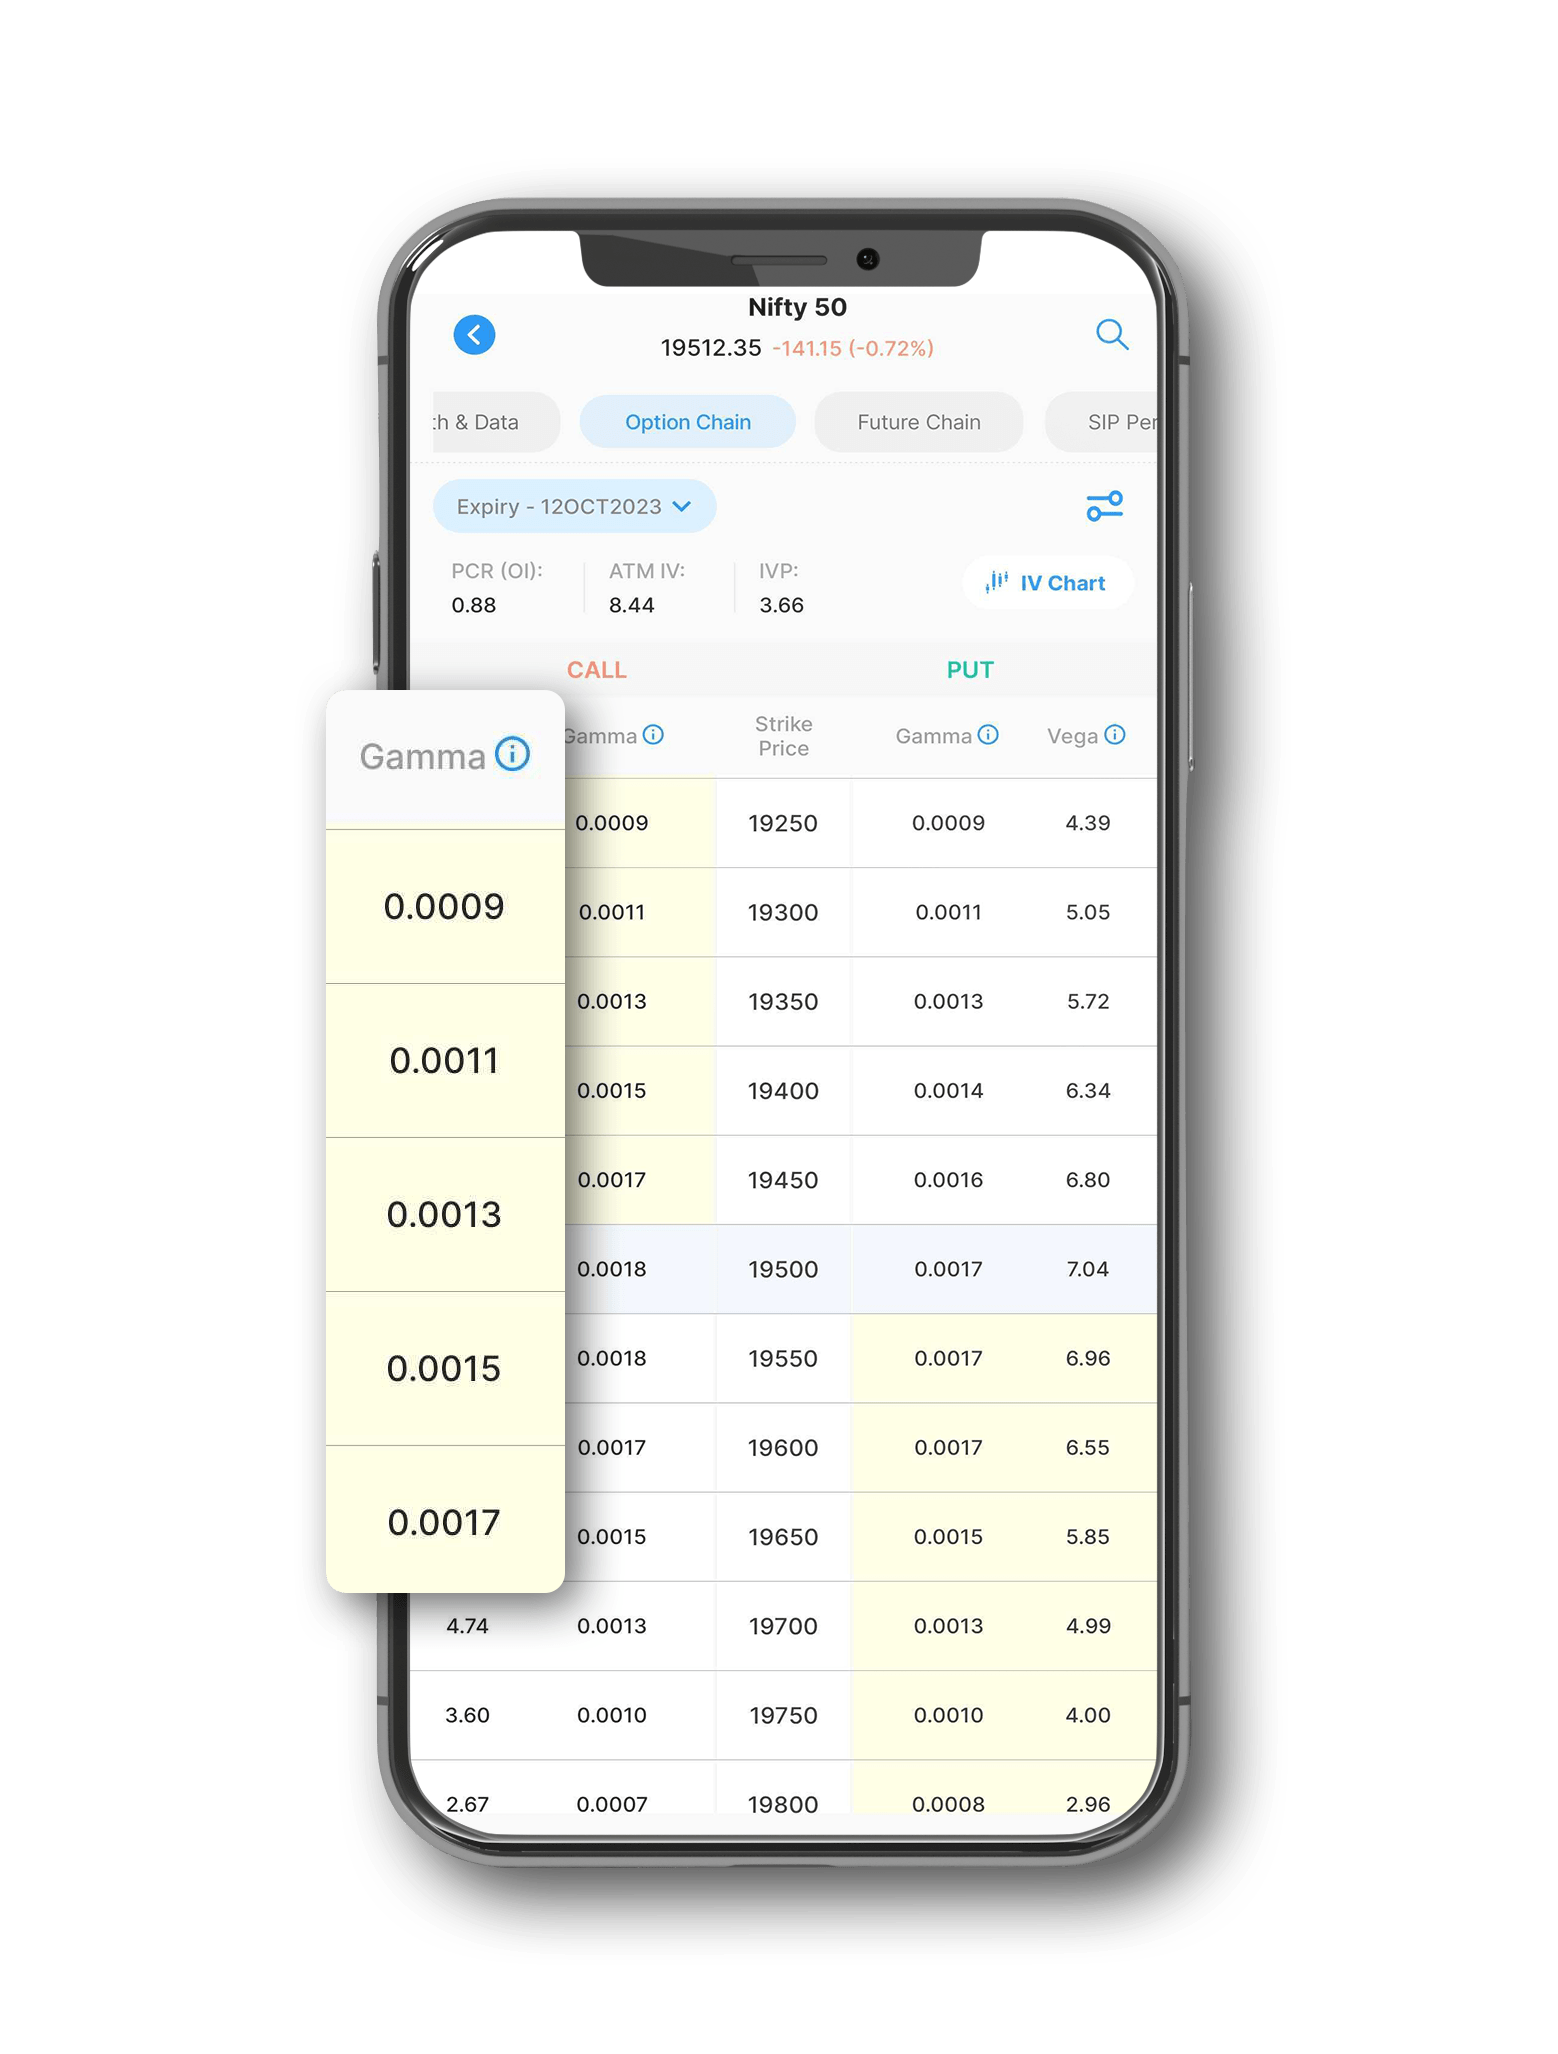
The gamma is a second-order Greek that measures how much an option’s delta changes when the underlying asset's price moves. If the gamma is high, it means the option’s delta rapidly changes in response to the underlying asset’s price movements. Typically, it's the highest for at-the-money options, which are highly sensitive to the underlying asset’s price.
Practical Use in Options Trading : The gamma can help you understand how stable (or not) an option’s delta can be. High gamma values in your options trading position could mean that the delta can change rapidly. This may be beneficial in volatile markets if you can predict the direction of price movements correctly.
However, it also indicates a much higher risk if the market moves in an unfavourable direction. So, if you’re using the gamma to create your options trading strategy, ensure that you monitor your positions closely.
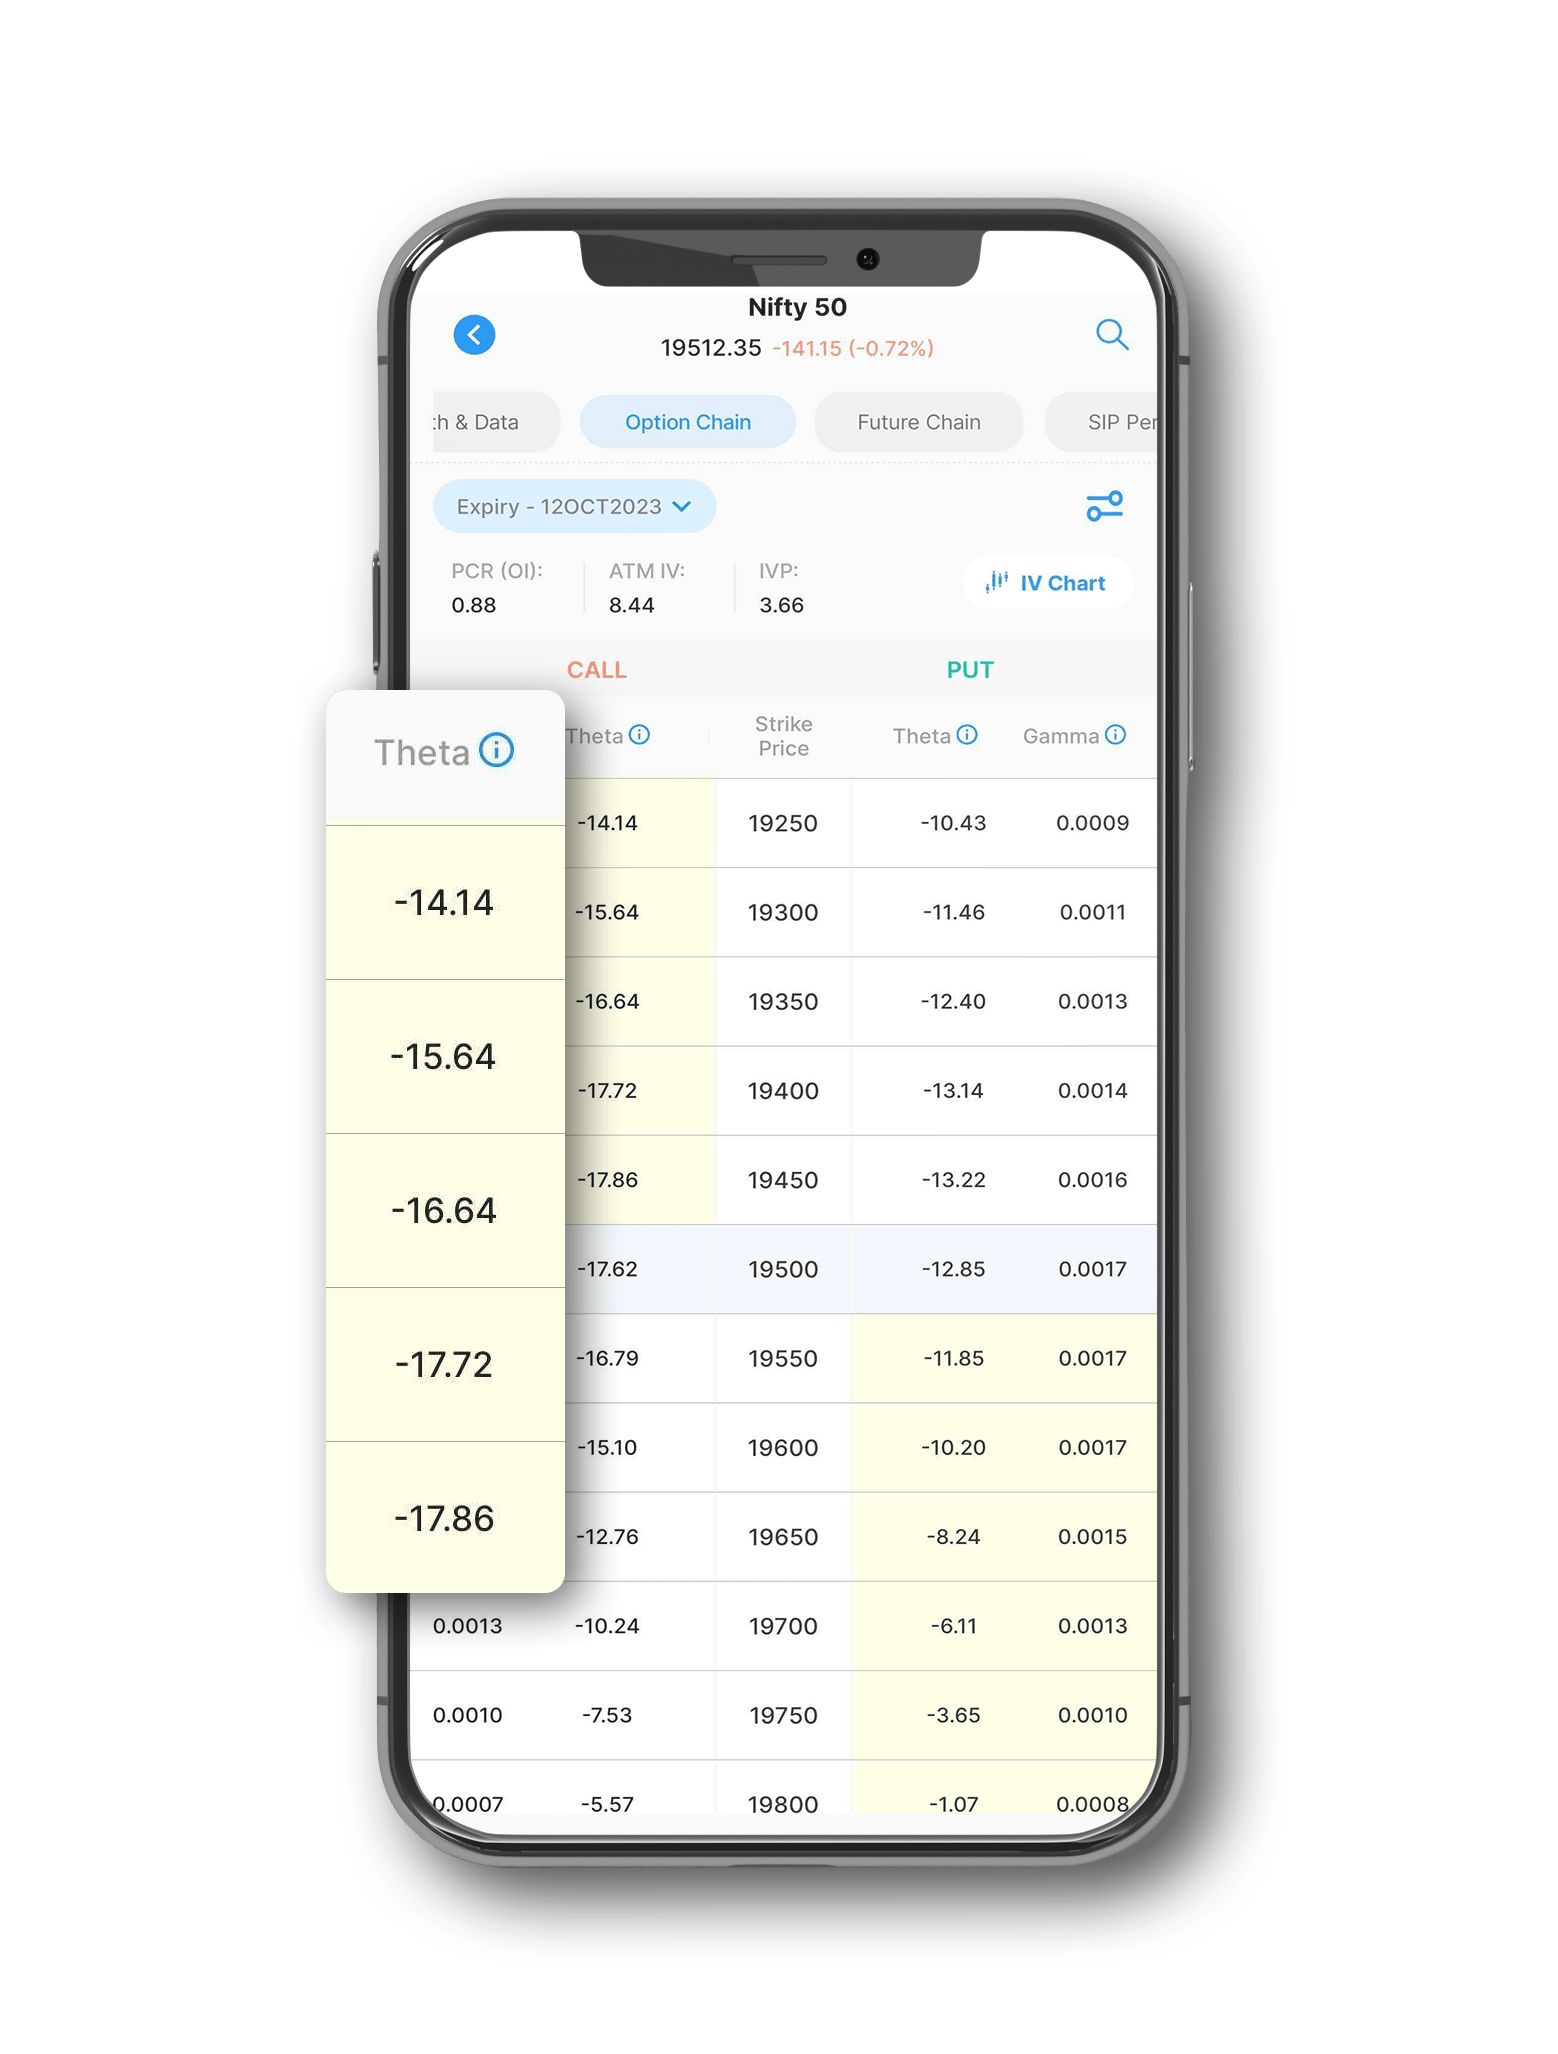
Commonly referred to as the time decay indicator, the theta measures the rate at which an option’s value erodes over time. It’s crucial for options buyers, in particular, because the value of these securities decreases faster as they approach expiration. Furthermore, the theta becomes more relevant as the expiry gets closer.
Practical Use in Options Trading : If you are selling options using covered calls or cash-secured puts, you can capitalise on the theta decay and earn the premium as income. As the seller, you benefit from the passage of time if the underlying asset's price moves in a favourable direction.
However, for long option positions like buying calls or puts, the value of the option decreases each day, even if all other factors remain constant. So, if you are buying options, it's better to opt for securities with a longer expiration period to minimise the theta’s impact.

Vega is an options Greek that measures how sensitive an option's price is to every 1% change in the volatility of the underlying asset. If the vega is high, the option's price is more sensitive to volatility changes (and vice versa). This Greek is always positive because any increase in the underlying asset’s volatility will increase the option’s value.
Practical Use in Options Trading : In a highly volatile market, options with high levels of vega may be more profitable for buyers if the volatility continues to increase. However, if you’re selling options in a market with high volatility, it may work in your favour if the volatility decreases, since it will diminish the option’s value and cause it to expire worthless.
The vega is particularly important in market environments where the volatility is expected to change significantly — such as before earnings announcements or major economic events. So, by factoring in this Greek, you can identify the right to enter or exit an option position.
Improve your Options Trading with TradingView Charts and Tools on Samco’s Trading App
The tools, analytics and charts outlined above are only a fraction of the whole picture. Our new-gen trading app gives you a whole range of other comprehensive insights based on real-time market data as well as your own historical trades. What tops it all off is that these options trading and training tools are all available to you free of cost. You need not pay any additional charges to access these features — which are often only available at a premium on other options trading platforms.
To get the benefit of TradingView charts, Options Greeks, real-time updates and hidden insights — all in one place — switch to the Samco trading app today and improve the outcome of your options trading strategies.
Disclaimer: INVESTMENT IN SECURITIES MARKET ARE SUBJECT TO MARKET RISKS, READ ALL THE RELATED DOCUMENTS CAREFULLY BEFORE INVESTING. The asset classes and securities quoted in the film are exemplary and are not recommendatory. SAMCO Securities Limited (Formerly known as Samruddhi Stock Brokers Limited): BSE: 935 | NSE: 12135 | MSEI- 31600 | SEBI Reg. No.: INZ000002535 | AMFI Reg. No. 120121 | Depository Participant: CDSL: IN-DP-CDSL-443-2008 CIN No.: U67120MH2004PLC146183 | SAMCO Commodities Limited (Formerly known as Samruddhi Tradecom India Limited) | MCX- 55190 | SEBI Reg. No.: INZ000013932 Registered Address: Samco Securities Limited, 1004 - A, 10th Floor, Naman Midtown - A Wing, Senapati Bapat Marg, Prabhadevi, Mumbai - 400 013, Maharashtra, India. For any complaints Email - grievances@samco.in Research Analysts -SEBI Reg.No.-INHO0O0005847


 Easy & quick
Leave A Comment?