


The Nifty-to-Gold ratio—a widely tracked indicator that compares equity performance against the safe-haven metal—is once again nearing its long-term support zone. Historically, this ratio has acted as a reliable signal, with equities staging powerful rallies whenever the ratio has bottomed out.
Historical Precedents
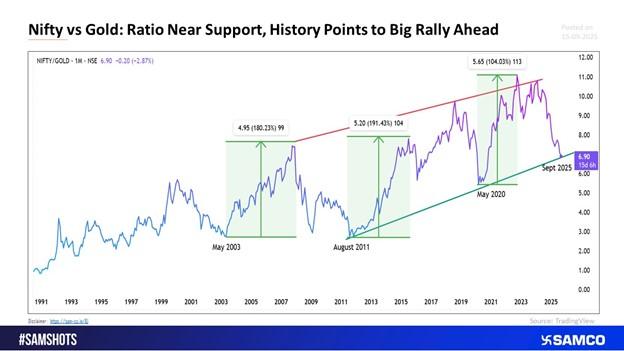
- May 2003: The ratio touched 2.6 levels, after which Nifty delivered a massive 180% gain over 1,677 days (~4.6 years).
- August 2011: Another bottom in the ratio preceded a 190% rally in 1,430 days (~3.9 years).
- May 2020: During the pandemic crash, the ratio again hit support, triggering a 104% surge in just 485 days (~1.3 years).
Current Setup – September 2025
Now, the ratio is once more hovering near its long-term support, raising an important question: Will history repeat itself?
If past cycles are any indication, the setup could be pointing towards another major phase of equity outperformance relative to gold in the quarters ahead.
Investor Takeaway
For investors, this historical context highlights that periods of weakness in the Nifty-to-Gold ratio have consistently been opportunities to favor equities. While gold continues to play its role as a hedge, the risk-reward balance may now be tilting in favor of stocks, with the possibility of a strong equity-led uptrend ahead.


 Easy & quick
Leave A Comment?