When evaluating equity investments, most market participants focus on price trends, earnings, macroeconomic indicators, or valuations. However, Volume in Stock Market is an equally crucial and often underappreciated tool that can provide significant insight into market sentiment, liquidity, and trend strength. For investors and traders aiming for deeper market understanding, incorporating volume analysis is non-negotiable.
What is Volume in Stock Market?
In the stock market, volume refers to the total number of shares traded during a specific time period. Each trade (a buy matched with a sell) is counted once. For example, if 1,000 shares are bought and sold, the volume is 1,000—not 2,000.
High volume in stock market suggests strong investor interest and active participation, while low volume signals weak engagement. Therefore, volume in stock market acts as a barometer of conviction behind price movements.
How Volume is Calculated
Volume = Total Number of Shares Bought and Sold in a Period
For instance, if 500 trades of 1,000 shares occur in a day, the daily volume is 500,000 shares. This simple yet powerful metric allows investors to assess interest levels and market activity.
Volume and Market Liquidity
Volume in stock market is closely tied to liquidity—the ease with which assets can be bought or sold without significant price impact.
- High volume → High liquidity → Easier entry/exit with minimal slippage
- Low volume → Low liquidity → Potential for volatile price swings
This makes volume in stock market essential for assessing risk and trade execution quality.
Buying vs. Selling Volume
Understanding the type of volume is key:
- Buying volume: Trades executed at the ask price, indicating bullish sentiment
- Selling volume: Trades executed at the bid price, signaling bearish pressure
This breakdown helps investors read market intent beyond just price action.
Average Daily Trading Volume (ADTV)
ADTV is the average number of shares traded per trading session and is calculated as:
ADTV = Total Volume ÷ Number of Trading Days
ADTV helps determine:
- Liquidity of a stock
- Trading interest over time
- Abnormal trading activity
Stocks with high ADTV offer better execution and lower volatility risk.
Volume Spikes: Signals of Major Events
A volume spike indicates an unusual surge in activity, often preceding sharp price movements. Triggers can include:
- Earnings announcements
- M&A news
- Analyst upgrades/downgrades
- Regulatory or geopolitical events
A large volume in stock market spike often foreshadows a trend change.
Key Volume Indicators for Market
In addition to simple volume observations, technical analysts use a variety of volume indicators to better understand trading.
Here are some of the most widely used volume indicators :
On-Balance Volume (OBV)
- Purpose: Measures buying and selling pressure by adding or subtracting volume based on price movements.
- Calculation:
- If today's closing price > yesterday's, add today's volume to OBV.
- If today's closing price < yesterday's, subtract today's volume from OBV.
- Use: Confirms trends (rising OBV = bullish, falling OBV = bearish) and detects divergences (price vs. OBV).
Volume Moving Average (VMA)
- Purpose: Smooths out volume data to identify trends in trading activity.
- Calculation: A simple moving average (SMA) or exponential moving average (EMA) of volume over a specified period (e.g., 20 days).
- Use: High volume above the VMA confirms strong trends; low volume suggests weak momentum.
Volume Oscillator
- Purpose: Shows the difference between two VMAs (e.g., short-term vs. long-term) to highlight volume trends.
- Calculation:
- Volume Oscillator = (Short-term VMA − Long-term VMA) / Long-term VMA × 100
- Use: Positive values indicate increasing volume (bullish), while negative values suggest declining volume (bearish).
Accumulation/Distribution Line (A/D Line)
- Purpose: Assesses money flow into/out of a security using price and volume.
- Calculation:
- Money Flow Multiplier = [(Close − Low) − (High − Close)] / (High − Low)
- Money Flow Volume = Multiplier × Volume
- A/D Line = Cumulative sum of Money Flow Volume.
- Use: Rising A/D line = accumulation (buying pressure); falling A/D line = distribution (selling pressure). Divergences signal reversals.
Why Volume in Stock Market is Vital
Trend Confirmation – Rising prices with rising volume indicate strength.
Reversals – Divergences between price and volume suggest trend exhaustion.
Breakouts & Breakdowns – High volume confirms the reliability of breakouts.
Smart Money Activity – Accumulation/distribution zones can be spotted via volume.
Sentiment Gauge – Volume reflects enthusiasm or hesitation.
Strategy Enhancement – Volume supports intraday, swing, and long-term strategies.
Incorporating volume in stock market increases accuracy and confidence in trade decisions.
Case Study: Mazagon Dock Shipbuilders – Volume as a Predictor of Multibagger Opportunity
The chart of Mazagon Dock Shipbuilders Ltd exemplifies how volume in stock market can act as a powerful precursor to explosive price action.
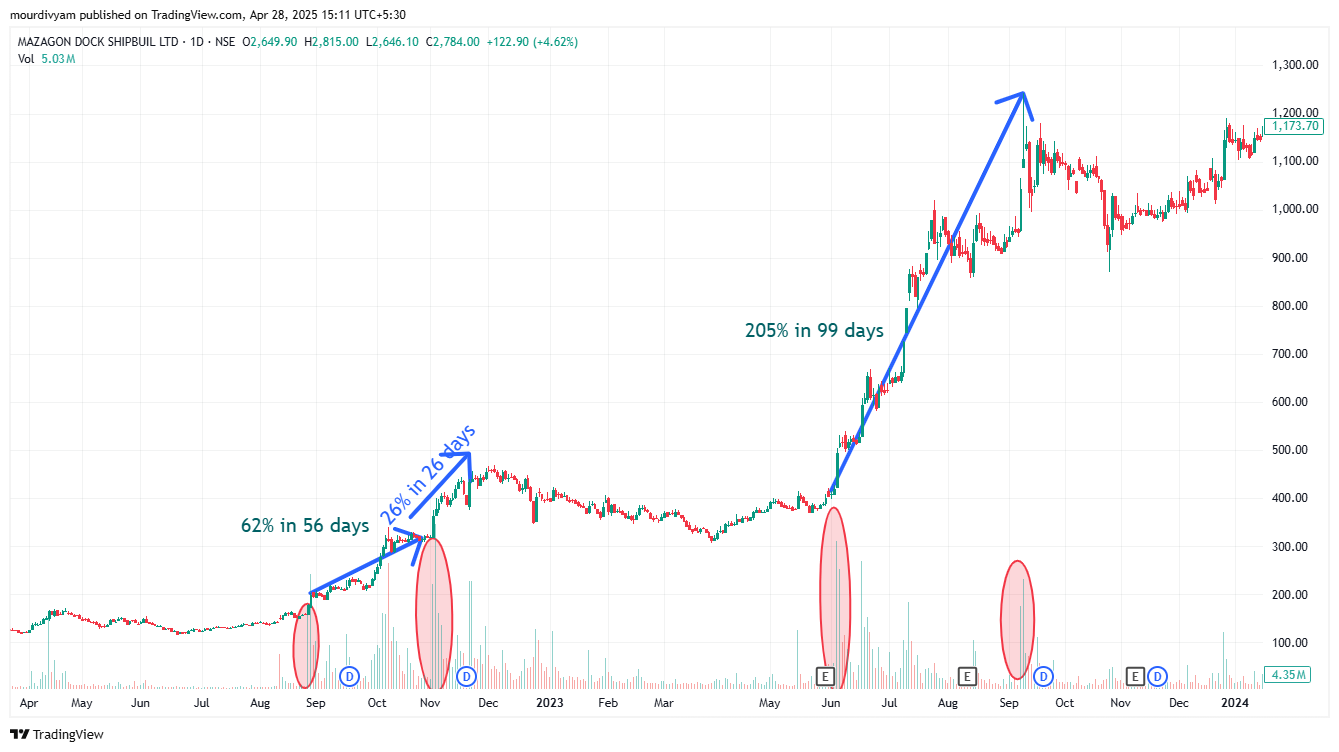
Key observations:
- Early Volume Spike in August 2022 preceded a 62% rally in just 56 days.
- Followed by another surge in volume leading to a 126% rise in 76 days.
- A massive breakout in May 2023 saw the stock skyrocket 205% in just 99 days—once again preceded by a significant rise in volume in stock market.
- Each volume surge occurred post a consolidation phase, suggesting accumulation by institutional investors or “smart money.”
Had investors closely monitored volume in stock market, they could have identified these breakout points early. Volume was the common denominator in each explosive move, highlighting its predictive value in trend identification.
Summary
Volume in stock market is one of the most powerful yet underutilized indicators that offers deep insight into price movements, market sentiment, and liquidity. It represents the number of shares traded in a given period and acts as a confirmation tool for trends, breakouts, and reversals.
High volume typically signals strong participation, validating the strength of a price move. Conversely, price action on low volume often lacks conviction and may reverse. Volume in stock market also distinguishes between accumulation (institutional buying) and distribution (institutional selling), helping investors position themselves with the “smart money.”
Key volume indicators such as On-Balance Volume (OBV), Volume Moving Average (VMA), and the Accumulation/Distribution Line enhance traditional price-based analysis, enabling traders to detect hidden divergences and trend changes early. Average Daily Trading Volume (ADTV) further helps assess a stock’s liquidity and trading consistency.
Ultimately, volume in stock market not only confirms price trends but reveals the intensity behind them. For traders and investors alike, integrating volume analysis into decision-making enhances accuracy, improves timing, and mitigates risk. In a market full of noise, volume provides the signal.


 Easy & quick
Leave A Comment?