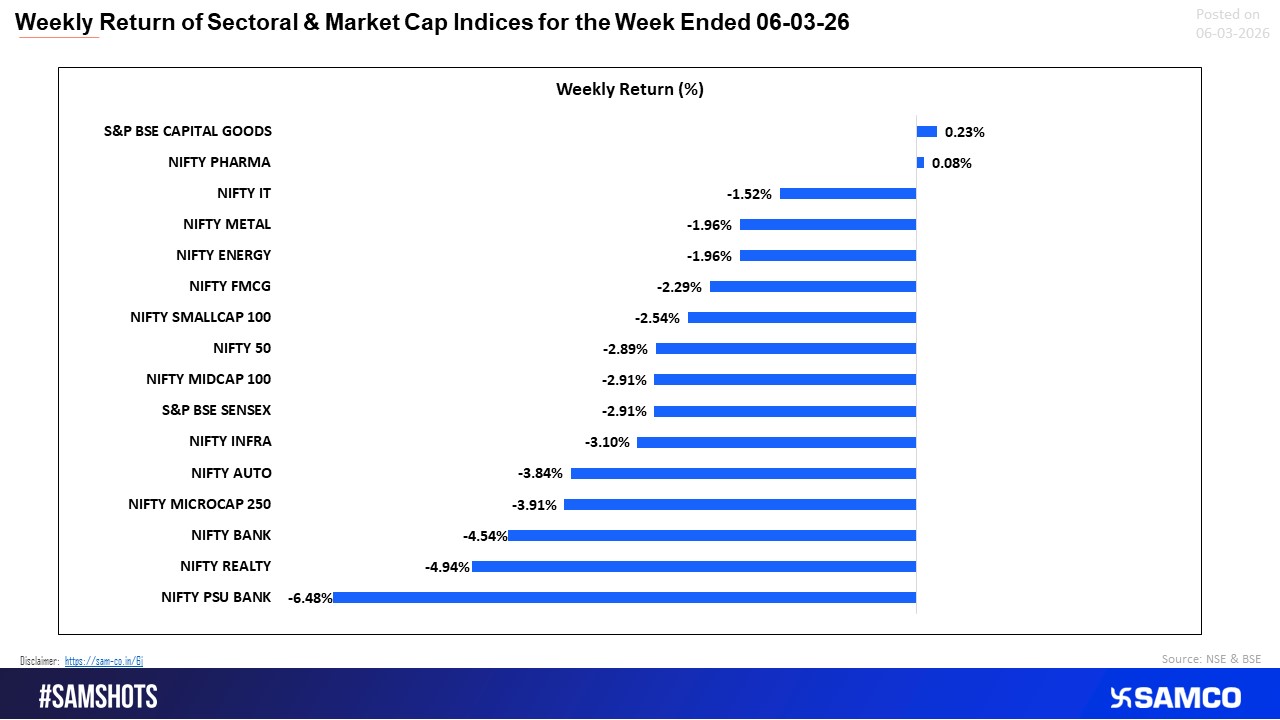
Indian equity markets remained under pressure during the week ended 6 March 2026, as rising geopolitical tensions and sharp moves in global commodities weighed on investor sentiment. Escalation in the US-Iran conflict triggered a global risk-off environment, increasing volatility across financial markets.
Sectorally, weakness was broad-based. PSU Banks, Realty, and Banking stocks led the decline, while Auto, Infra, and Microcap indices also saw notable corrections. The Nifty 50 and Sensex ended the week lower, reflecting cautious sentiment, although Pharma and Capital Goods showed relative resilience and managed marginal gains.
In commodities, gold surged above $5,400/oz on safe-haven demand before retreating to around $5,081/oz as the US dollar strengthened. Silver spiked to nearly ?2,97,000/kg before correcting over 10%, while crude oil rallied sharply, with WTI rising from ~$67 to above $82 and Brent touching $84 amid supply concerns near the Strait of Hormuz.
The Indian Rupee also weakened, with USDINR rising from ~91.03 to 91.72 (+0.76%), briefly touching 92.30 before stabilising, likely supported by RBI intervention. Overall, markets remained volatile as investors tracked geopolitical developments and commodity price movements.
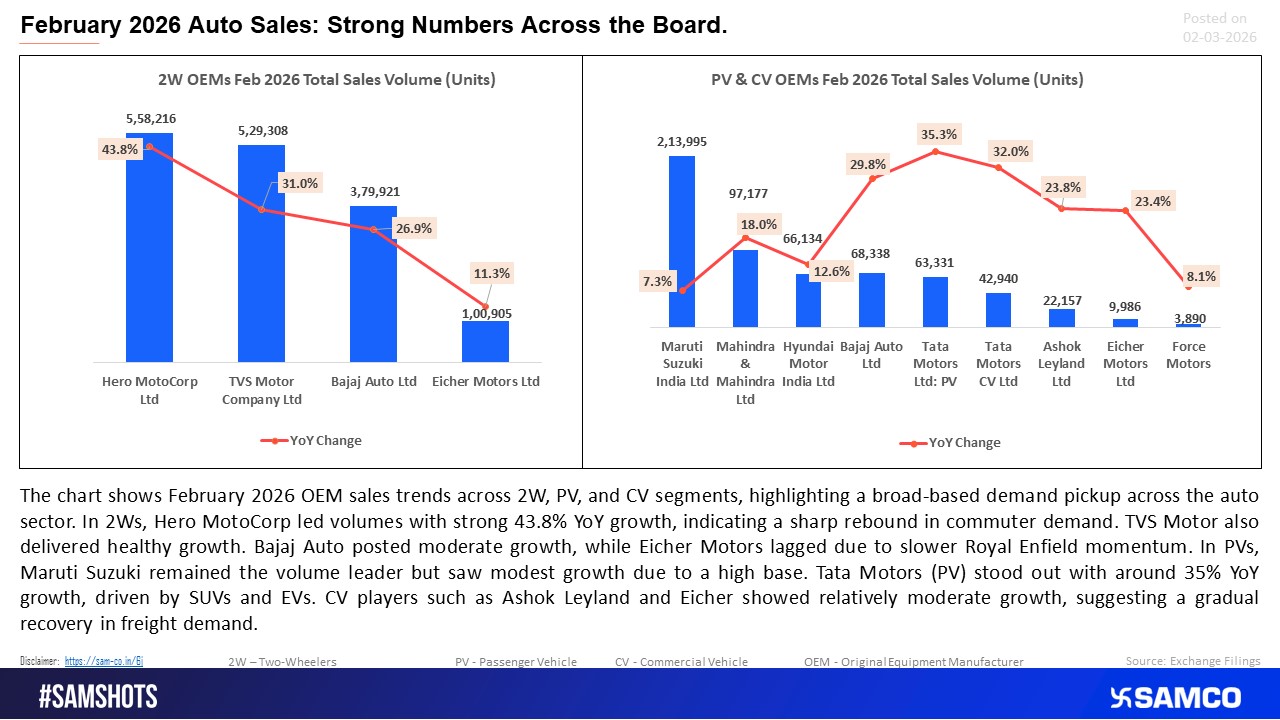
Auto OEMs reported strong February 2026 sales across segments


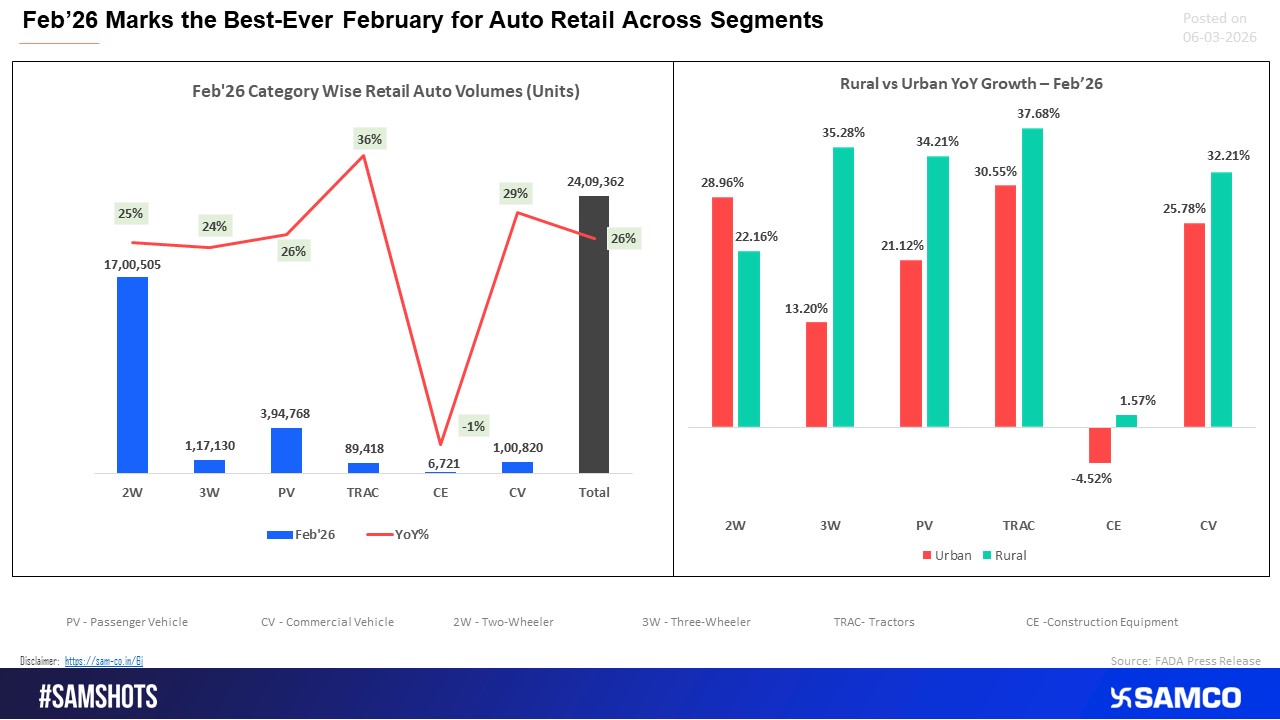
India’s auto retail recorded its best-ever February in 2026
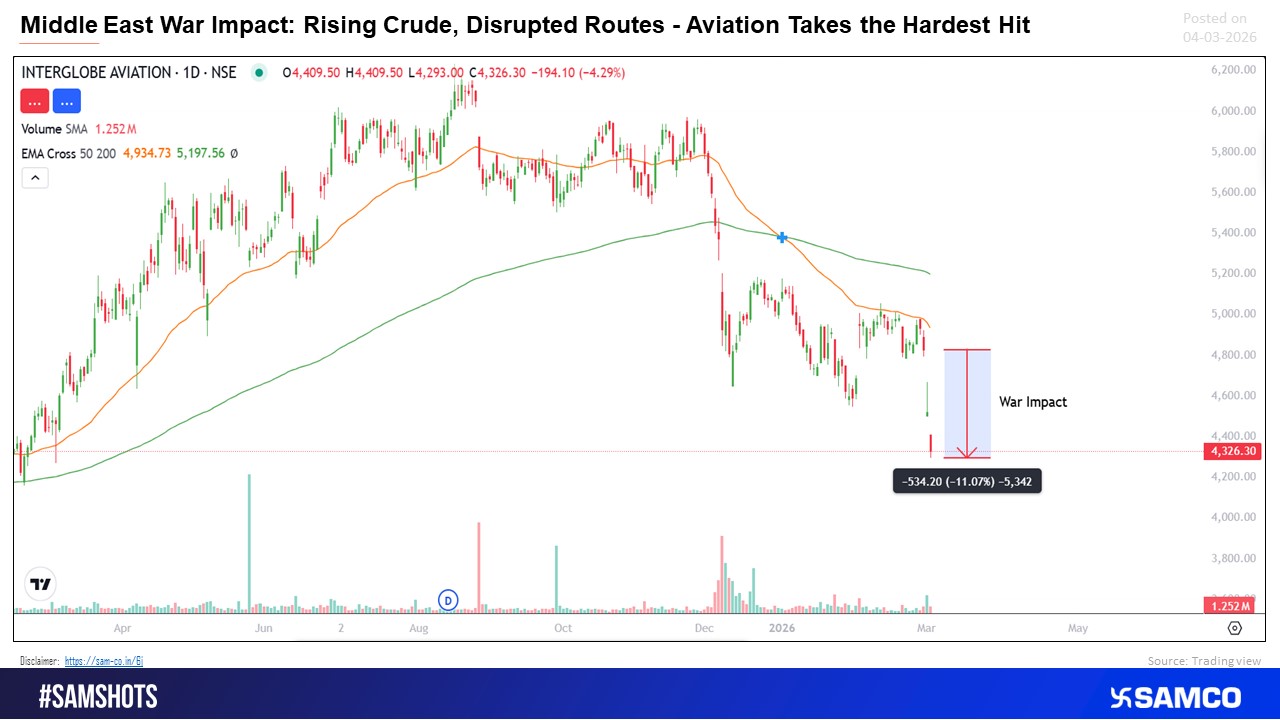
Rising crude prices and disrupted flight routes amid Middle East tensions
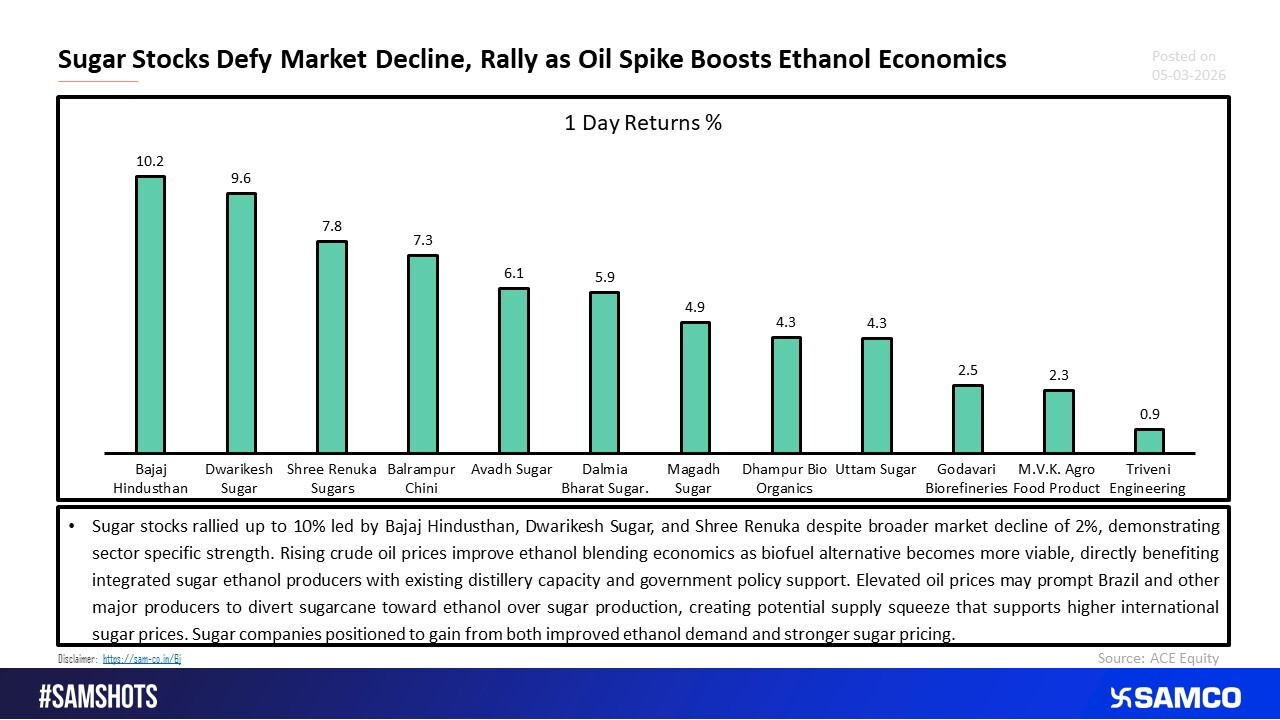
Sugar Stocks Defy Market Decline, Rally as Oil Spike Boosts Ethanol Economics
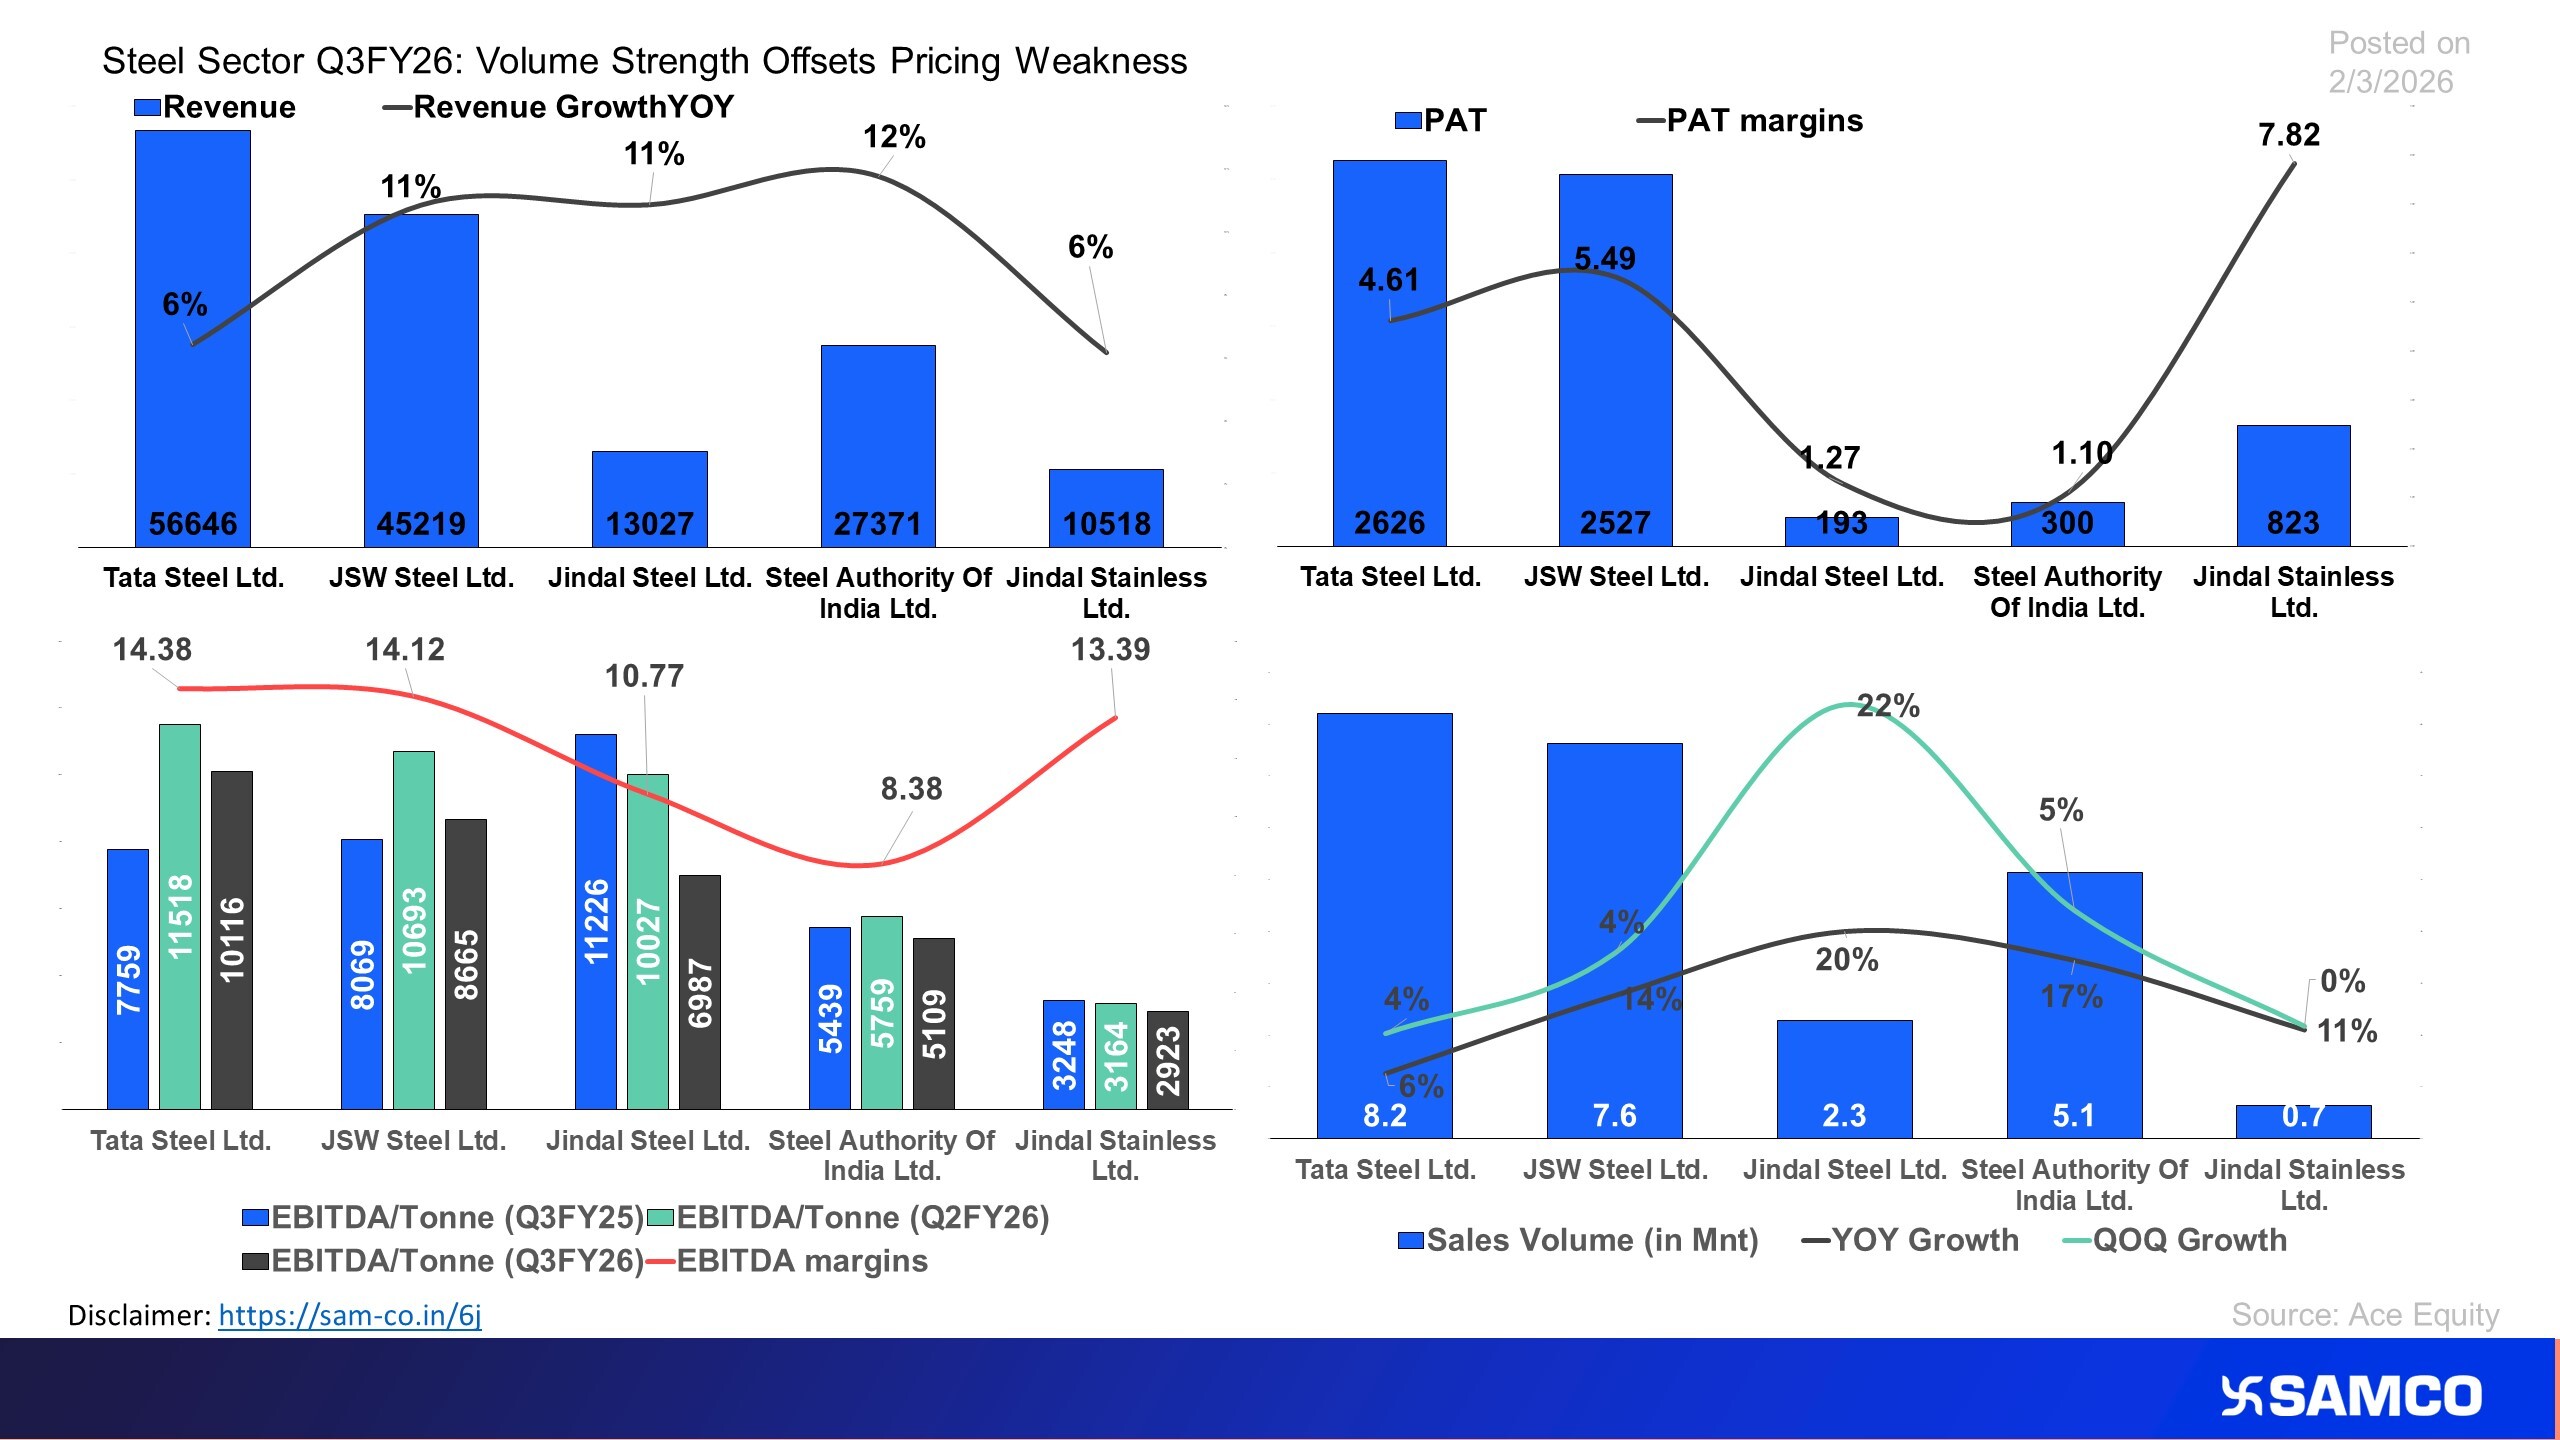
The chart evaluates performance of Steel industries for Q3FY26
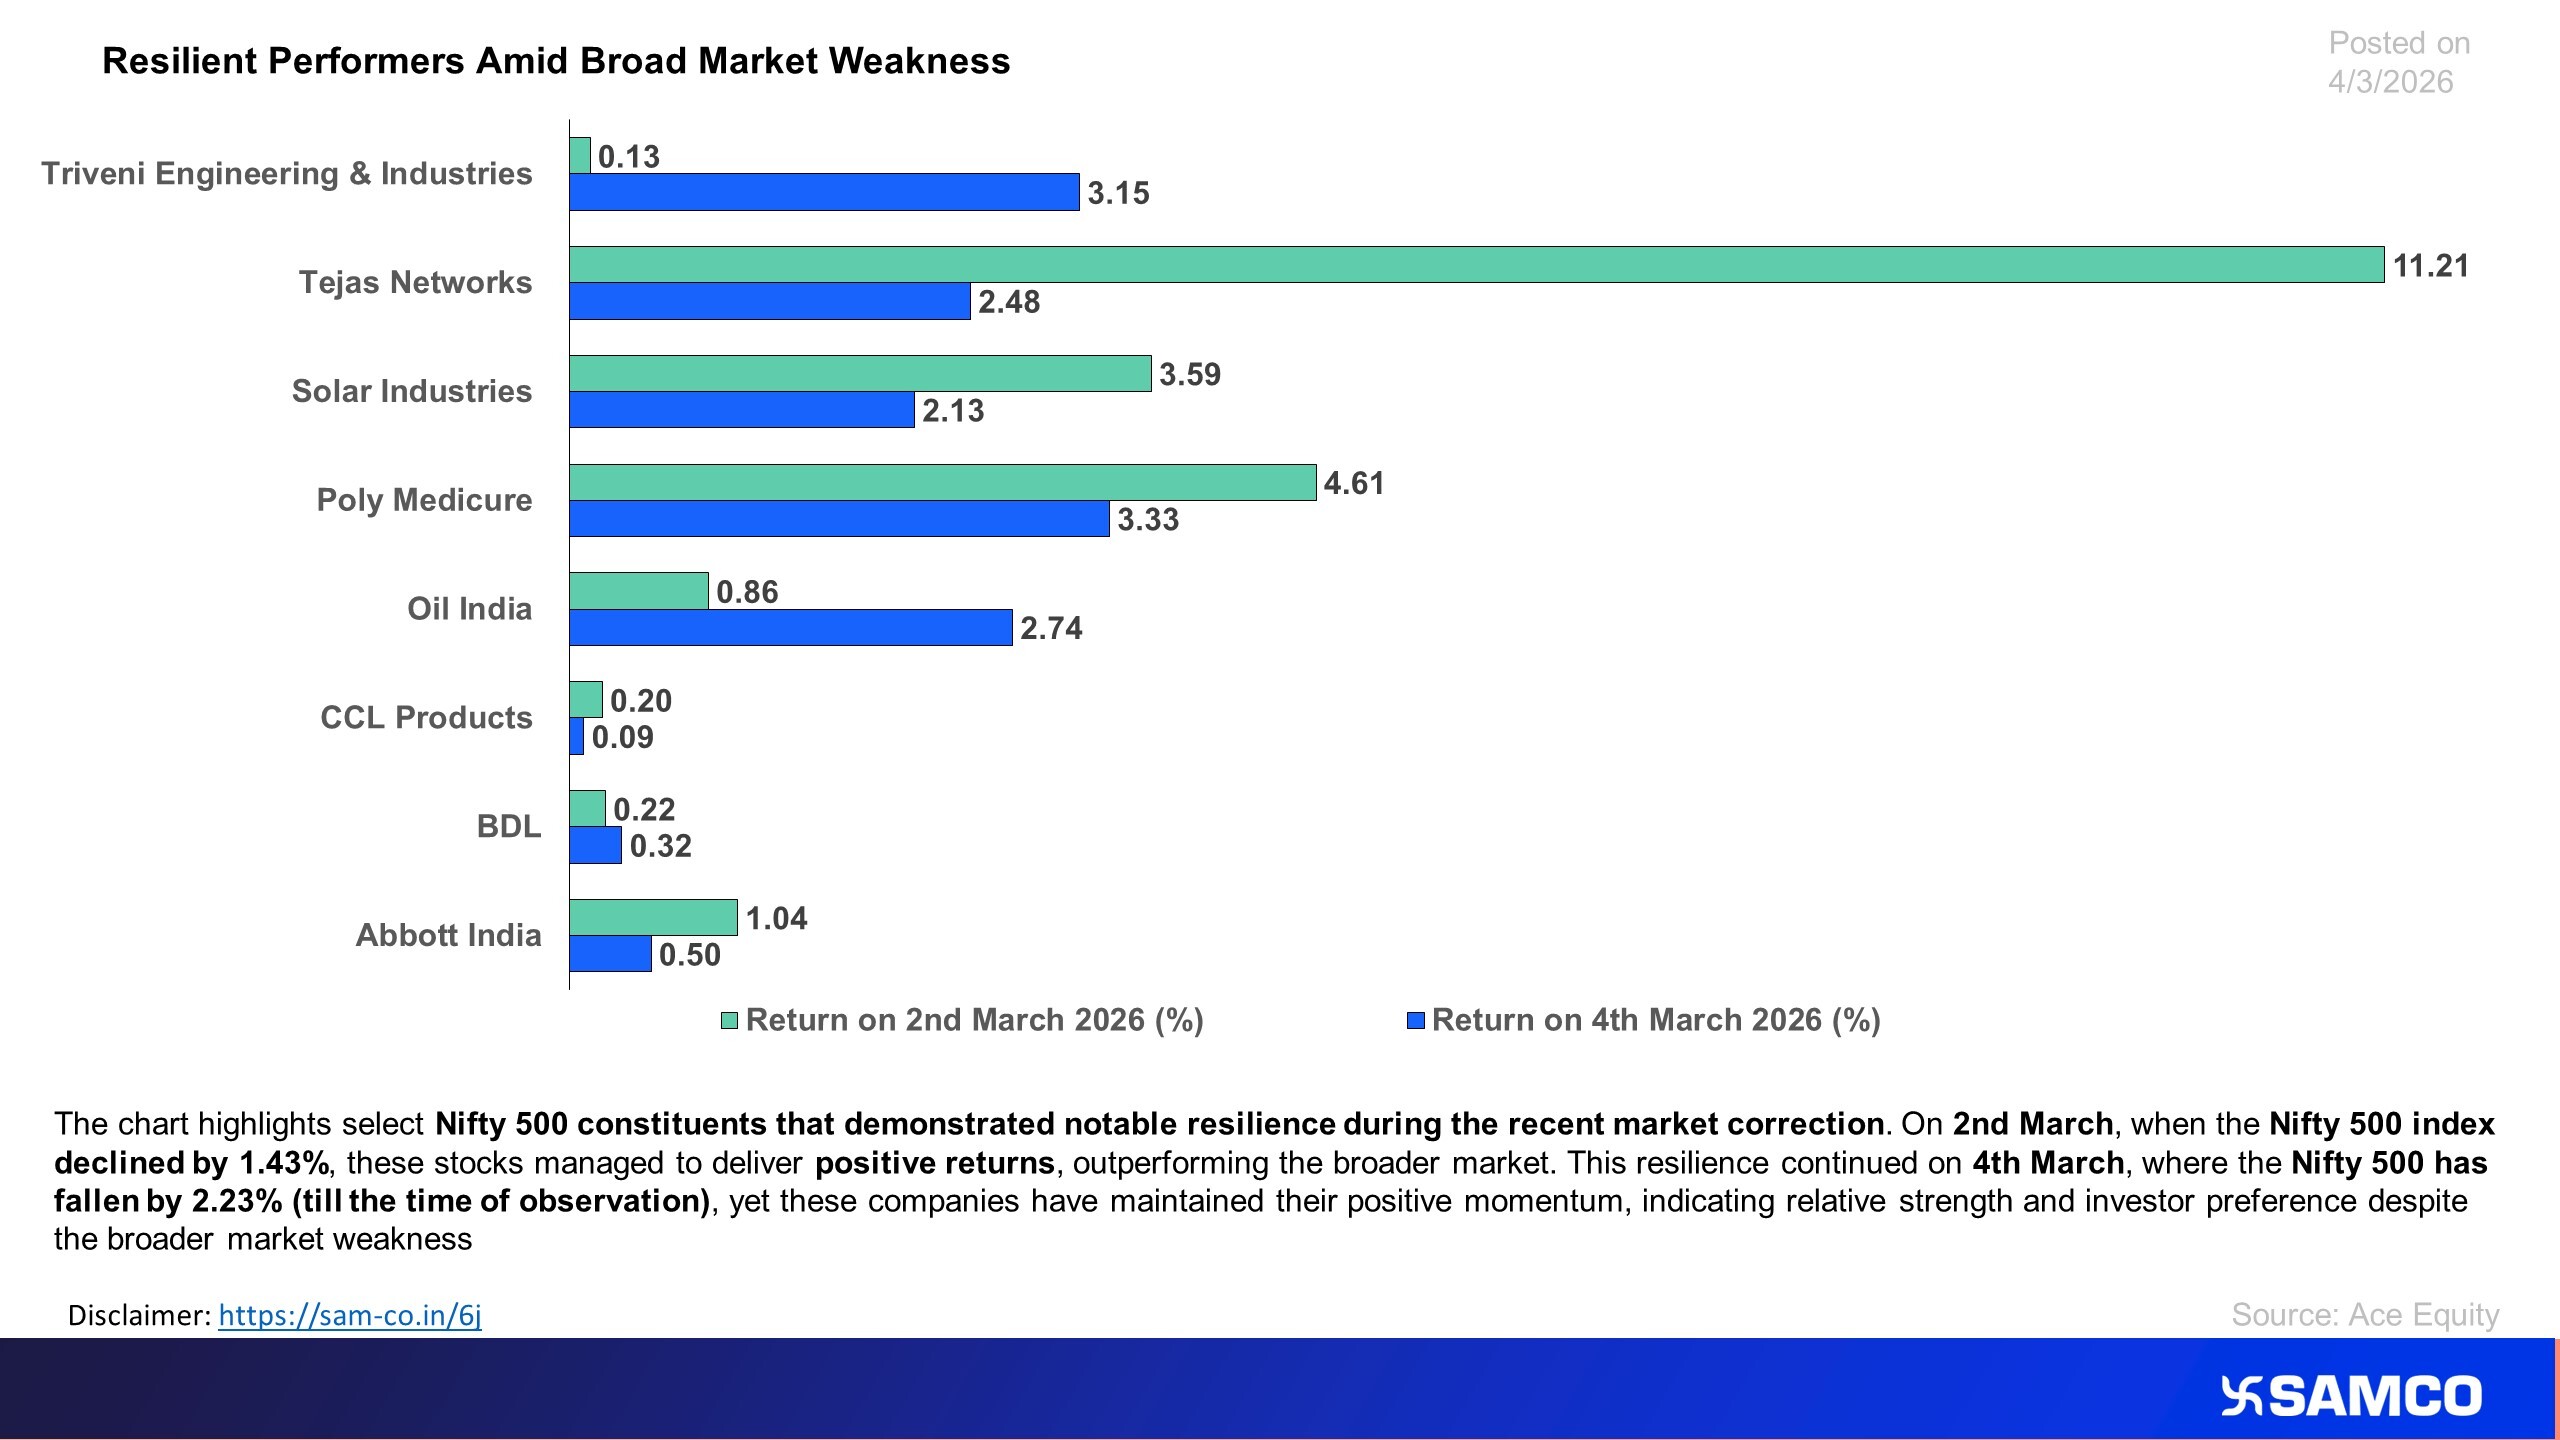
Nifty 500 stocks performing positively against the market
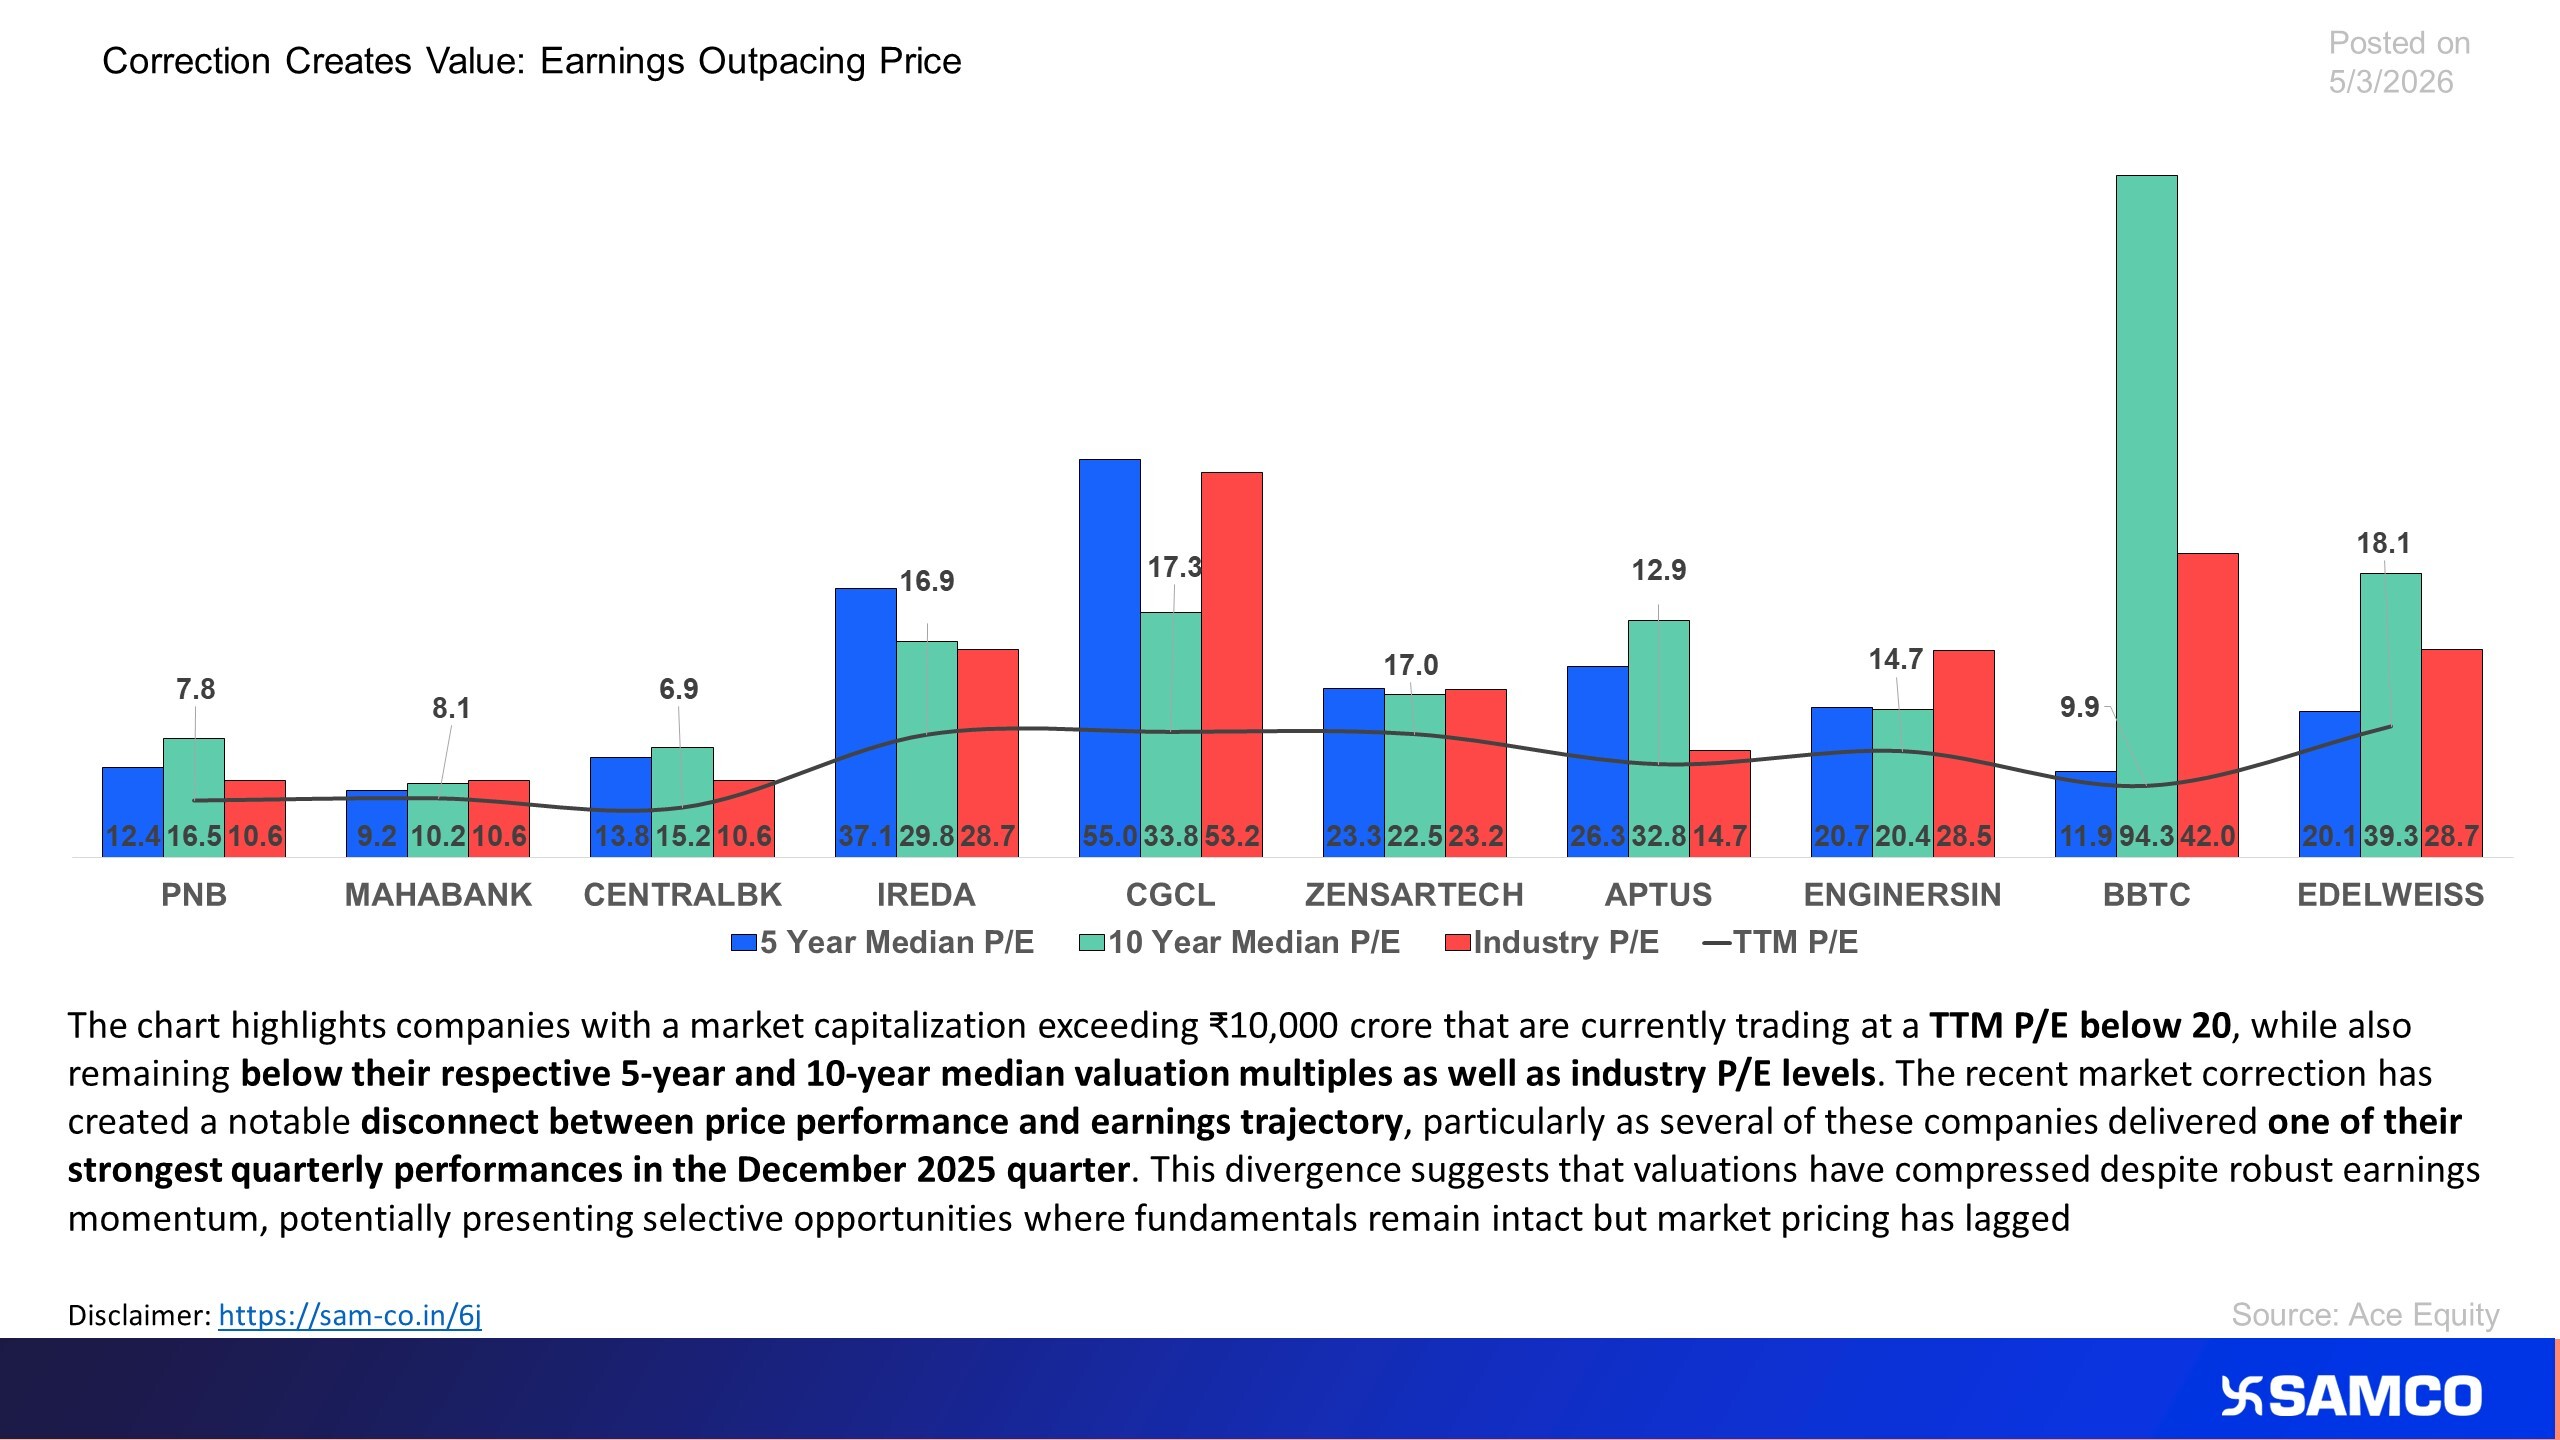
The chart depicts stocks which have posted best quarterly performance yet valuations are low
Broader Indices End the Week Deep in the Red
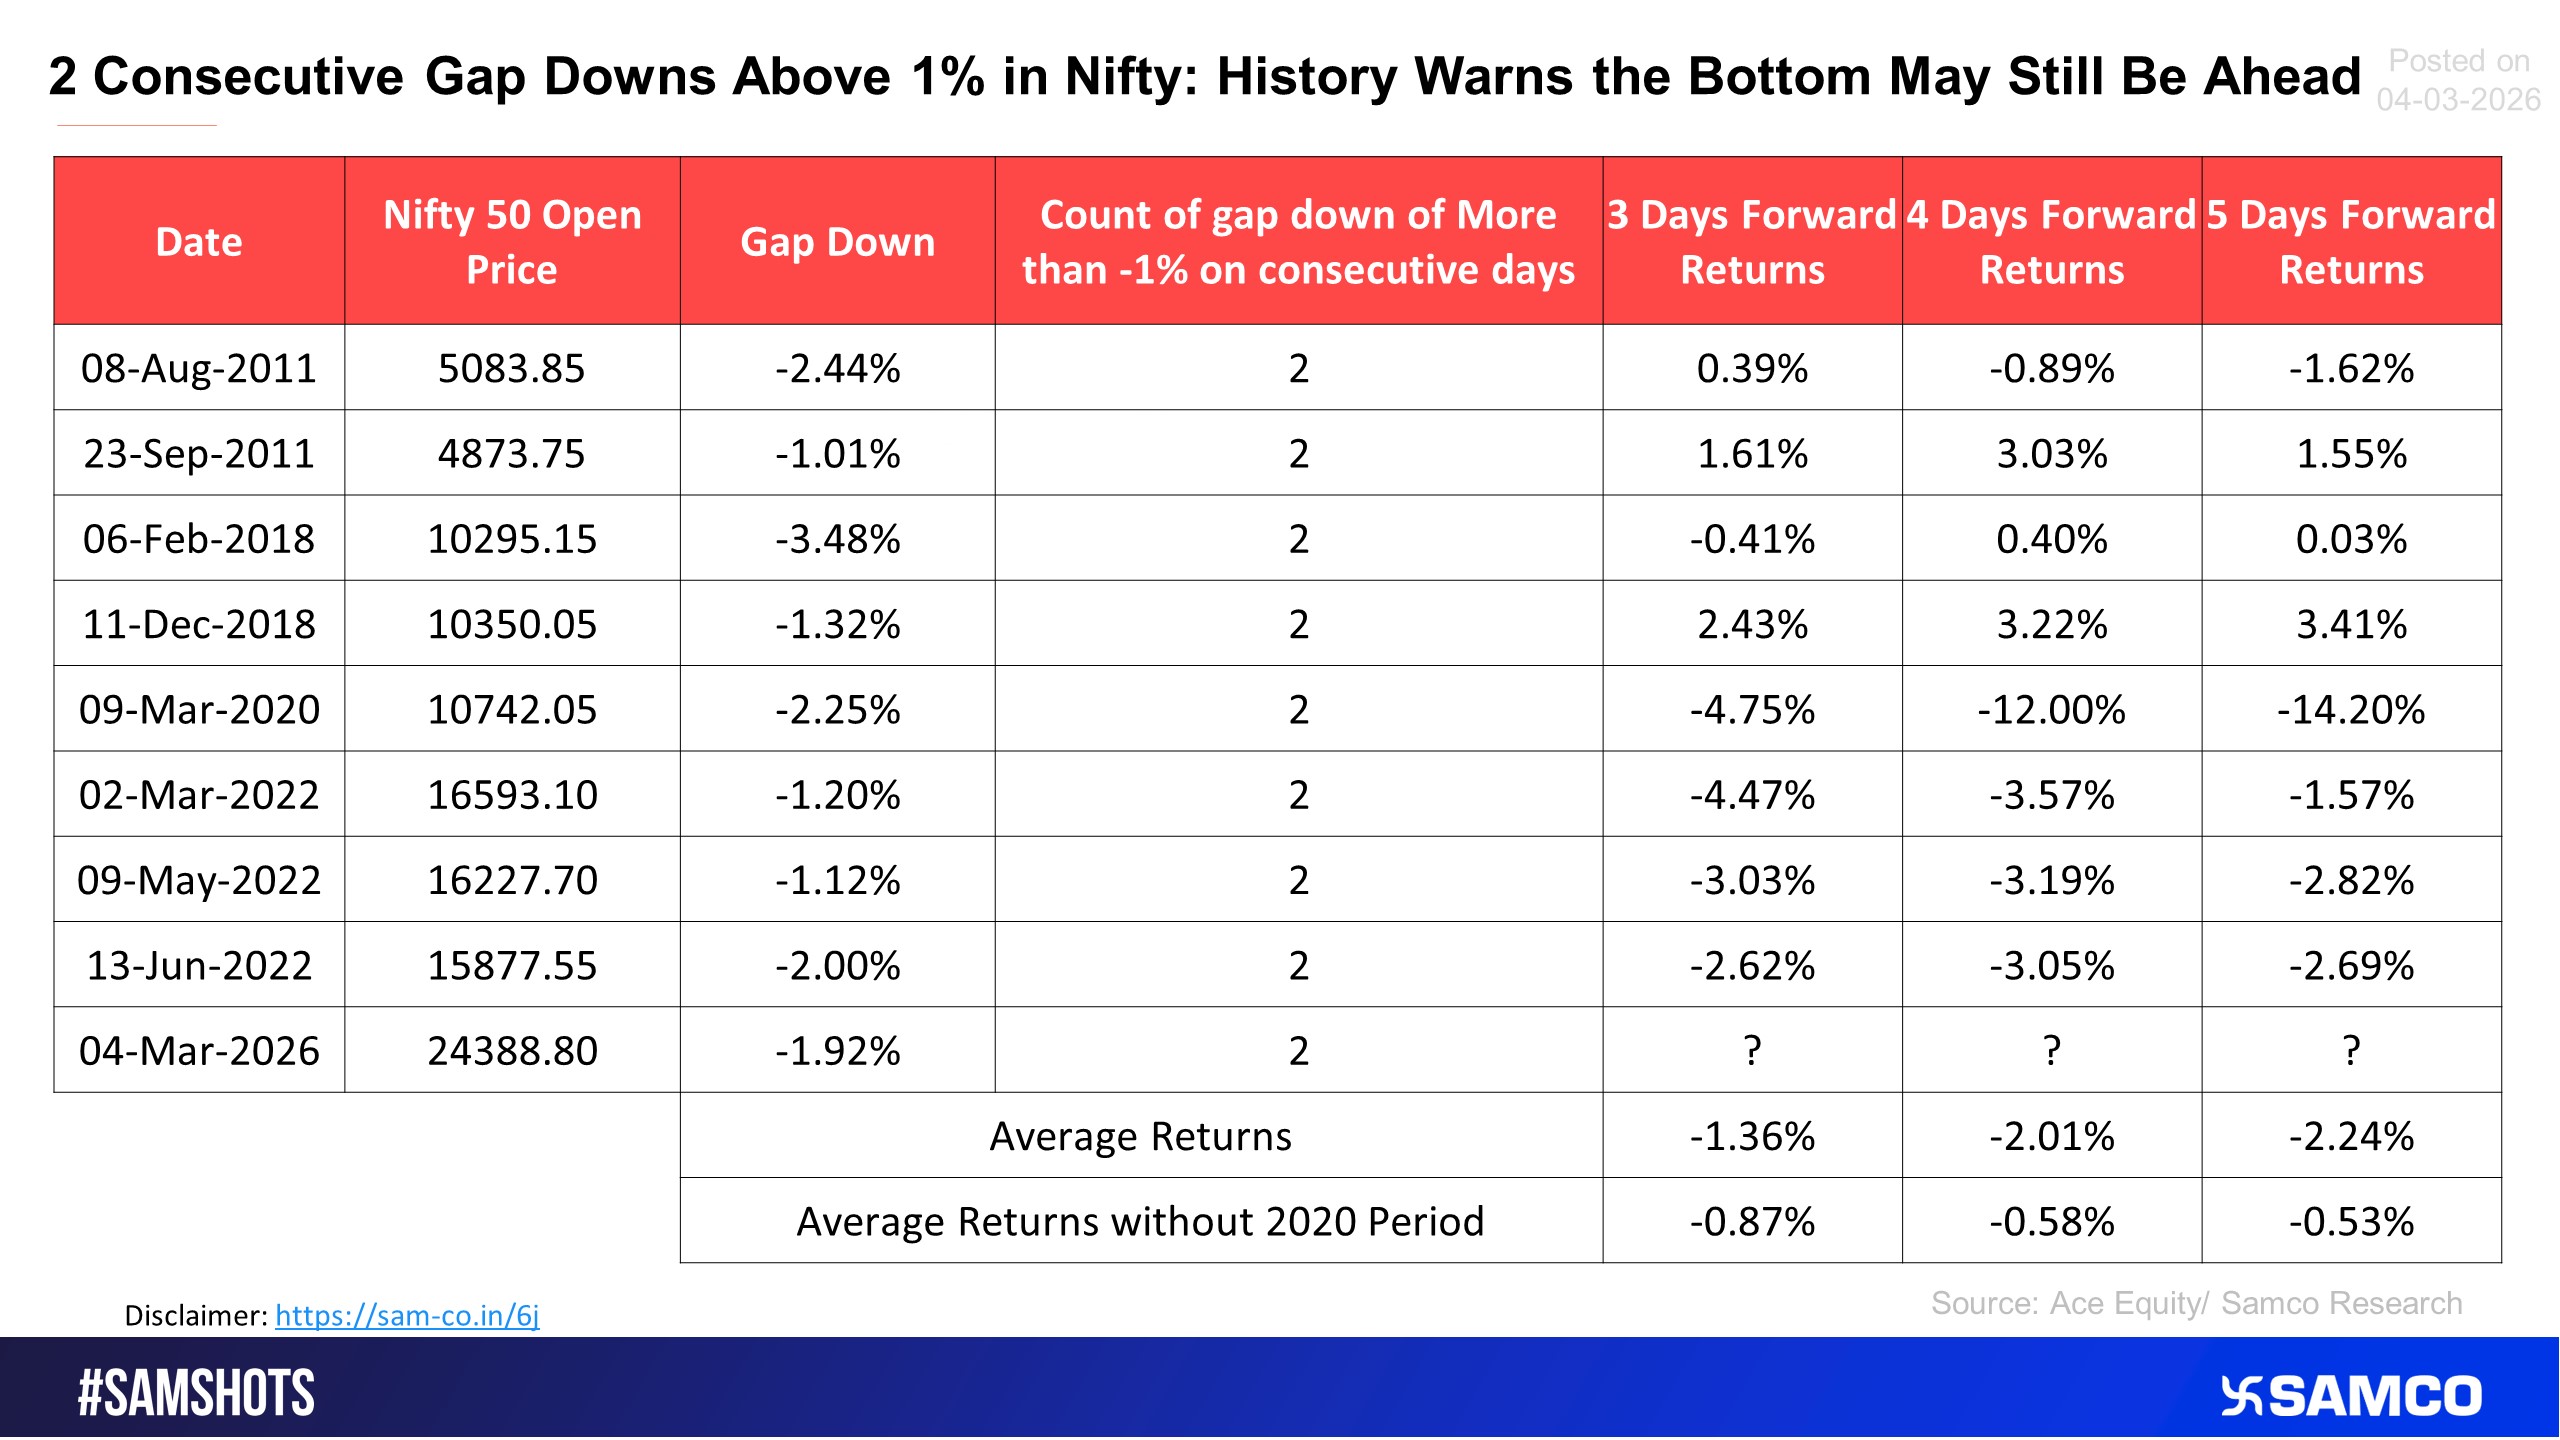
2 back-to-back gap down in the Nifty 50, what does it mean to the market?
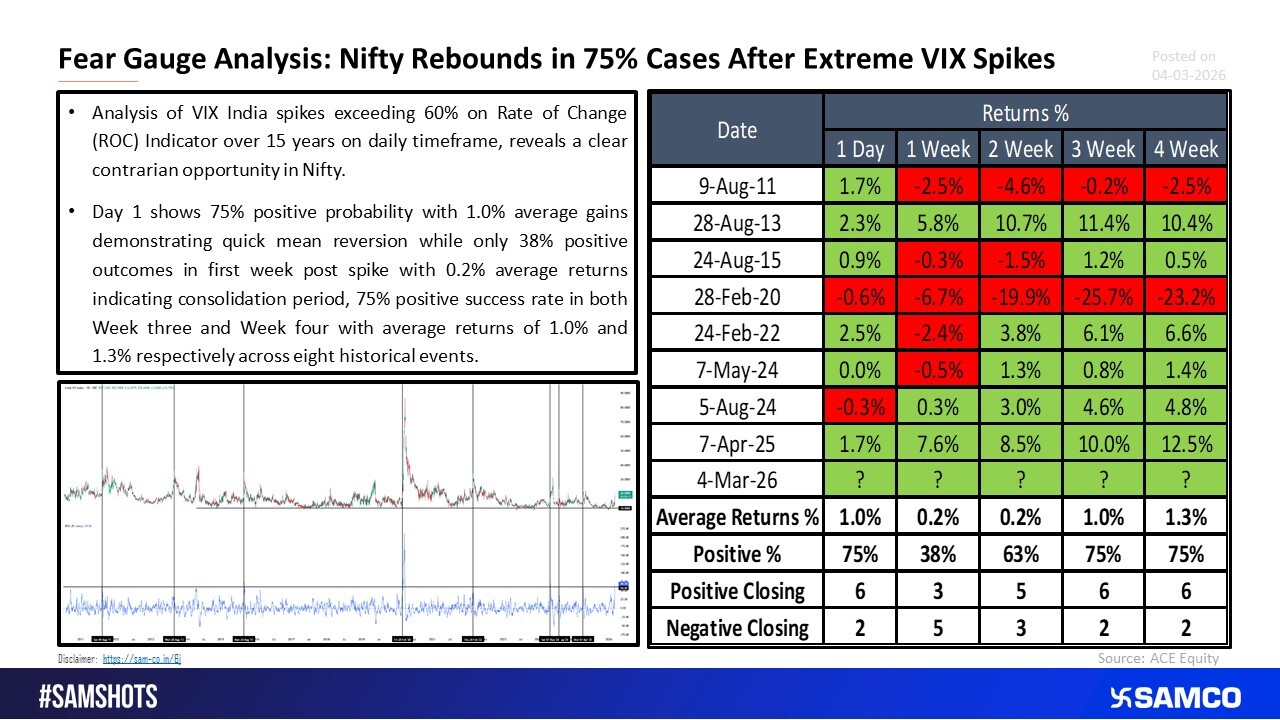
Fear Gauge Analysis: Nifty Typically Recovers in 75% of Instances Following Sharp VIX Increases.
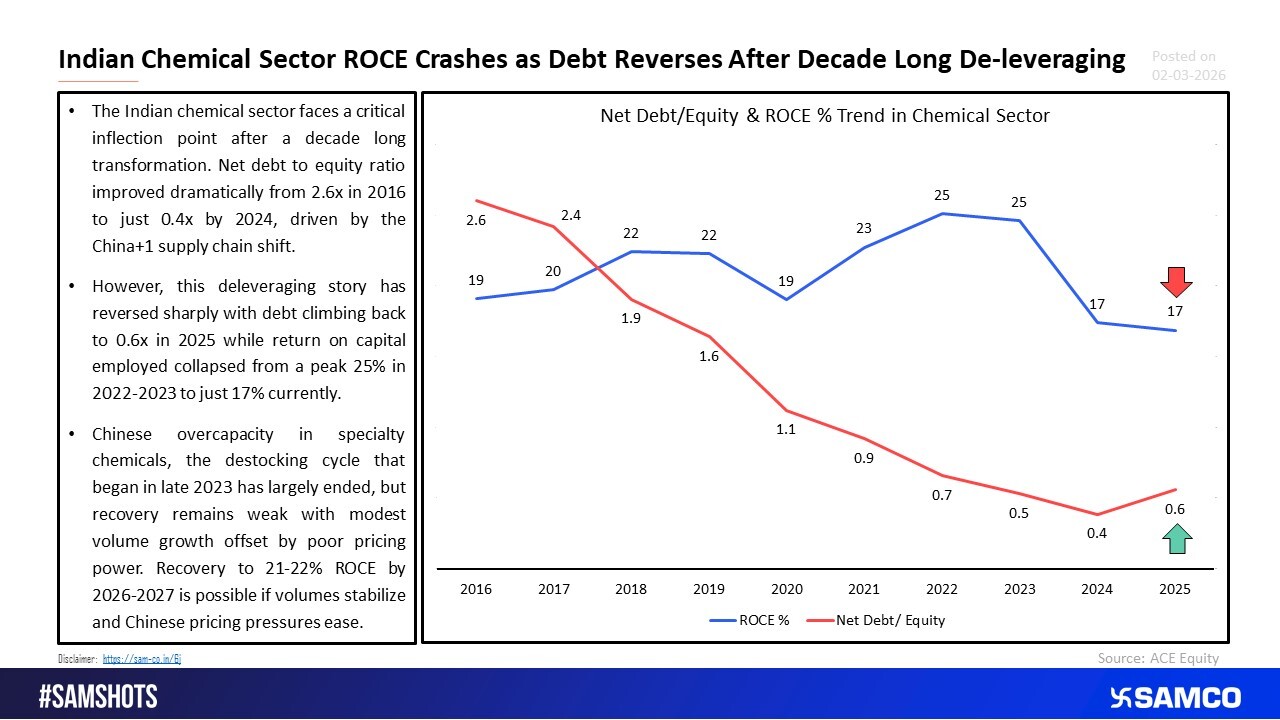
Return on Capital Employed (ROCE) in the Indian chemical sector plummets as debt levels rise after a decade of reducing borrowings.
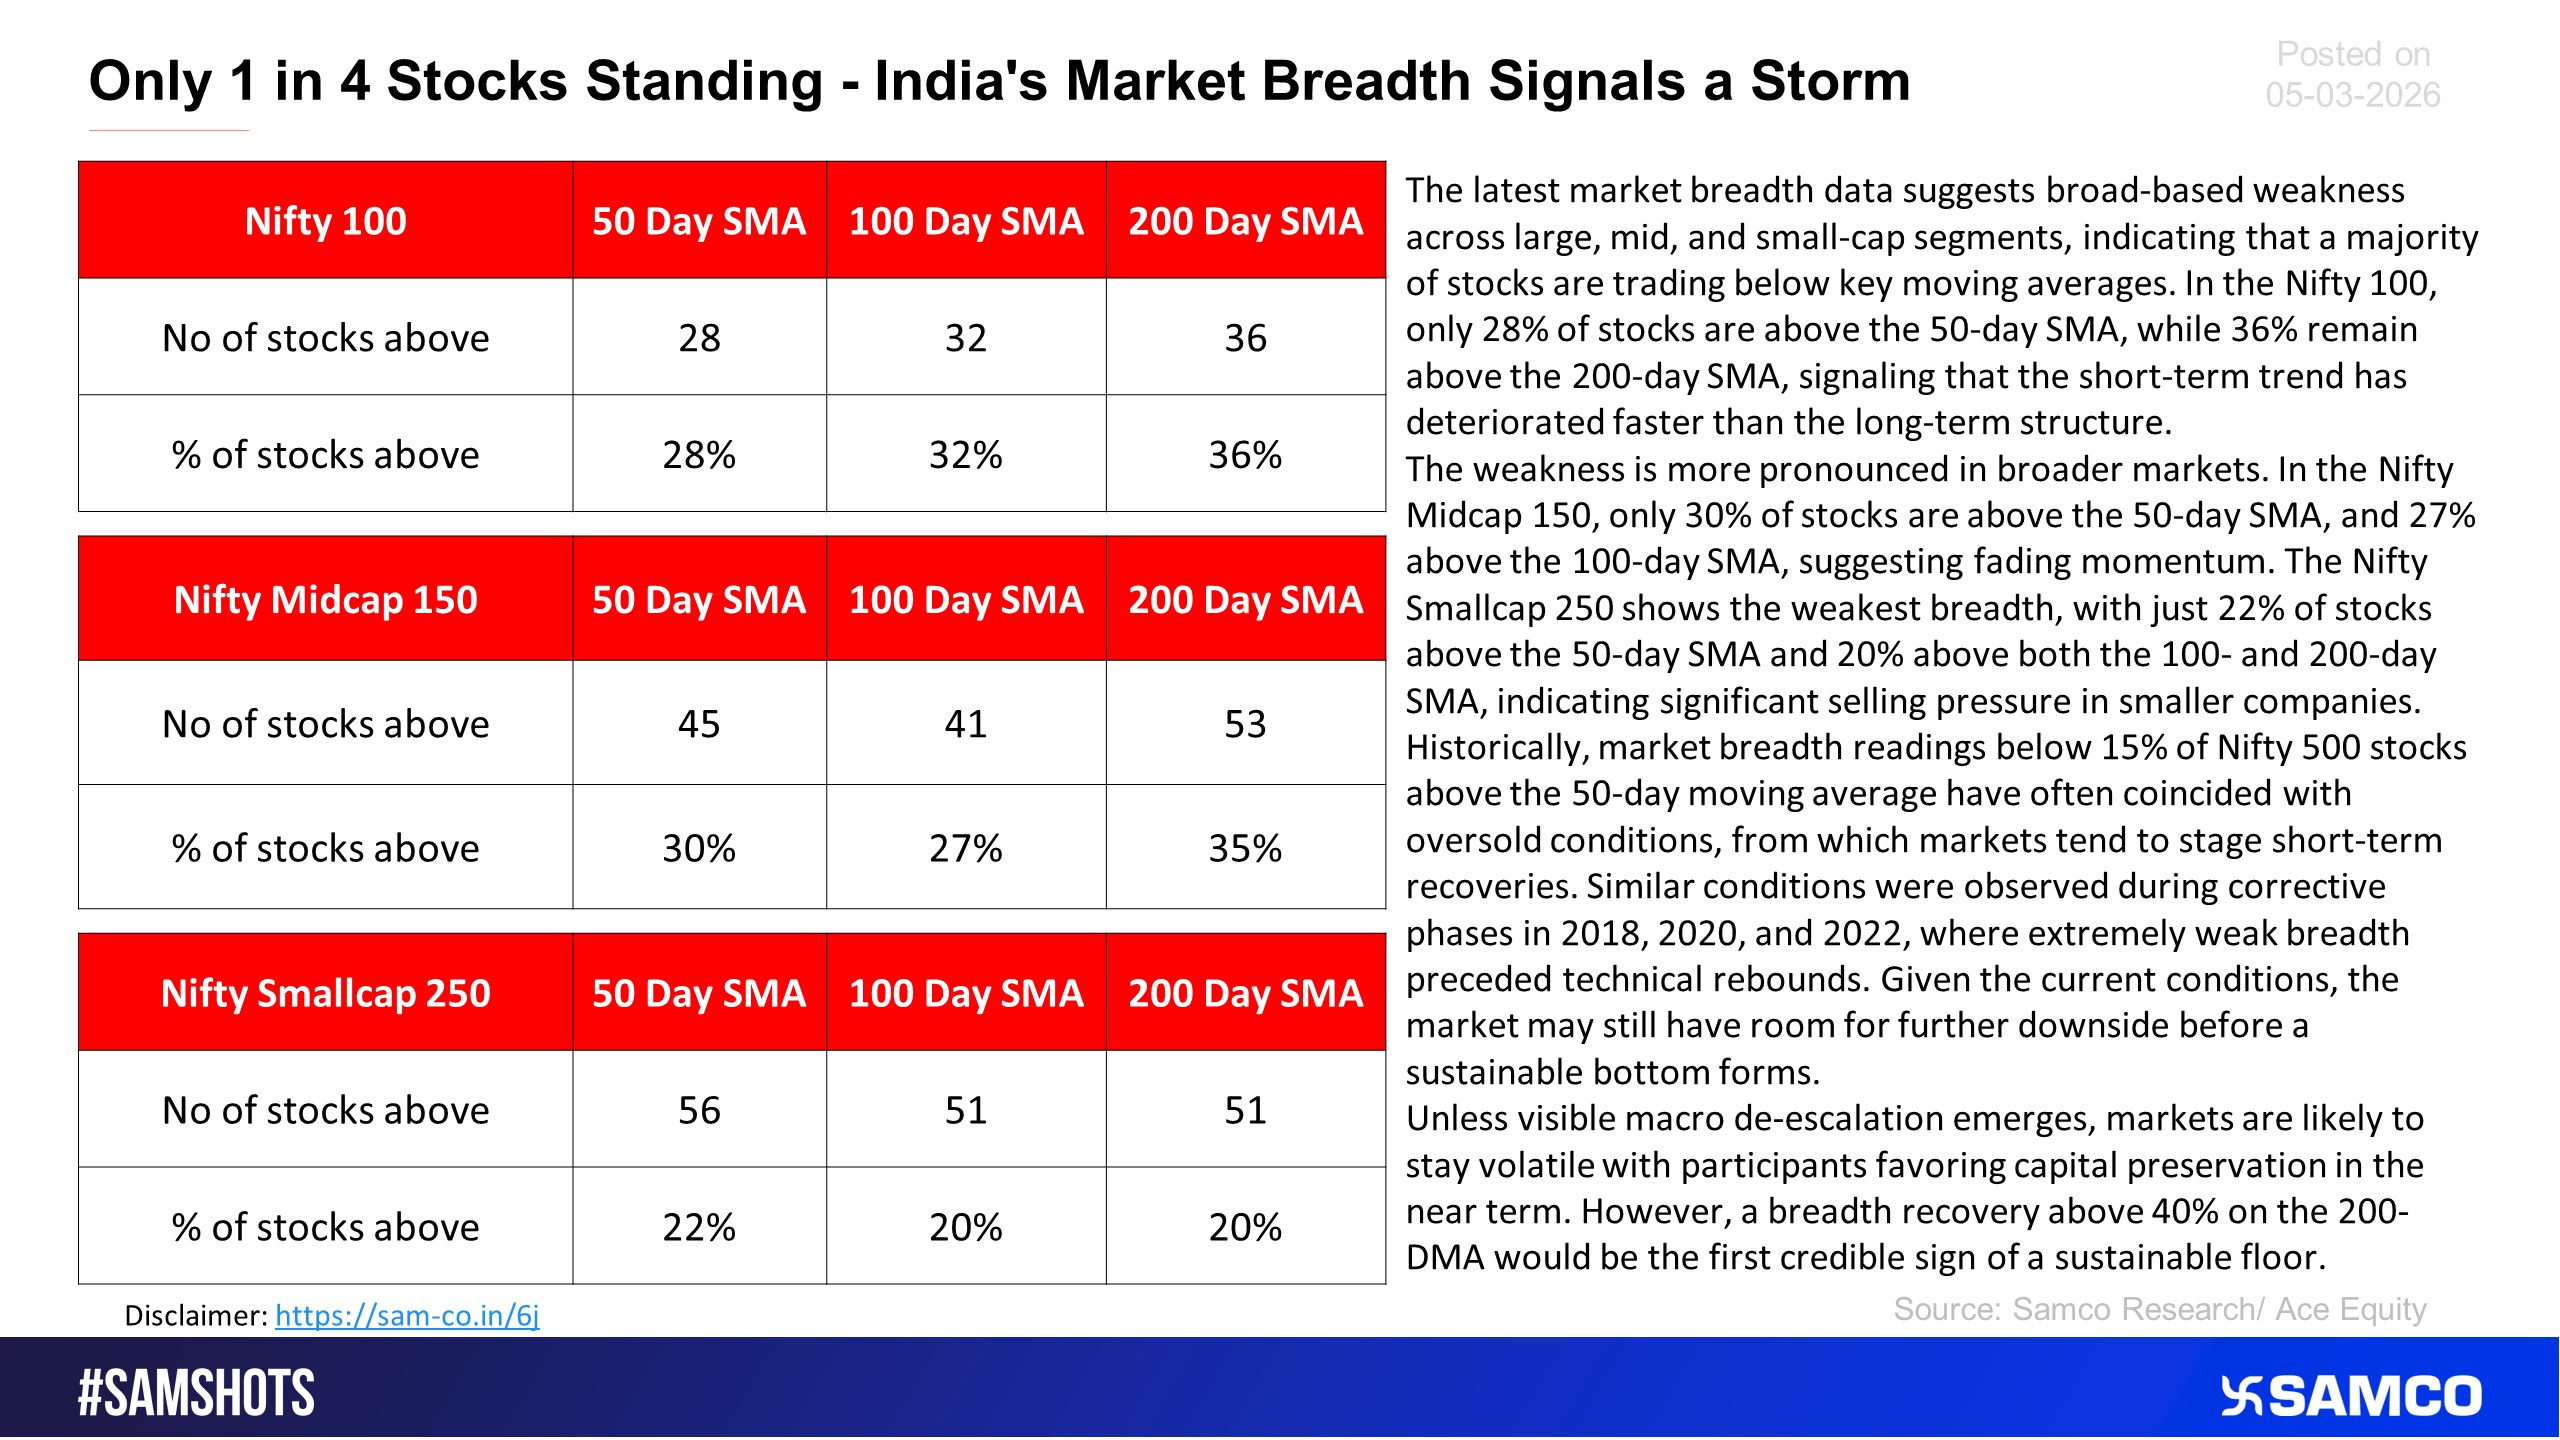
The table below shows the market breadth of the Major Indian market Indices
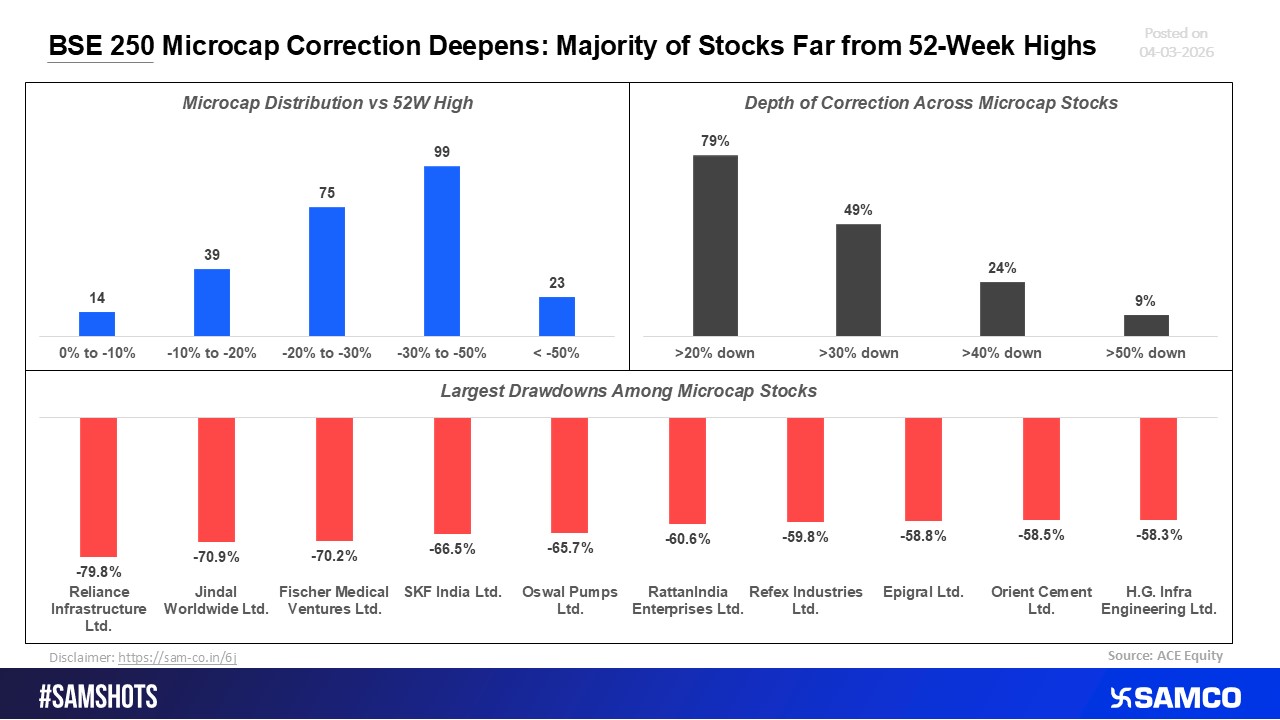
BSE 250 Microcaps See Broad Correction; Majority of Stocks Far from 52-Week Peaks
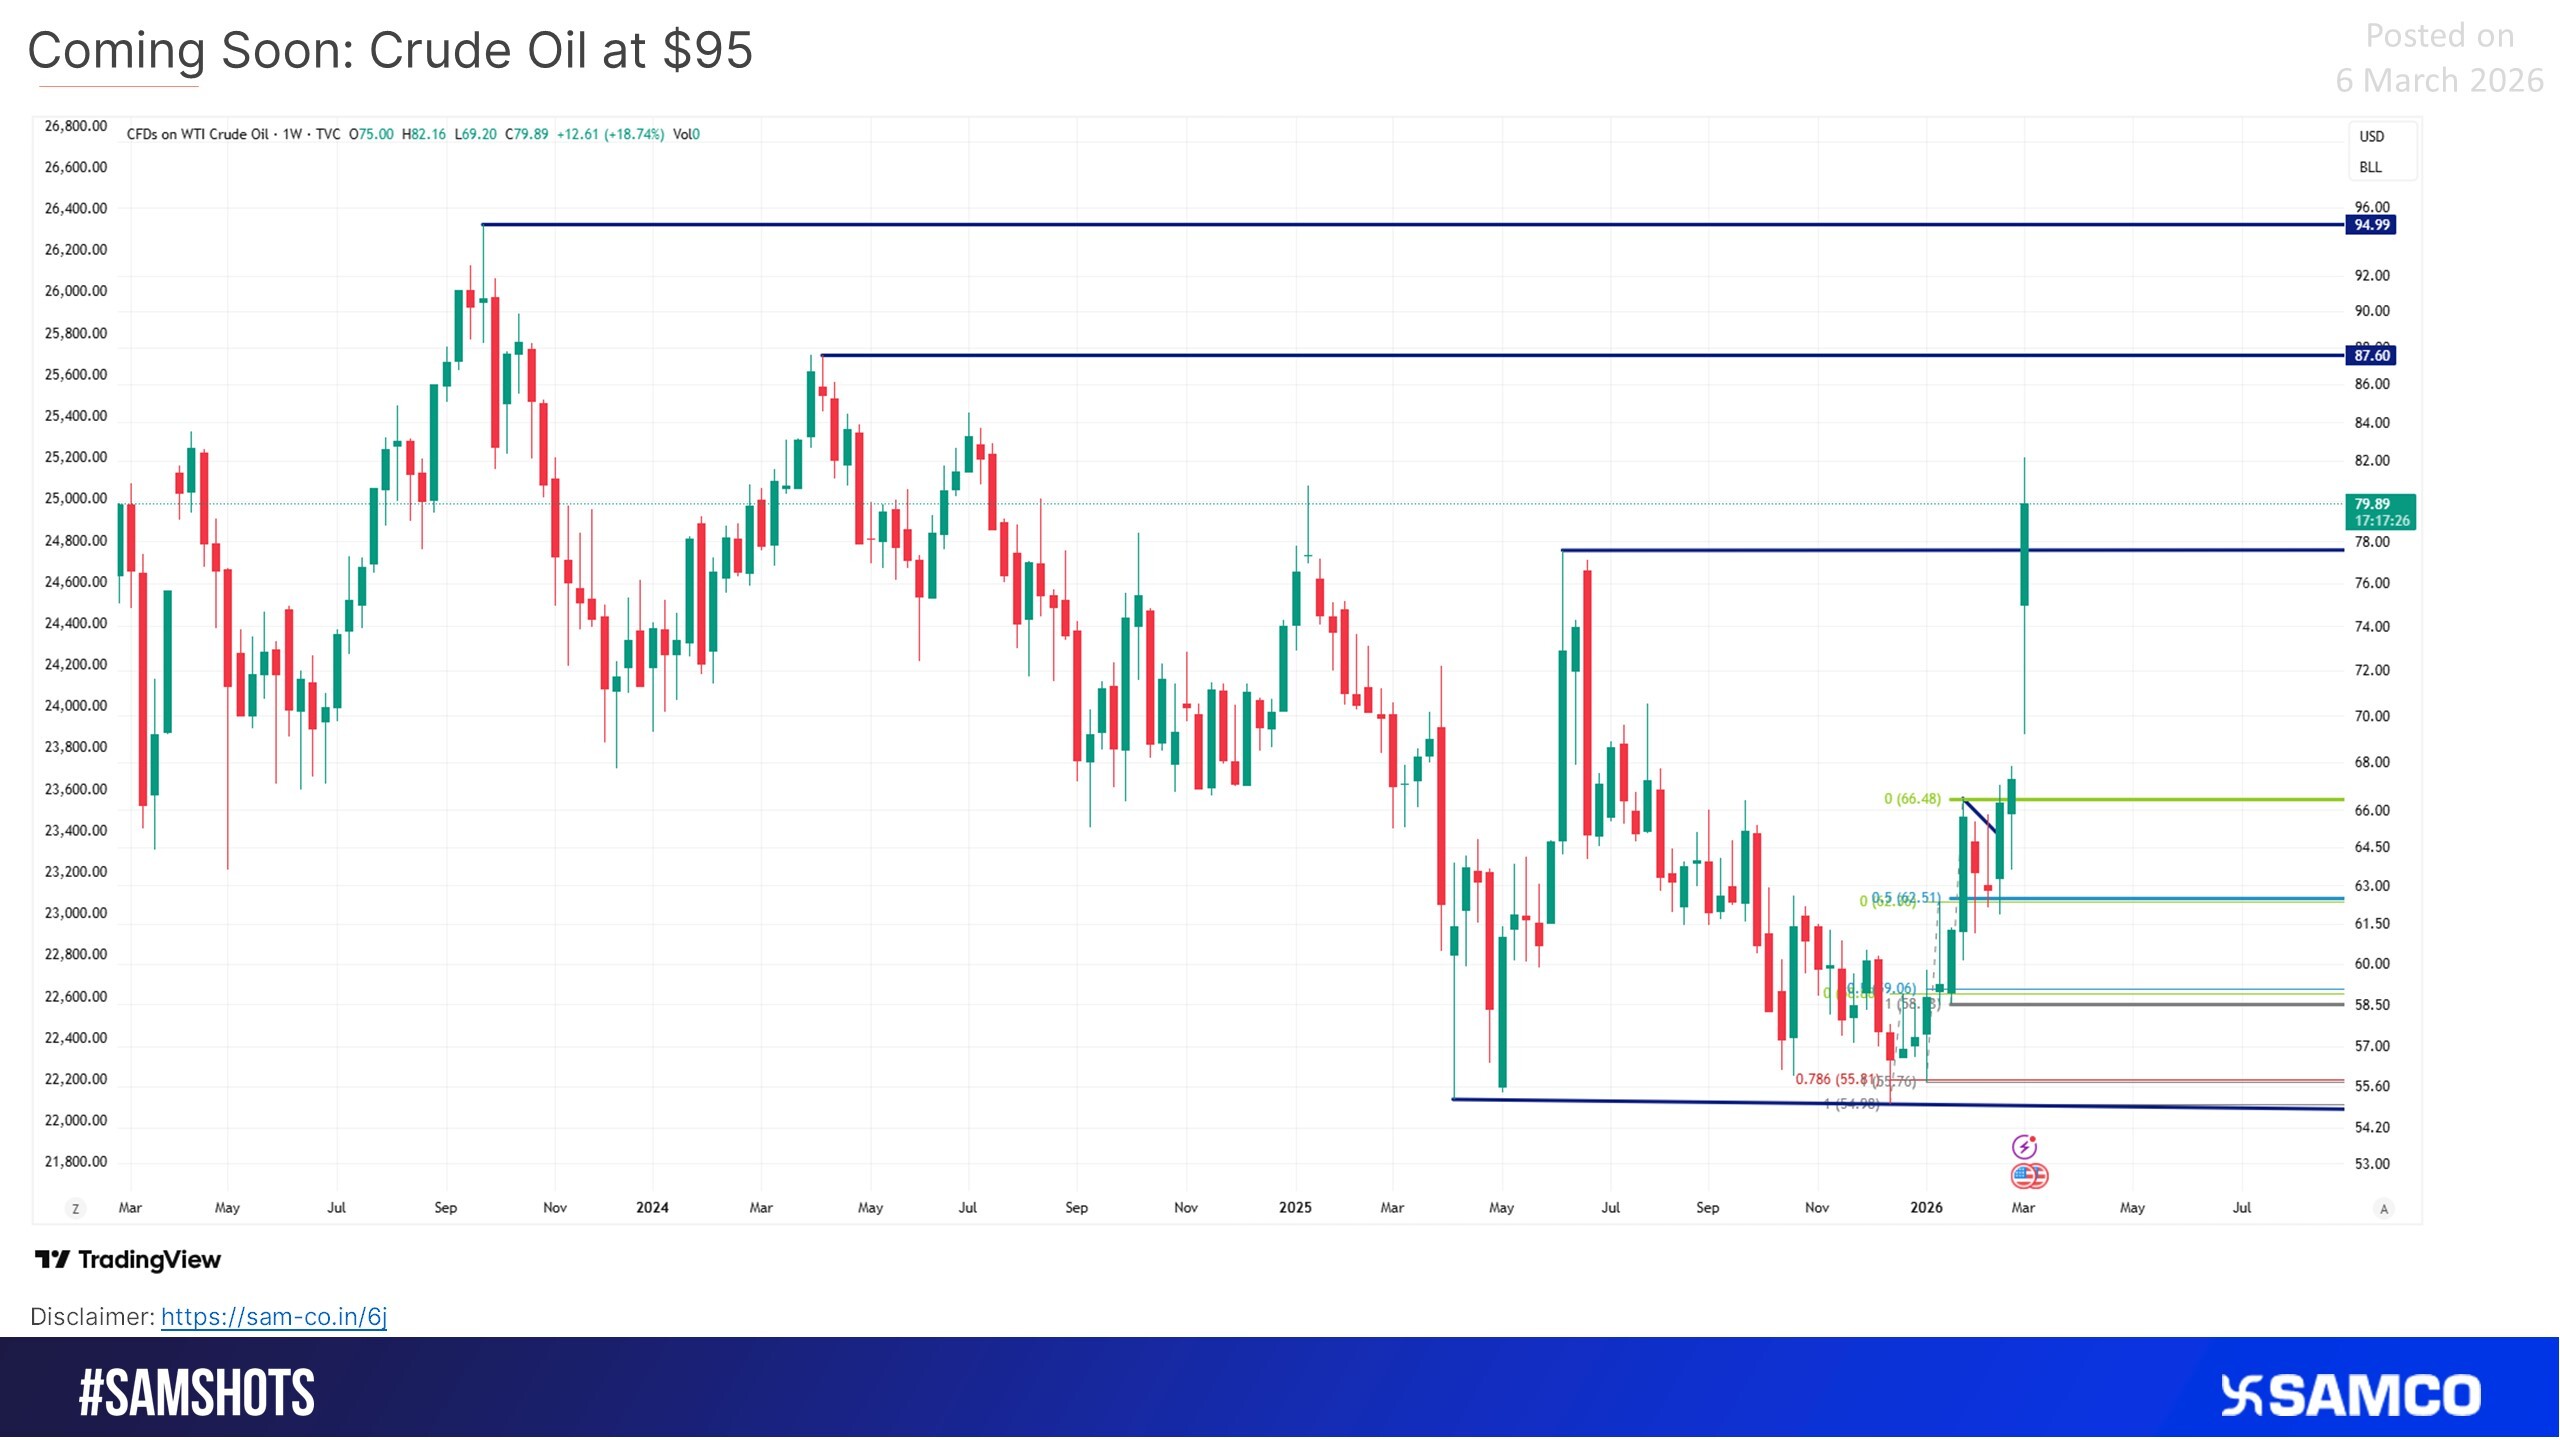
Crude Oil Heading Towards $95
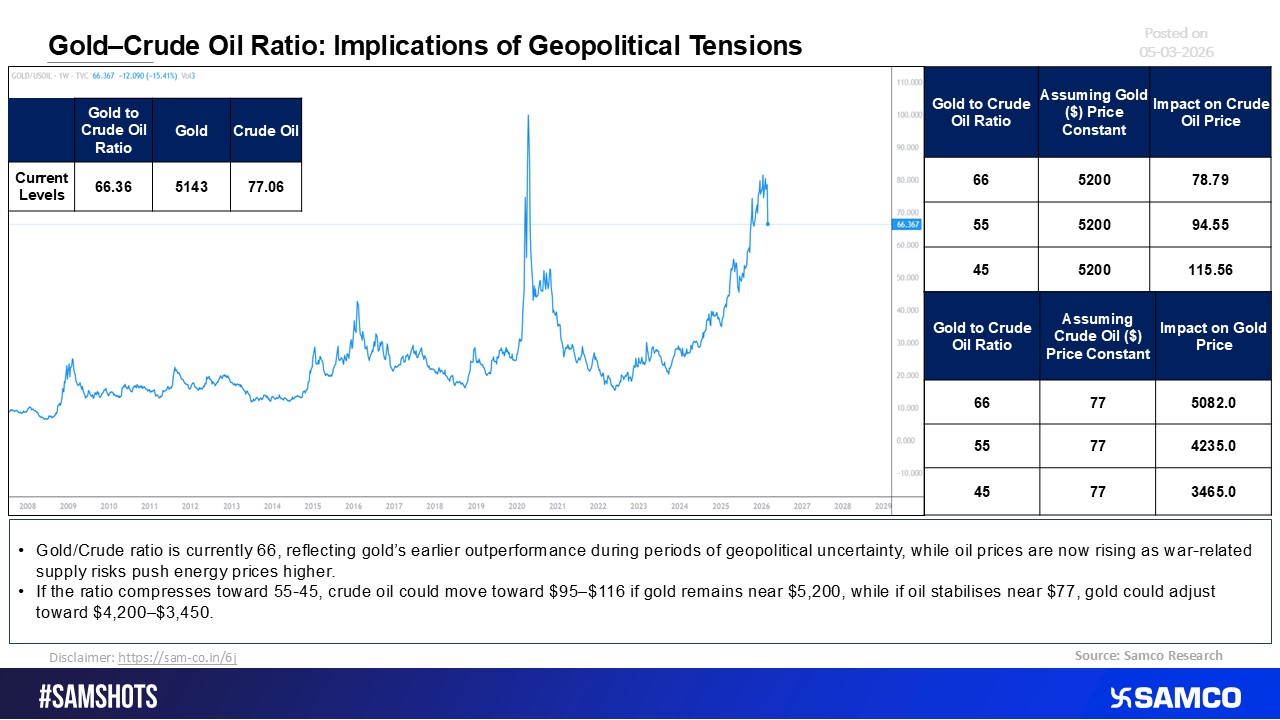
Gold-Crude Oil Ratio Implies Crude Oil May Soon Test $95
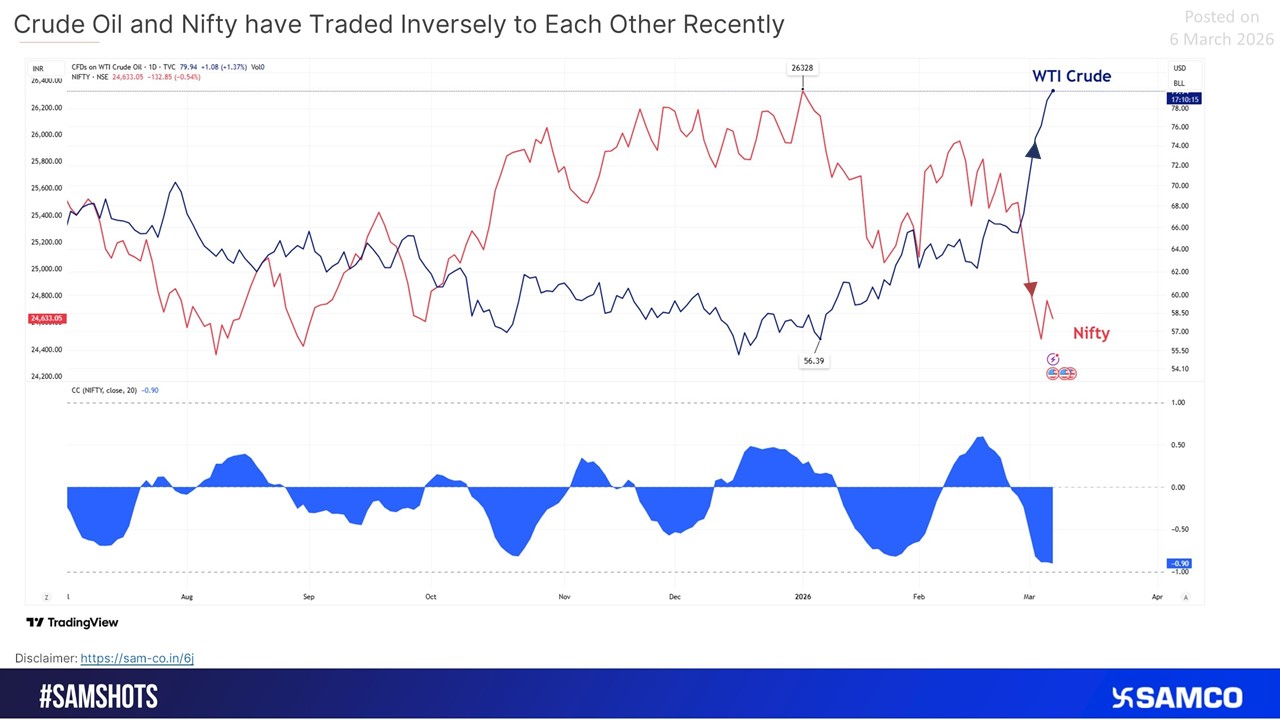
Recent Trends Show an Inverse Correlation Between Crude Oil and Nifty
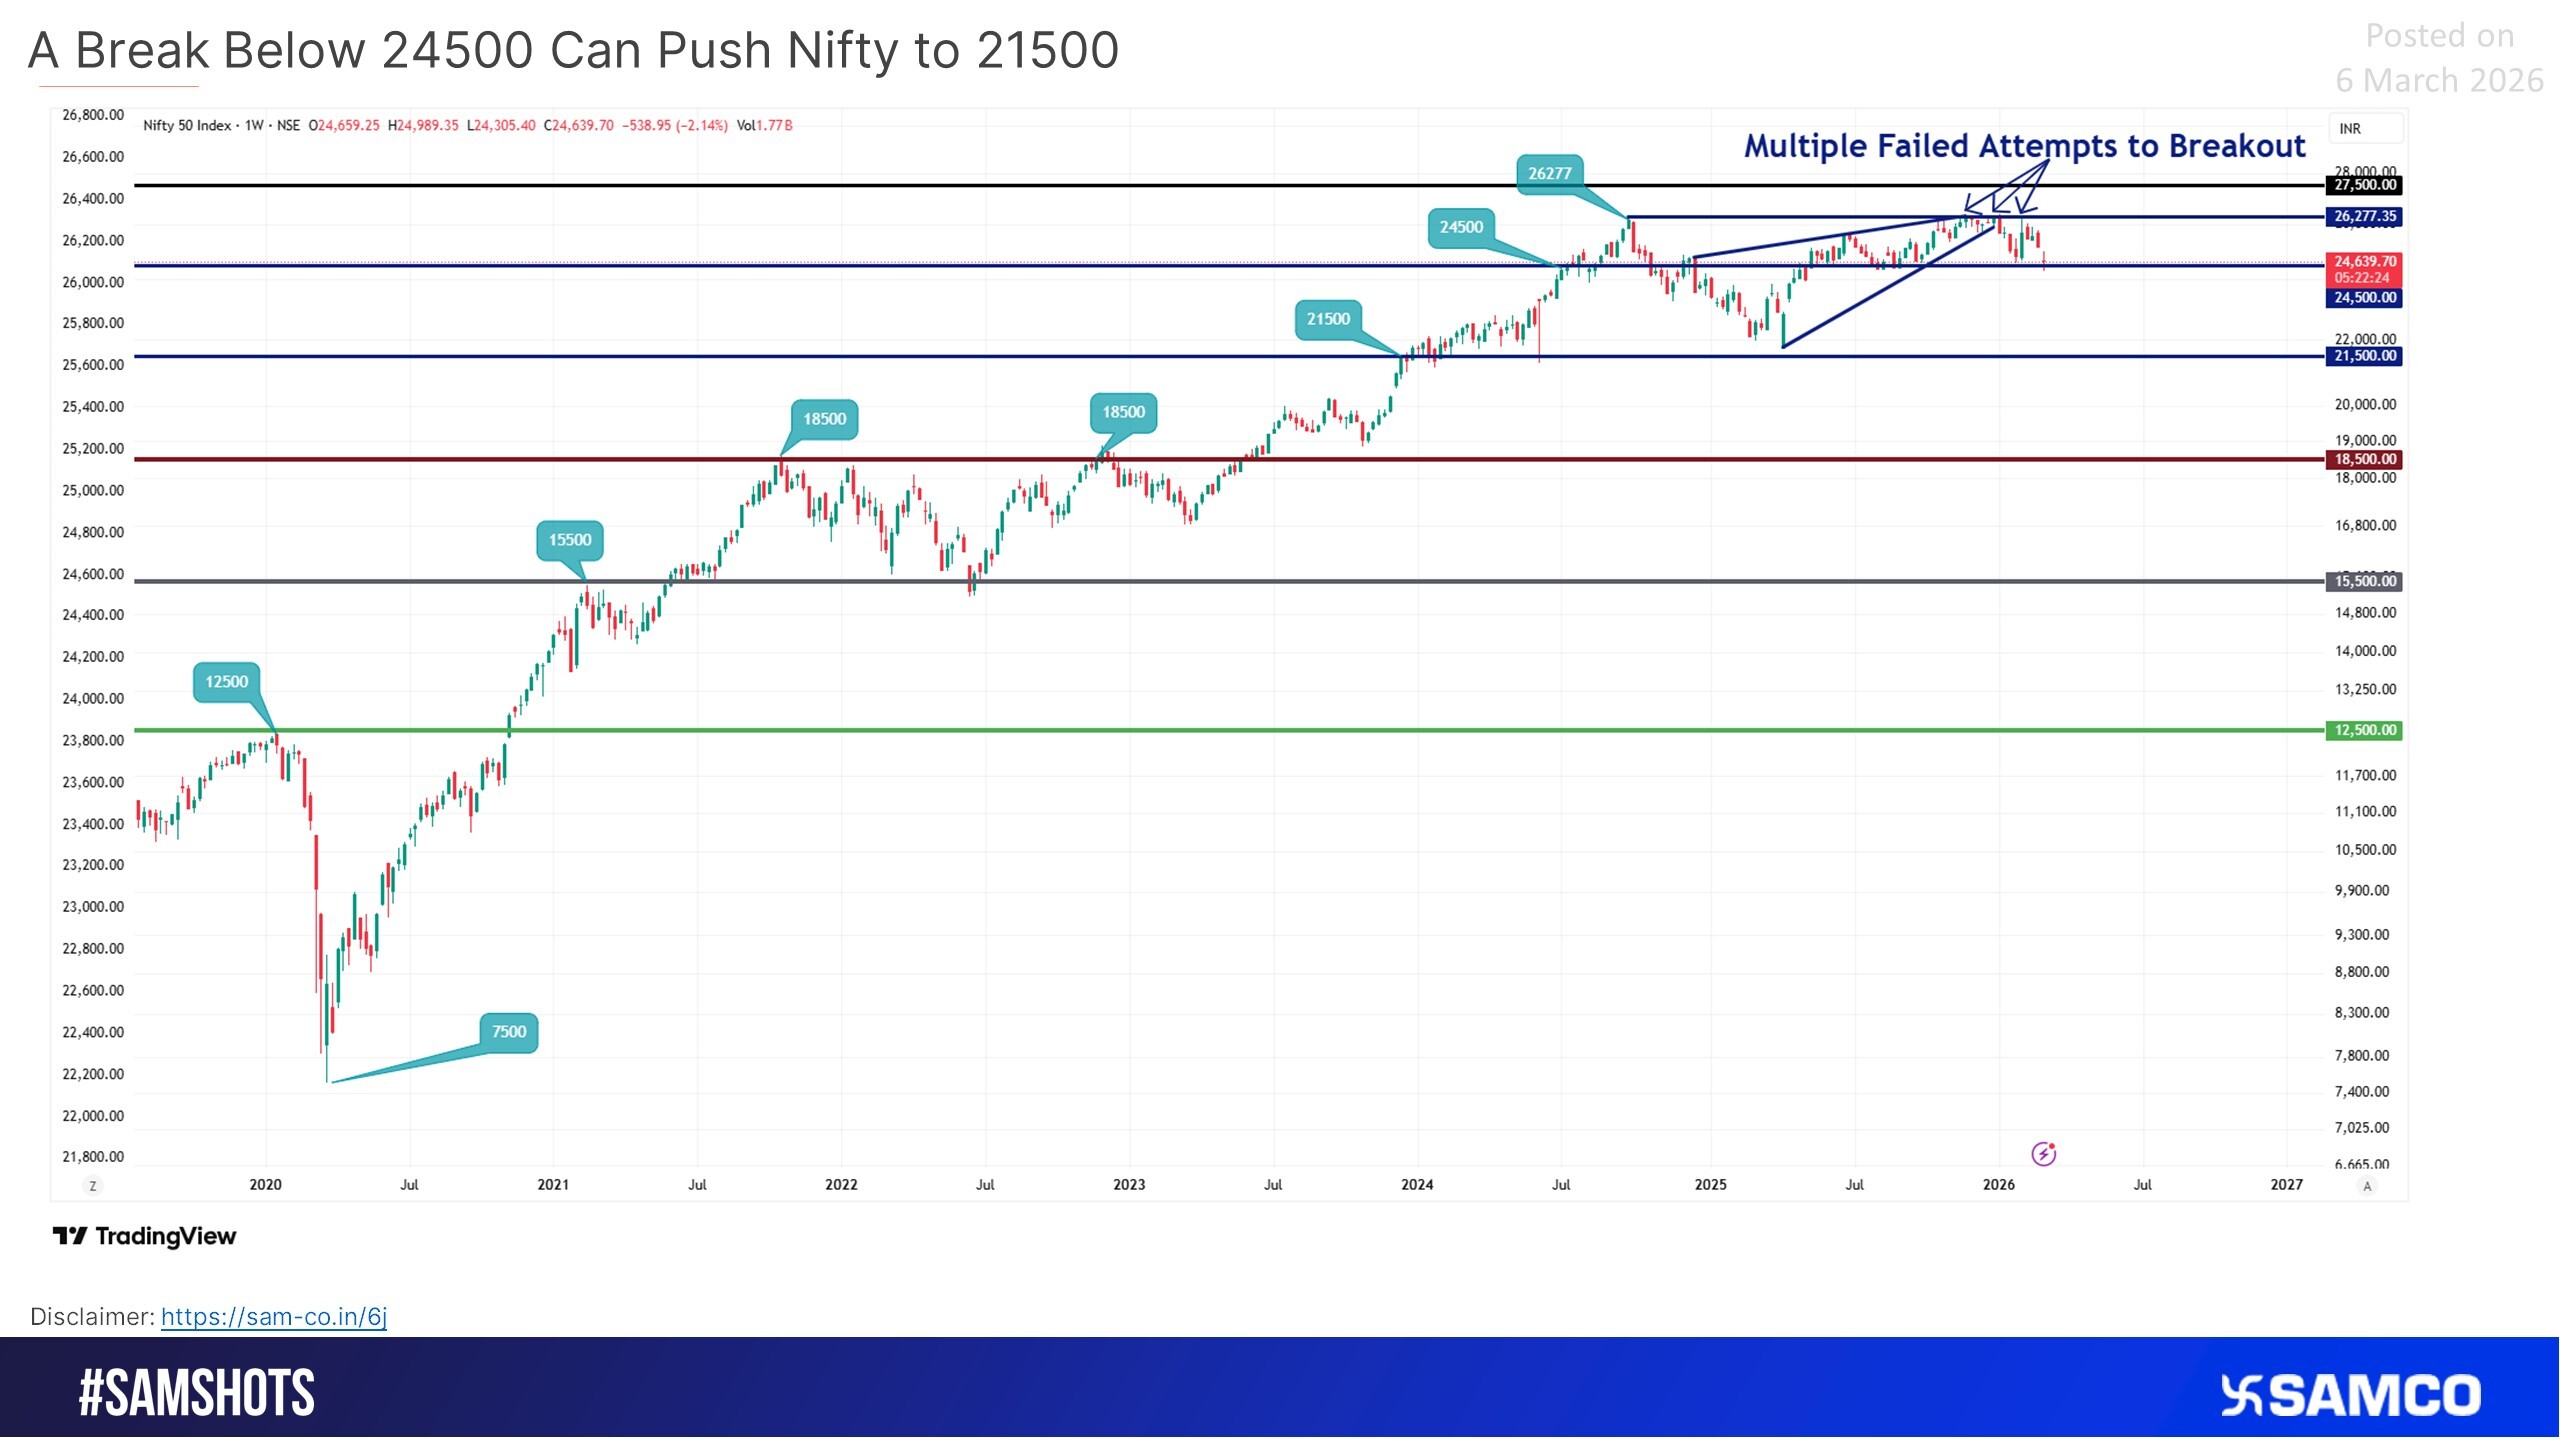
A Break Below 24,500 Could Drag Nifty Toward 21,500
Gold-Crude Oil Ratio Highlights Market Response to Geopolitical Uncertainty
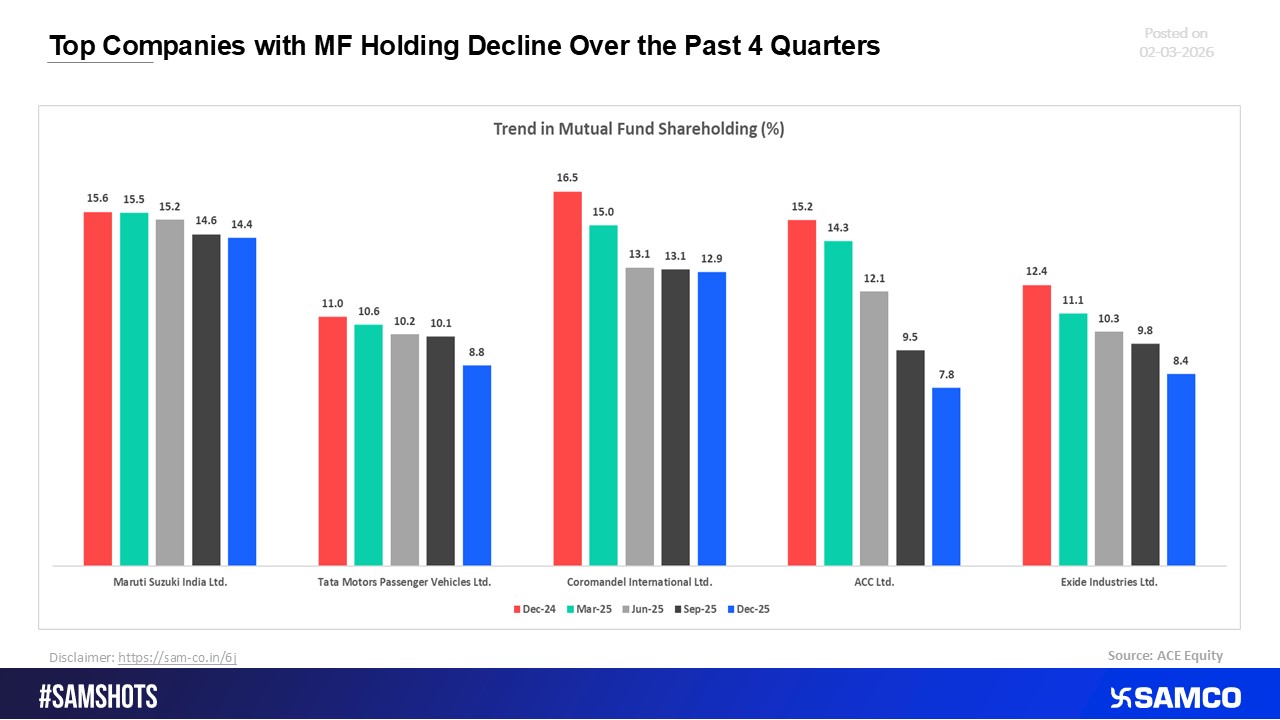
Companies with the Largest Decline in Mutual Fund Holdings Over the Last Four Quarters
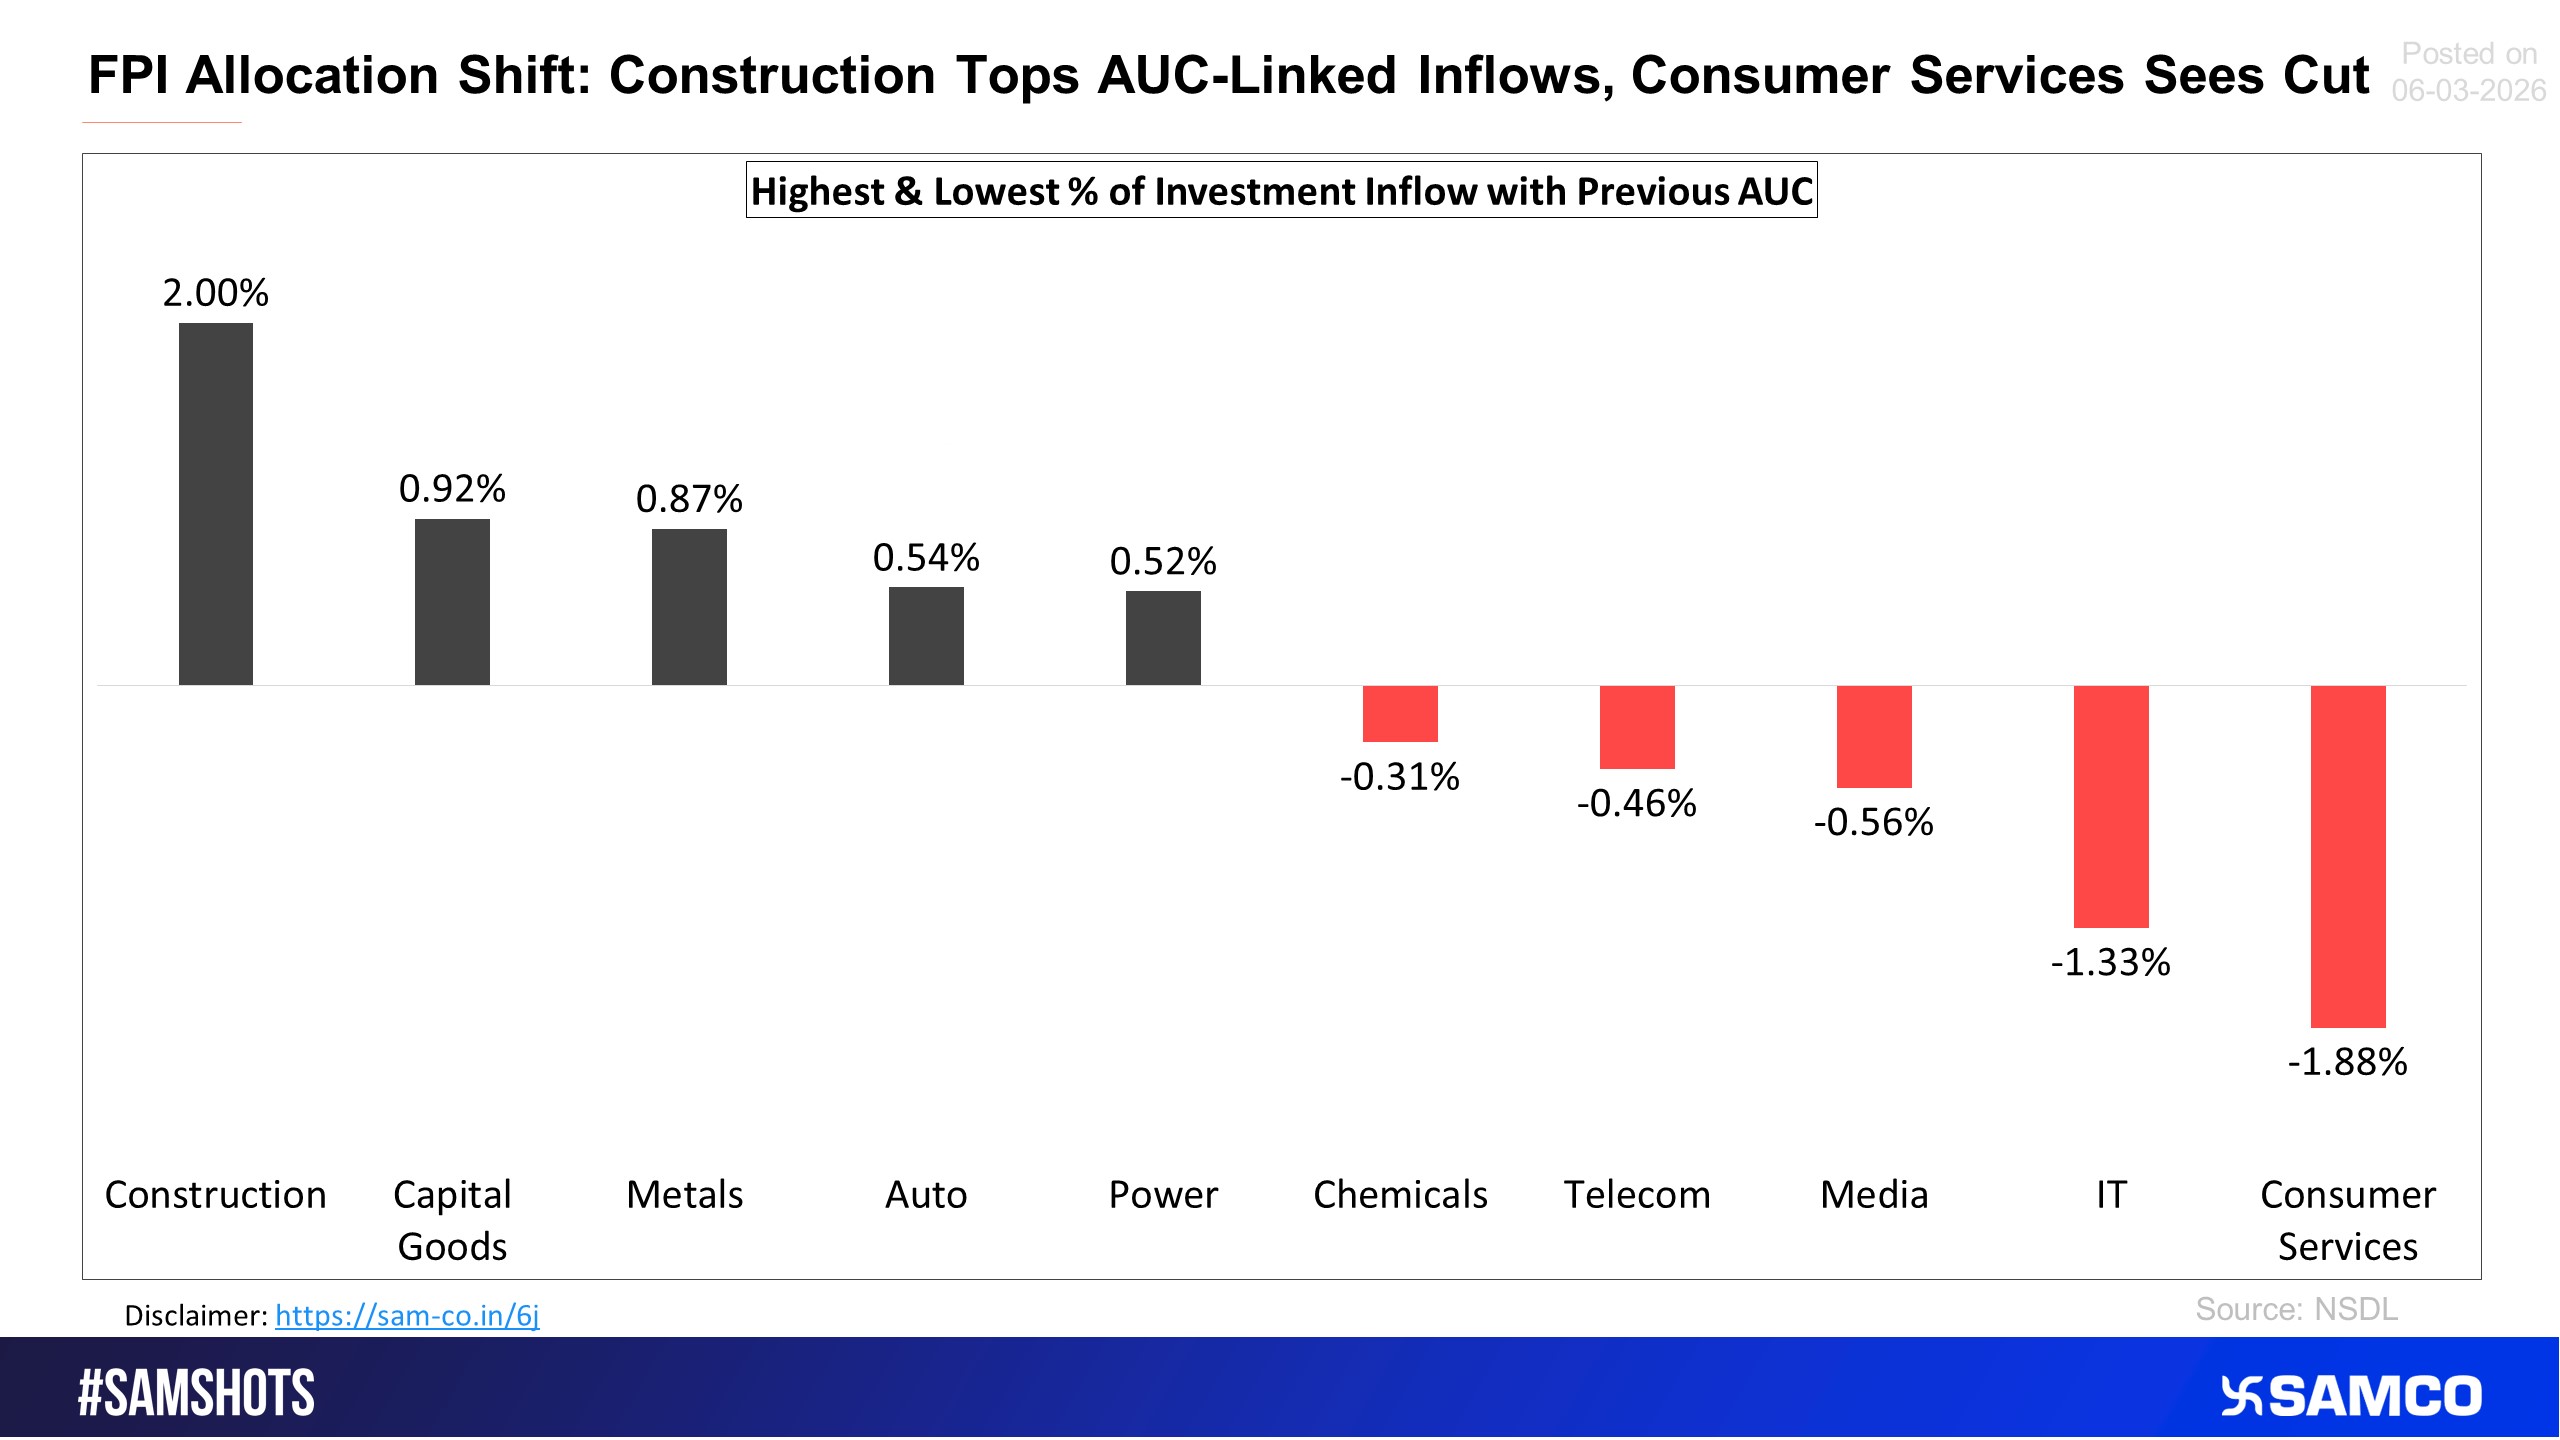
The chart below shows the highest and lowest sectoral inflow of FPI Investments.
Here’s the list of sectors with highest and lowest % of inflow compared to previous period AUC.
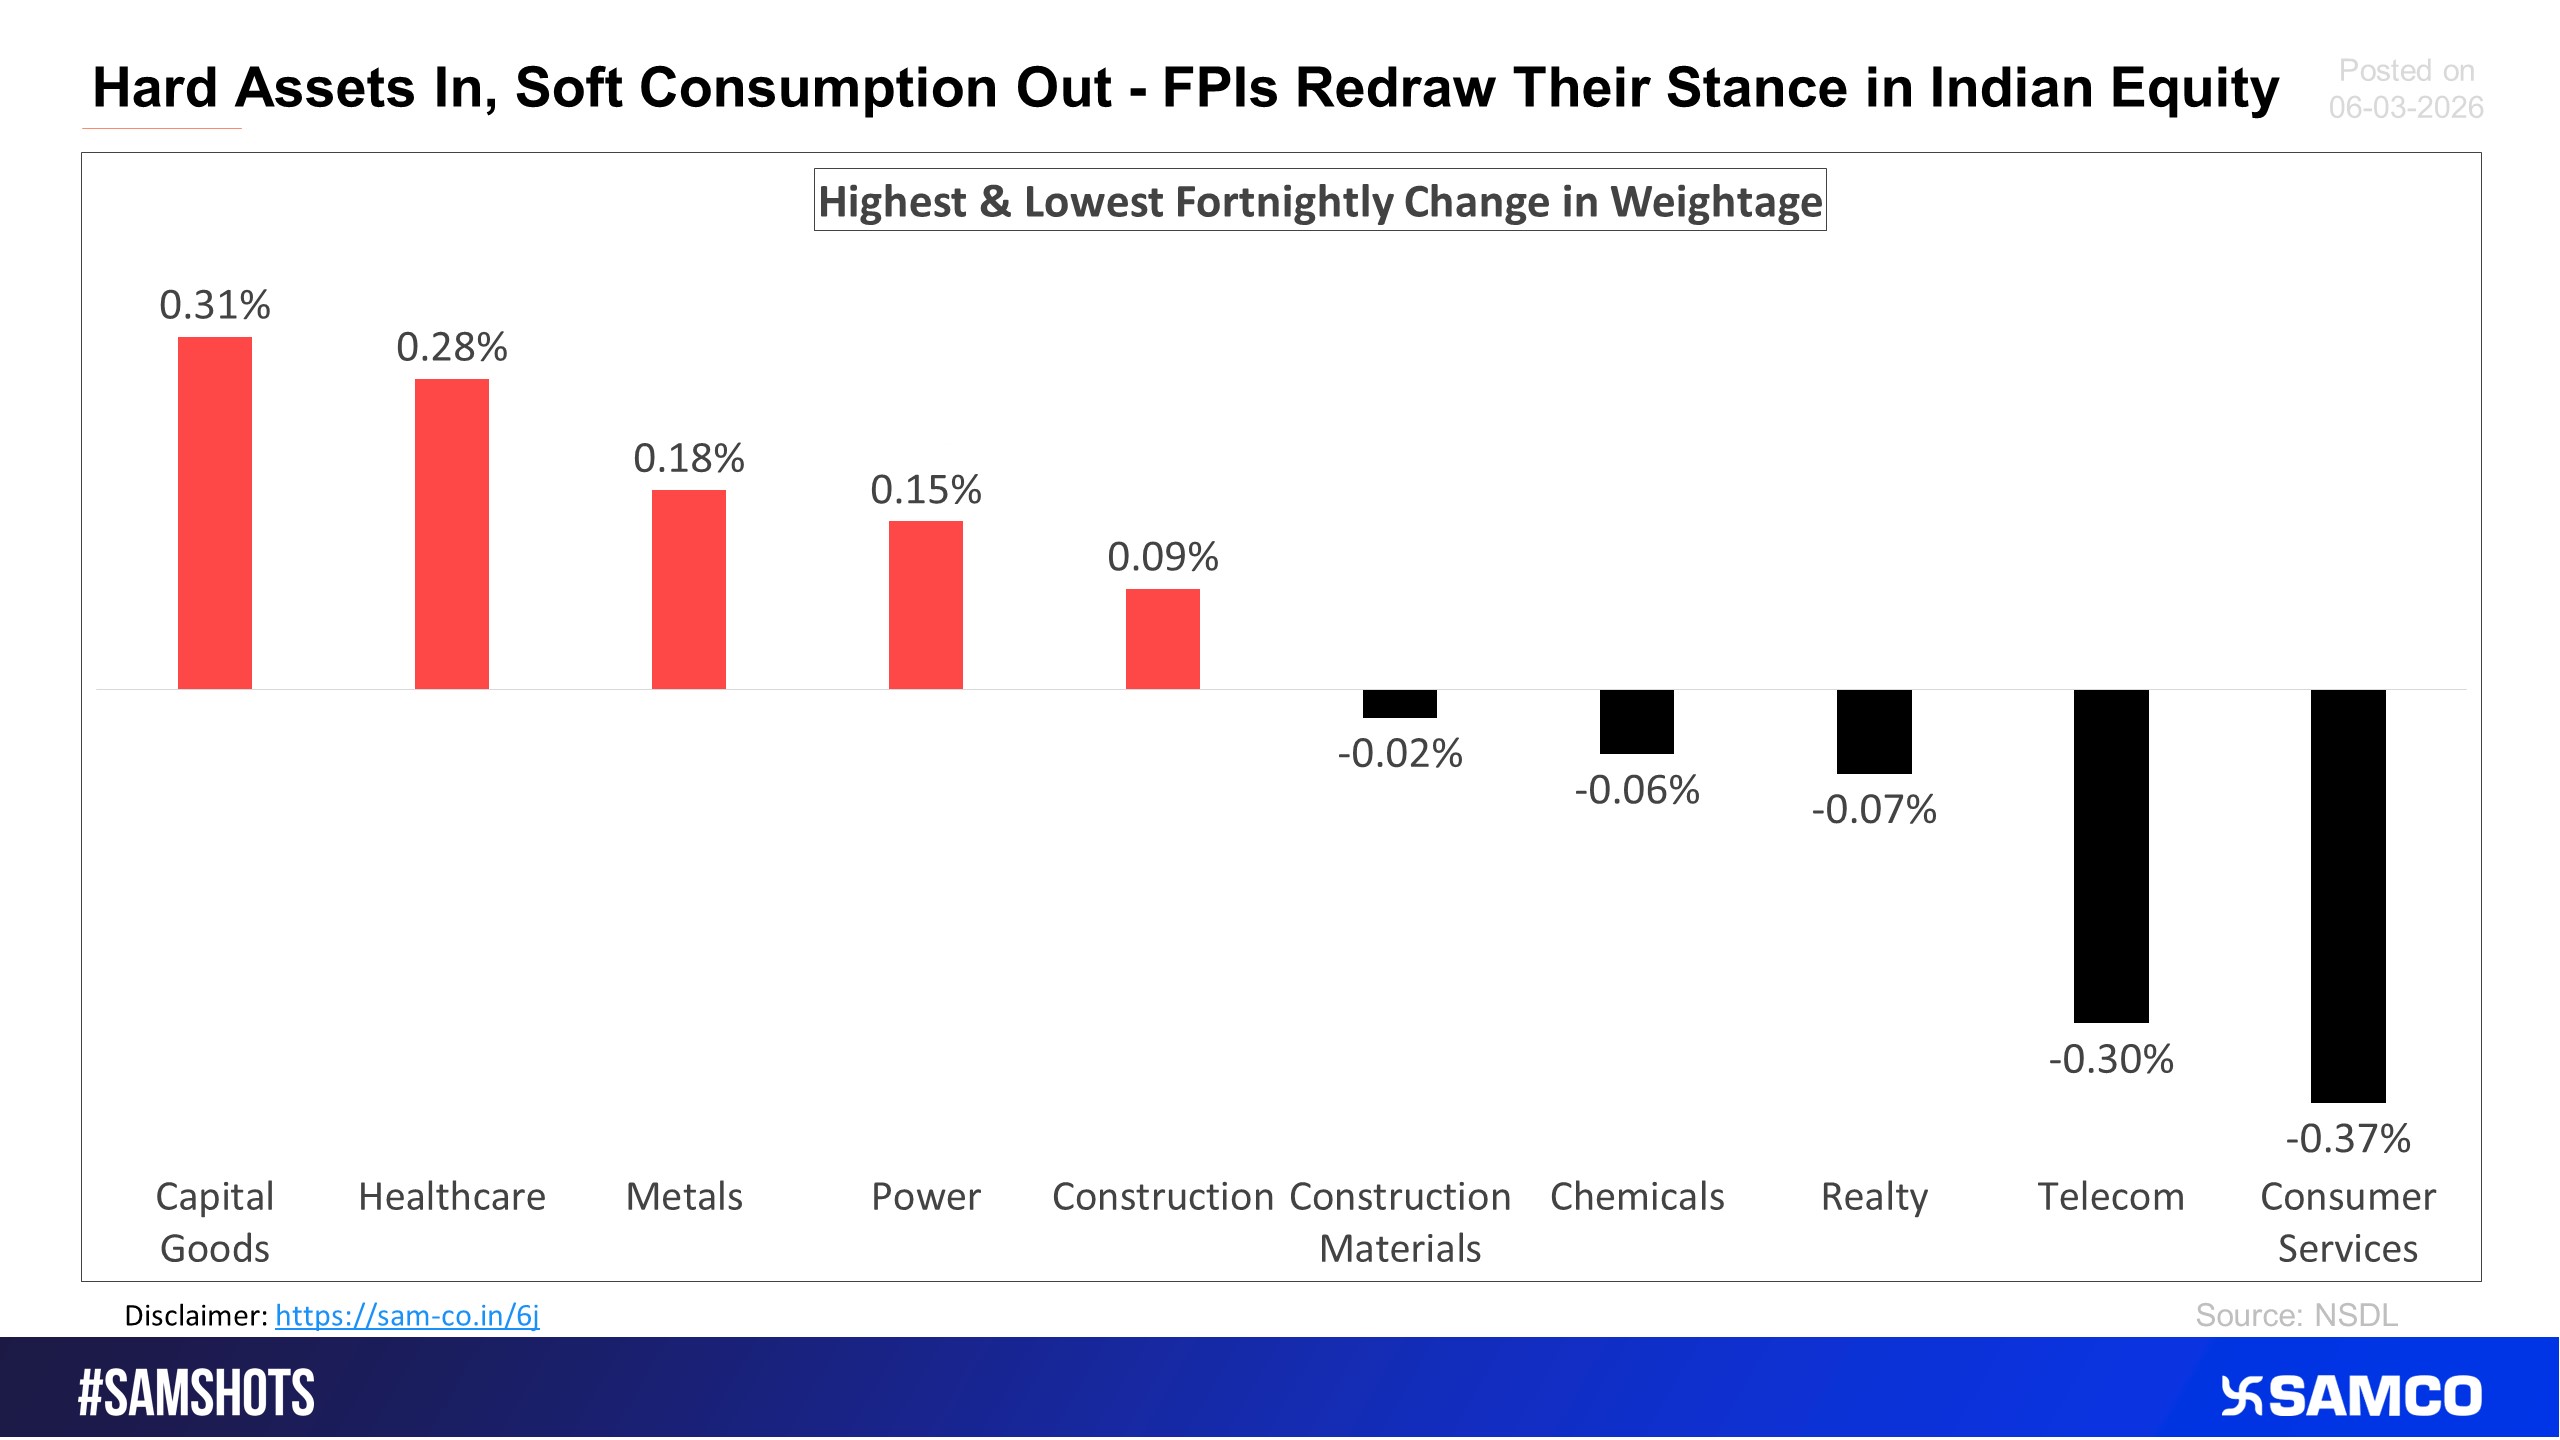
The attached chart shows the change in weightage of FPI holdings in the fortnight from 16th Feb to 28 Feb 2026.
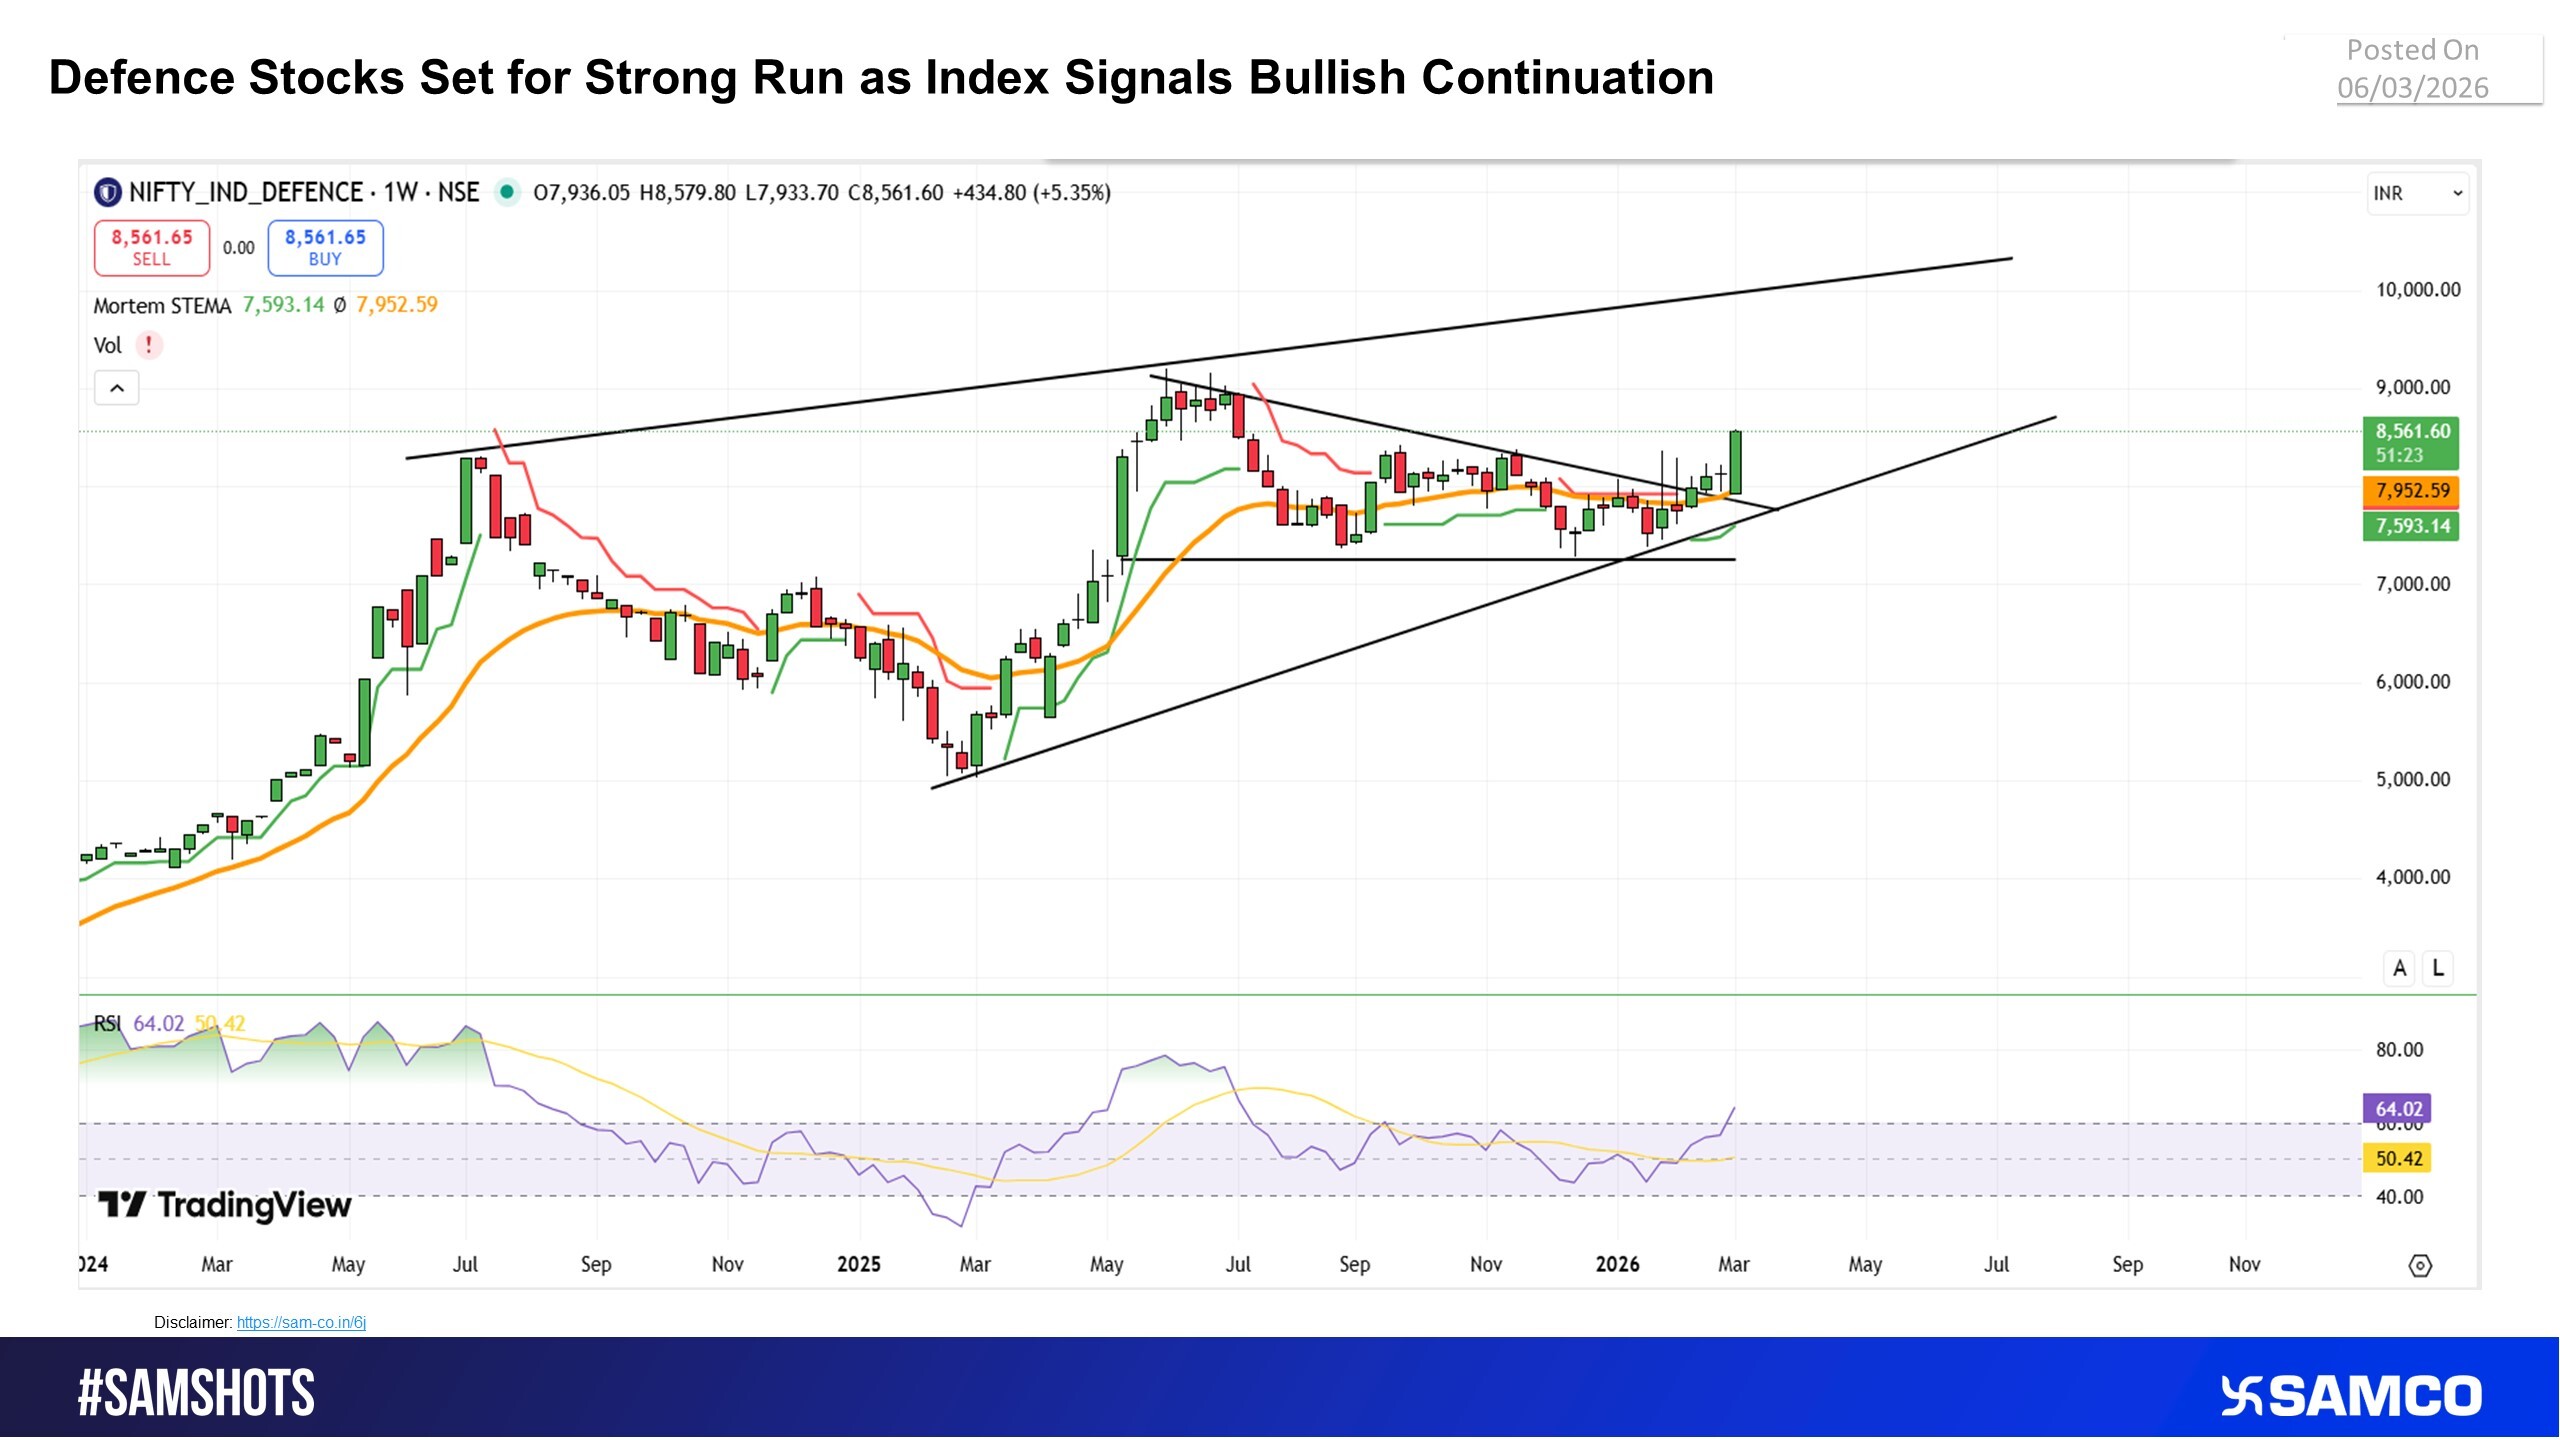
Defence Stocks Regain Momentum as Index Signals Fresh Upside Potential
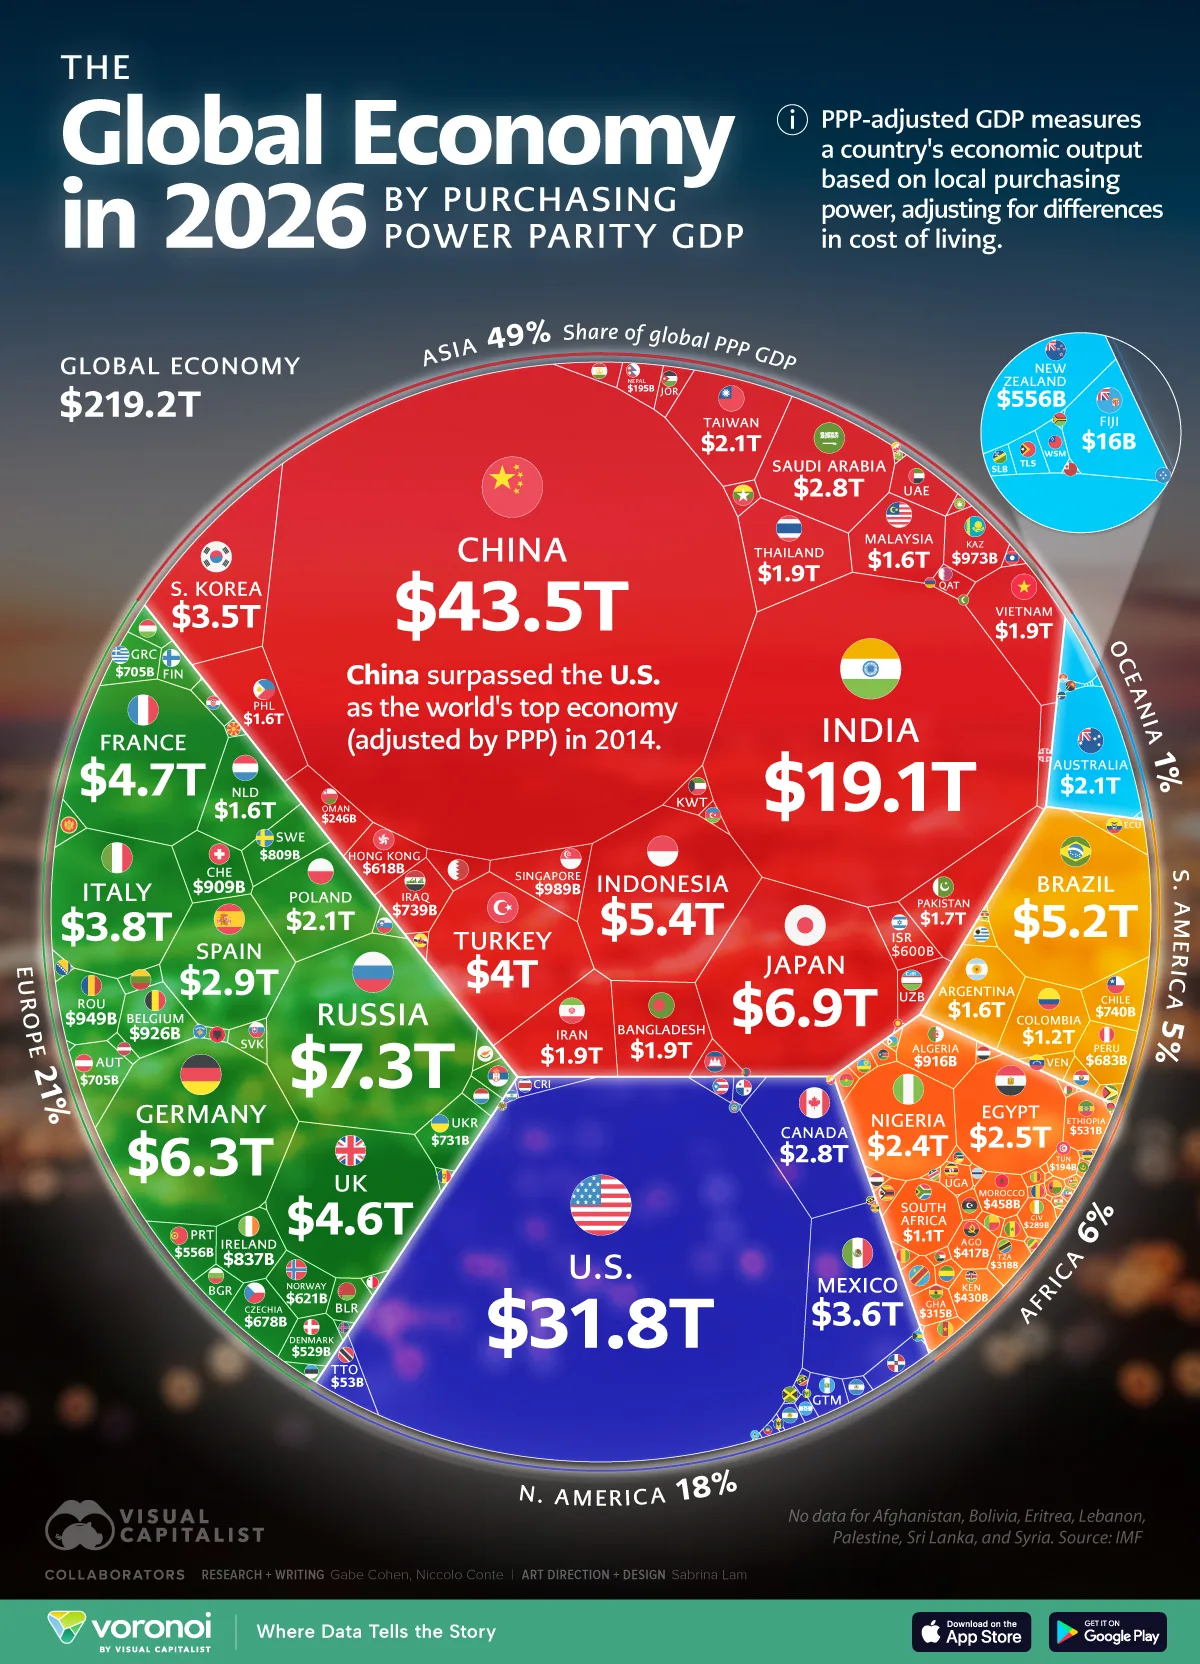
Visualcapitalist.com


 Easy & quick
1. Register on SCORES portal
2. Mandatory details for filling complaints on SCORES
Name | PAN | Address | Mobile | Number | E-mail ID
3. Benefits
Effective Communication
Speedy redressal of the grievances