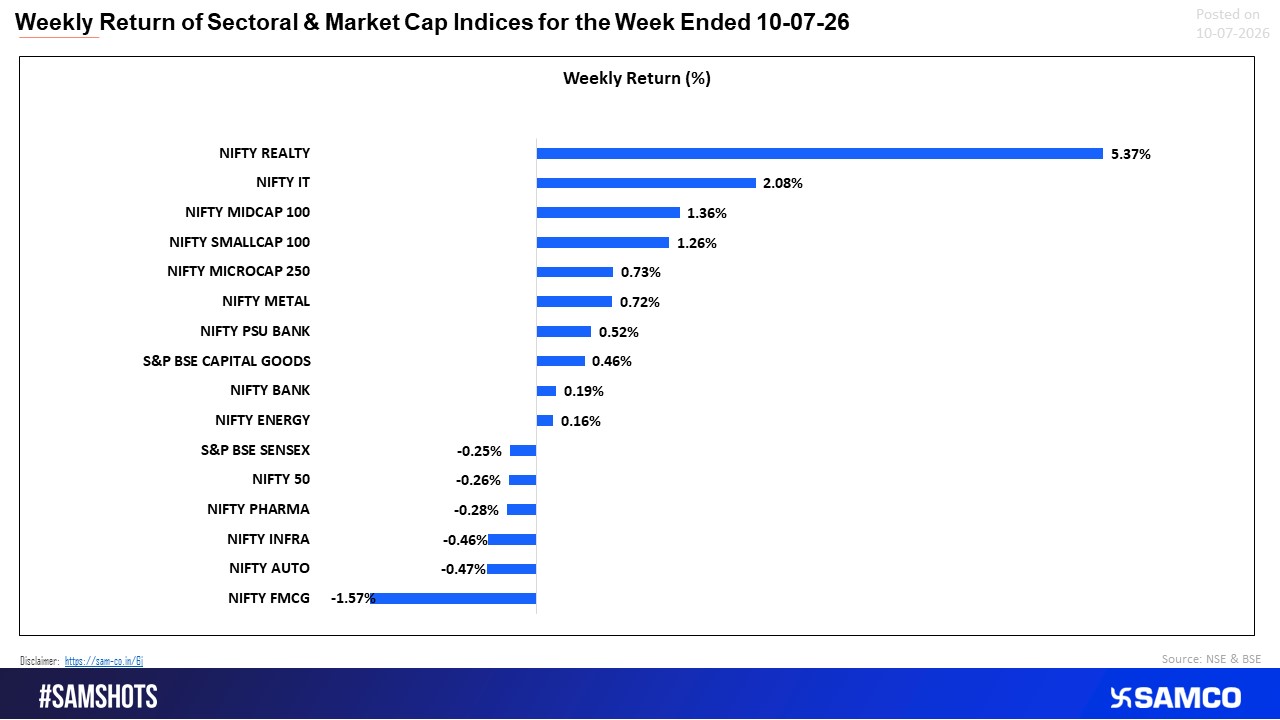
Indian equities witnessed a volatile week, with escalating Middle East tensions triggering sharp selling before strong gains in IT stocks helped markets recover. The Nifty 50 and Sensex rebounded from weekly lows, although sentiment remained cautious amid rising crude oil prices and global uncertainty.
Sectorally, Nifty IT led the gains, supported by strong Q1 earnings from TCS, while energy stocks remained in focus as Brent crude surged above $78 per barrel following the U.S.-Iran conflict. Broader markets, however, faced intermittent pressure due to concerns over inflation and higher oil prices.
Globally, markets shifted to a risk-off stance as geopolitical tensions intensified, while AI and semiconductor stocks saw profit-taking, weighing on Asian markets. Despite this, South Korean chipmaker SK Hynix completed its record $26.5 billion Nasdaq listing, the largest-ever U.S. listing by a foreign company.
Among corporate highlights, TCS rose around 4% high after reporting a 5% YoY increase in Q1 net profit to ?13,349 crore, announcing an interim dividend of ?12 per share, and raising its AI revenue run rate to $2.6 billion. Meanwhile, domestic gold prices eased as safe-haven demand moderated towards the end of the week.
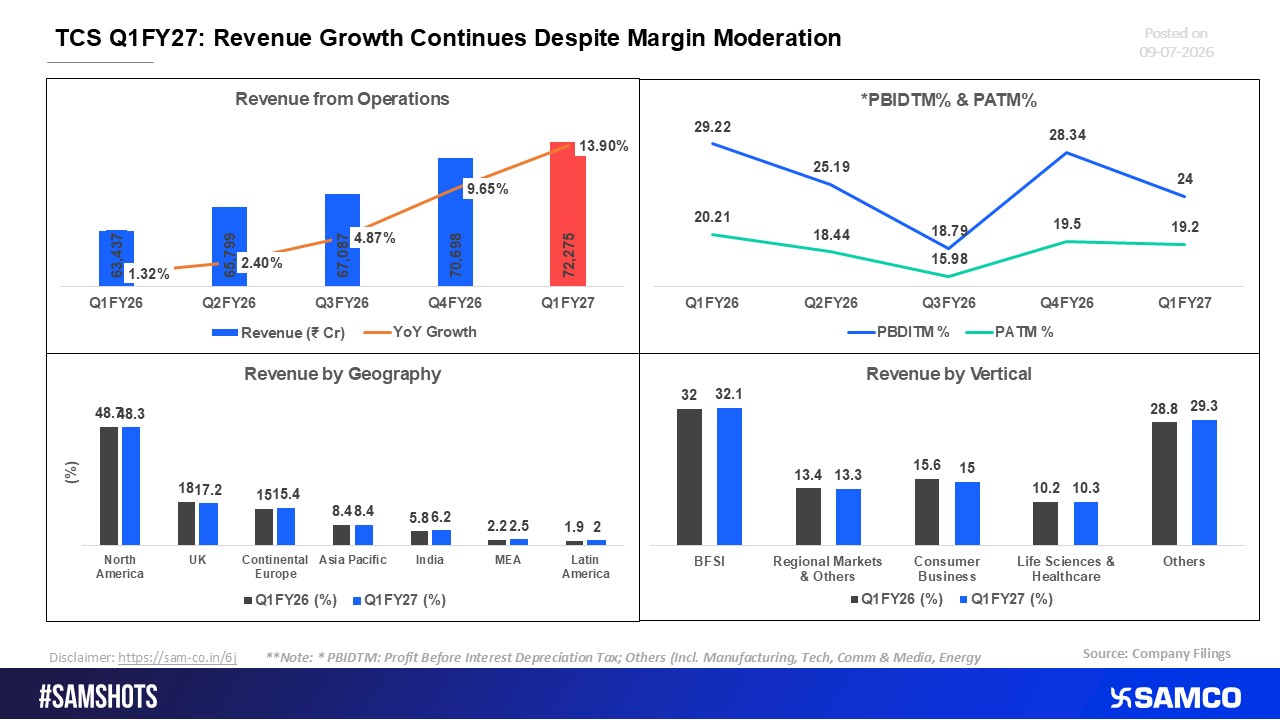
TCS Q1 FY27: Steady Revenue Growth Amid Margin Moderation


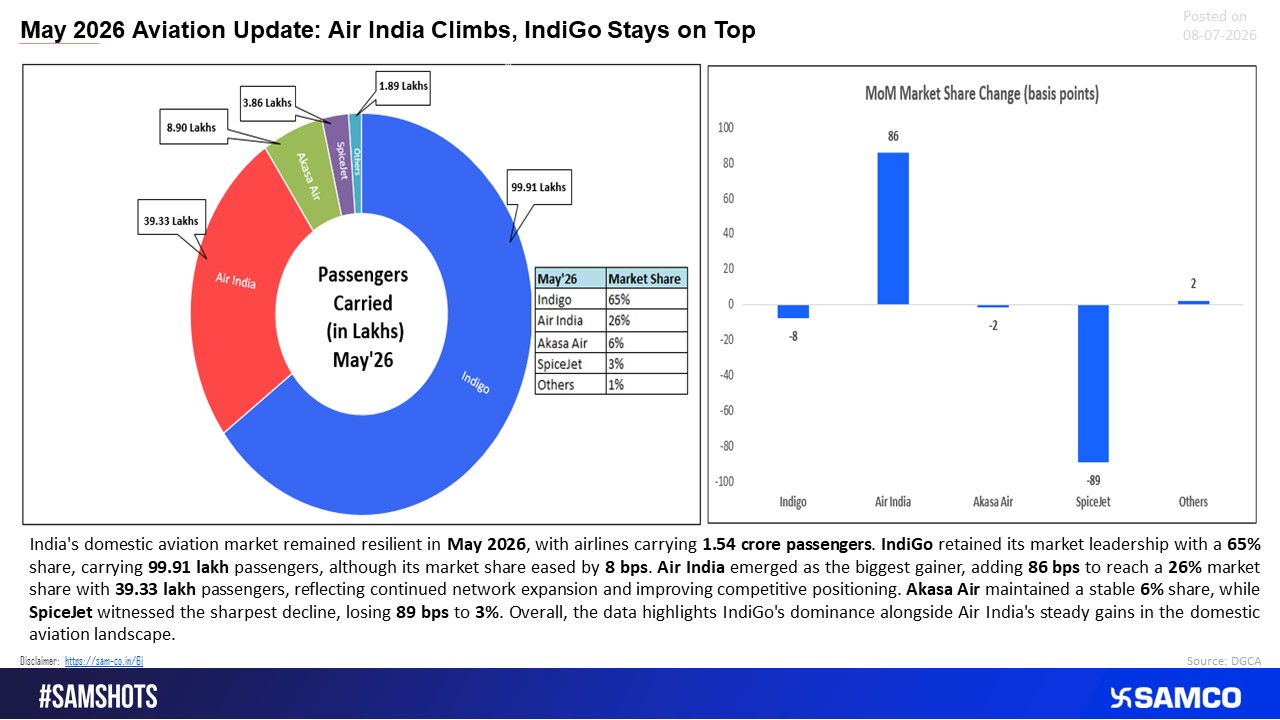
Air India Climbs, IndiGo Continues to Lead the Skies
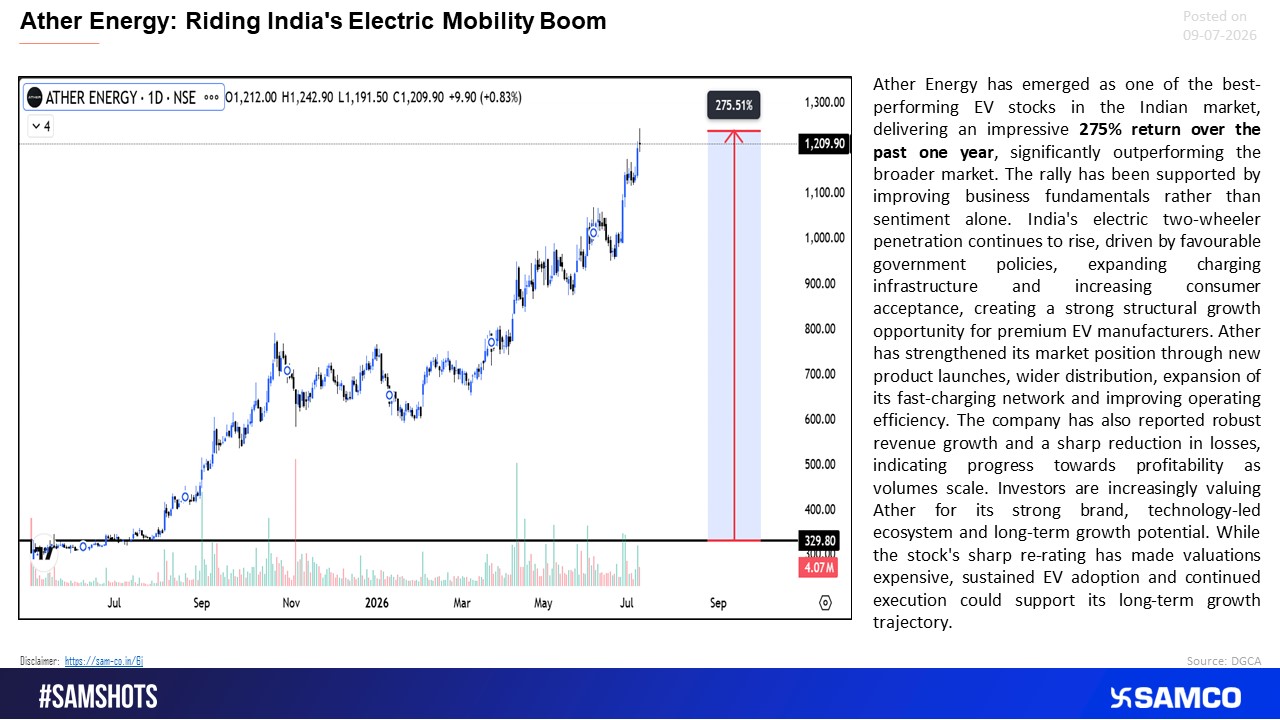
Ather Energy Charges Ahead on India\'s EV Growth Story
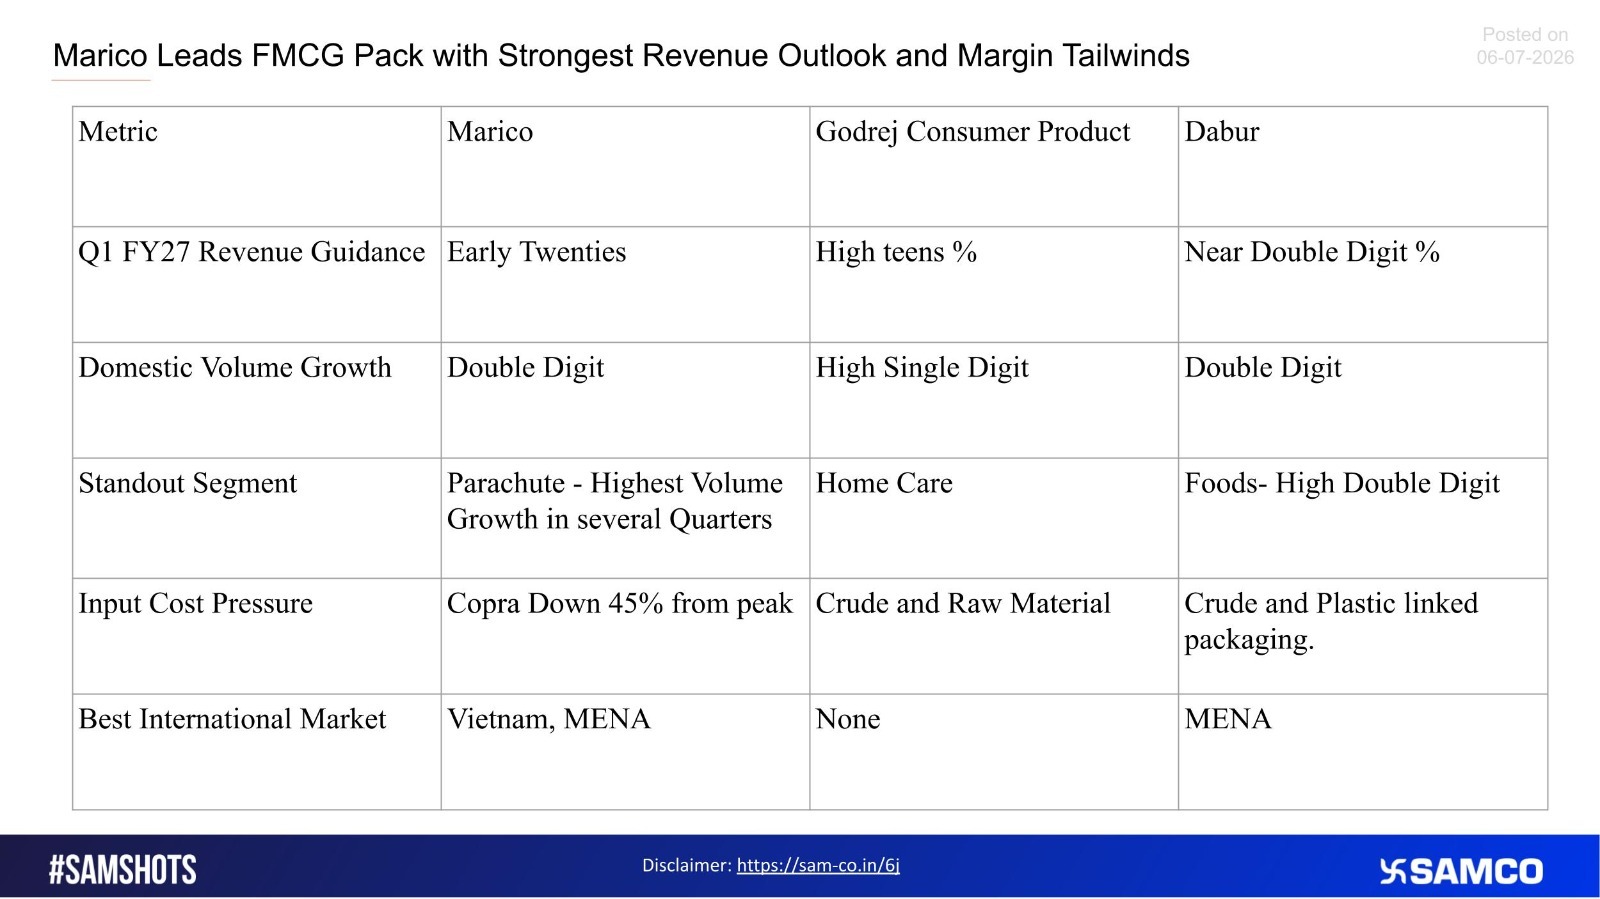
Q1 FY27 Business Updates Lifts FMCG Stocks.
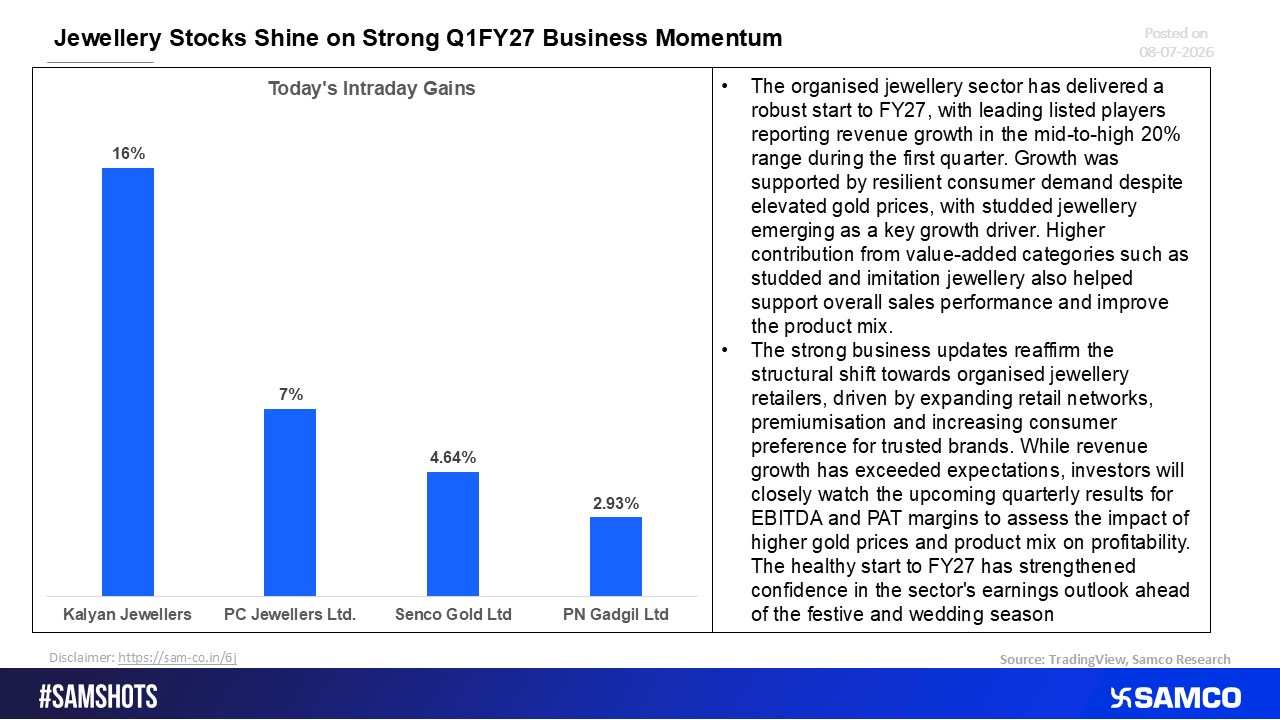
Jewellery Stocks Rally on Robust Q1 FY27 Business Momentum
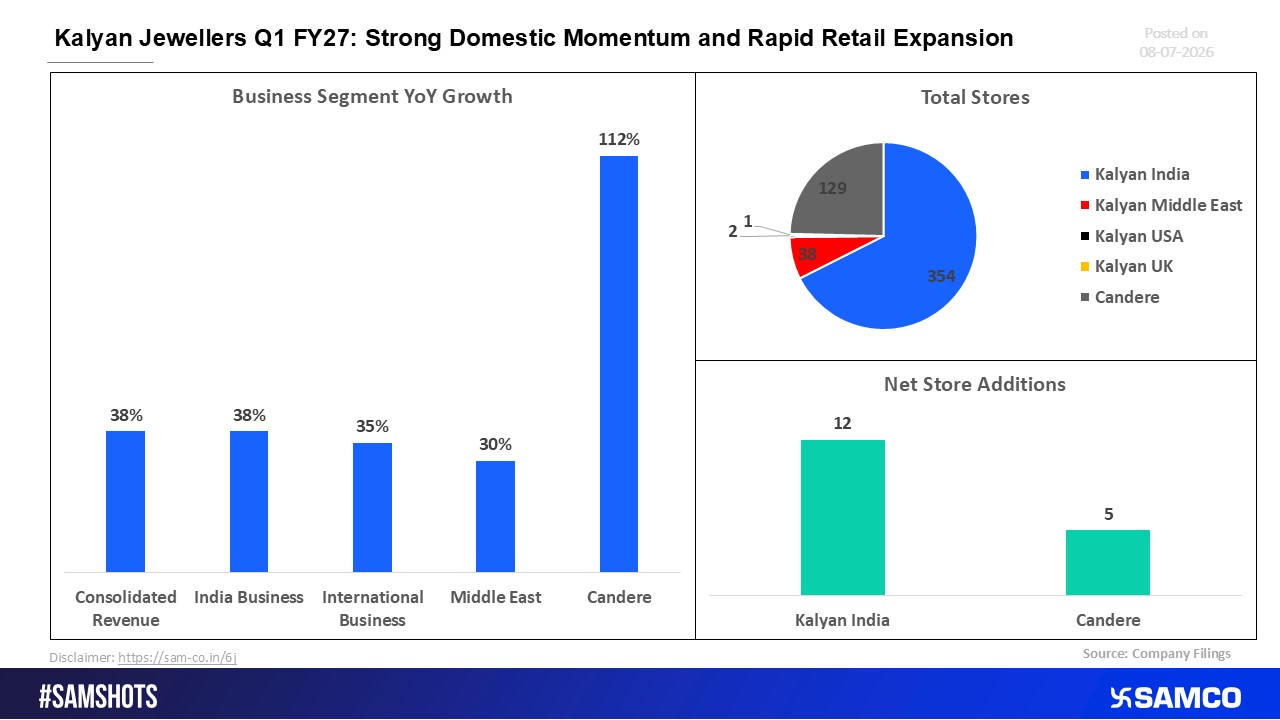
Kalyan Jewellers Q1 FY27: Robust Domestic Growth Drives Aggressive Store Expansion
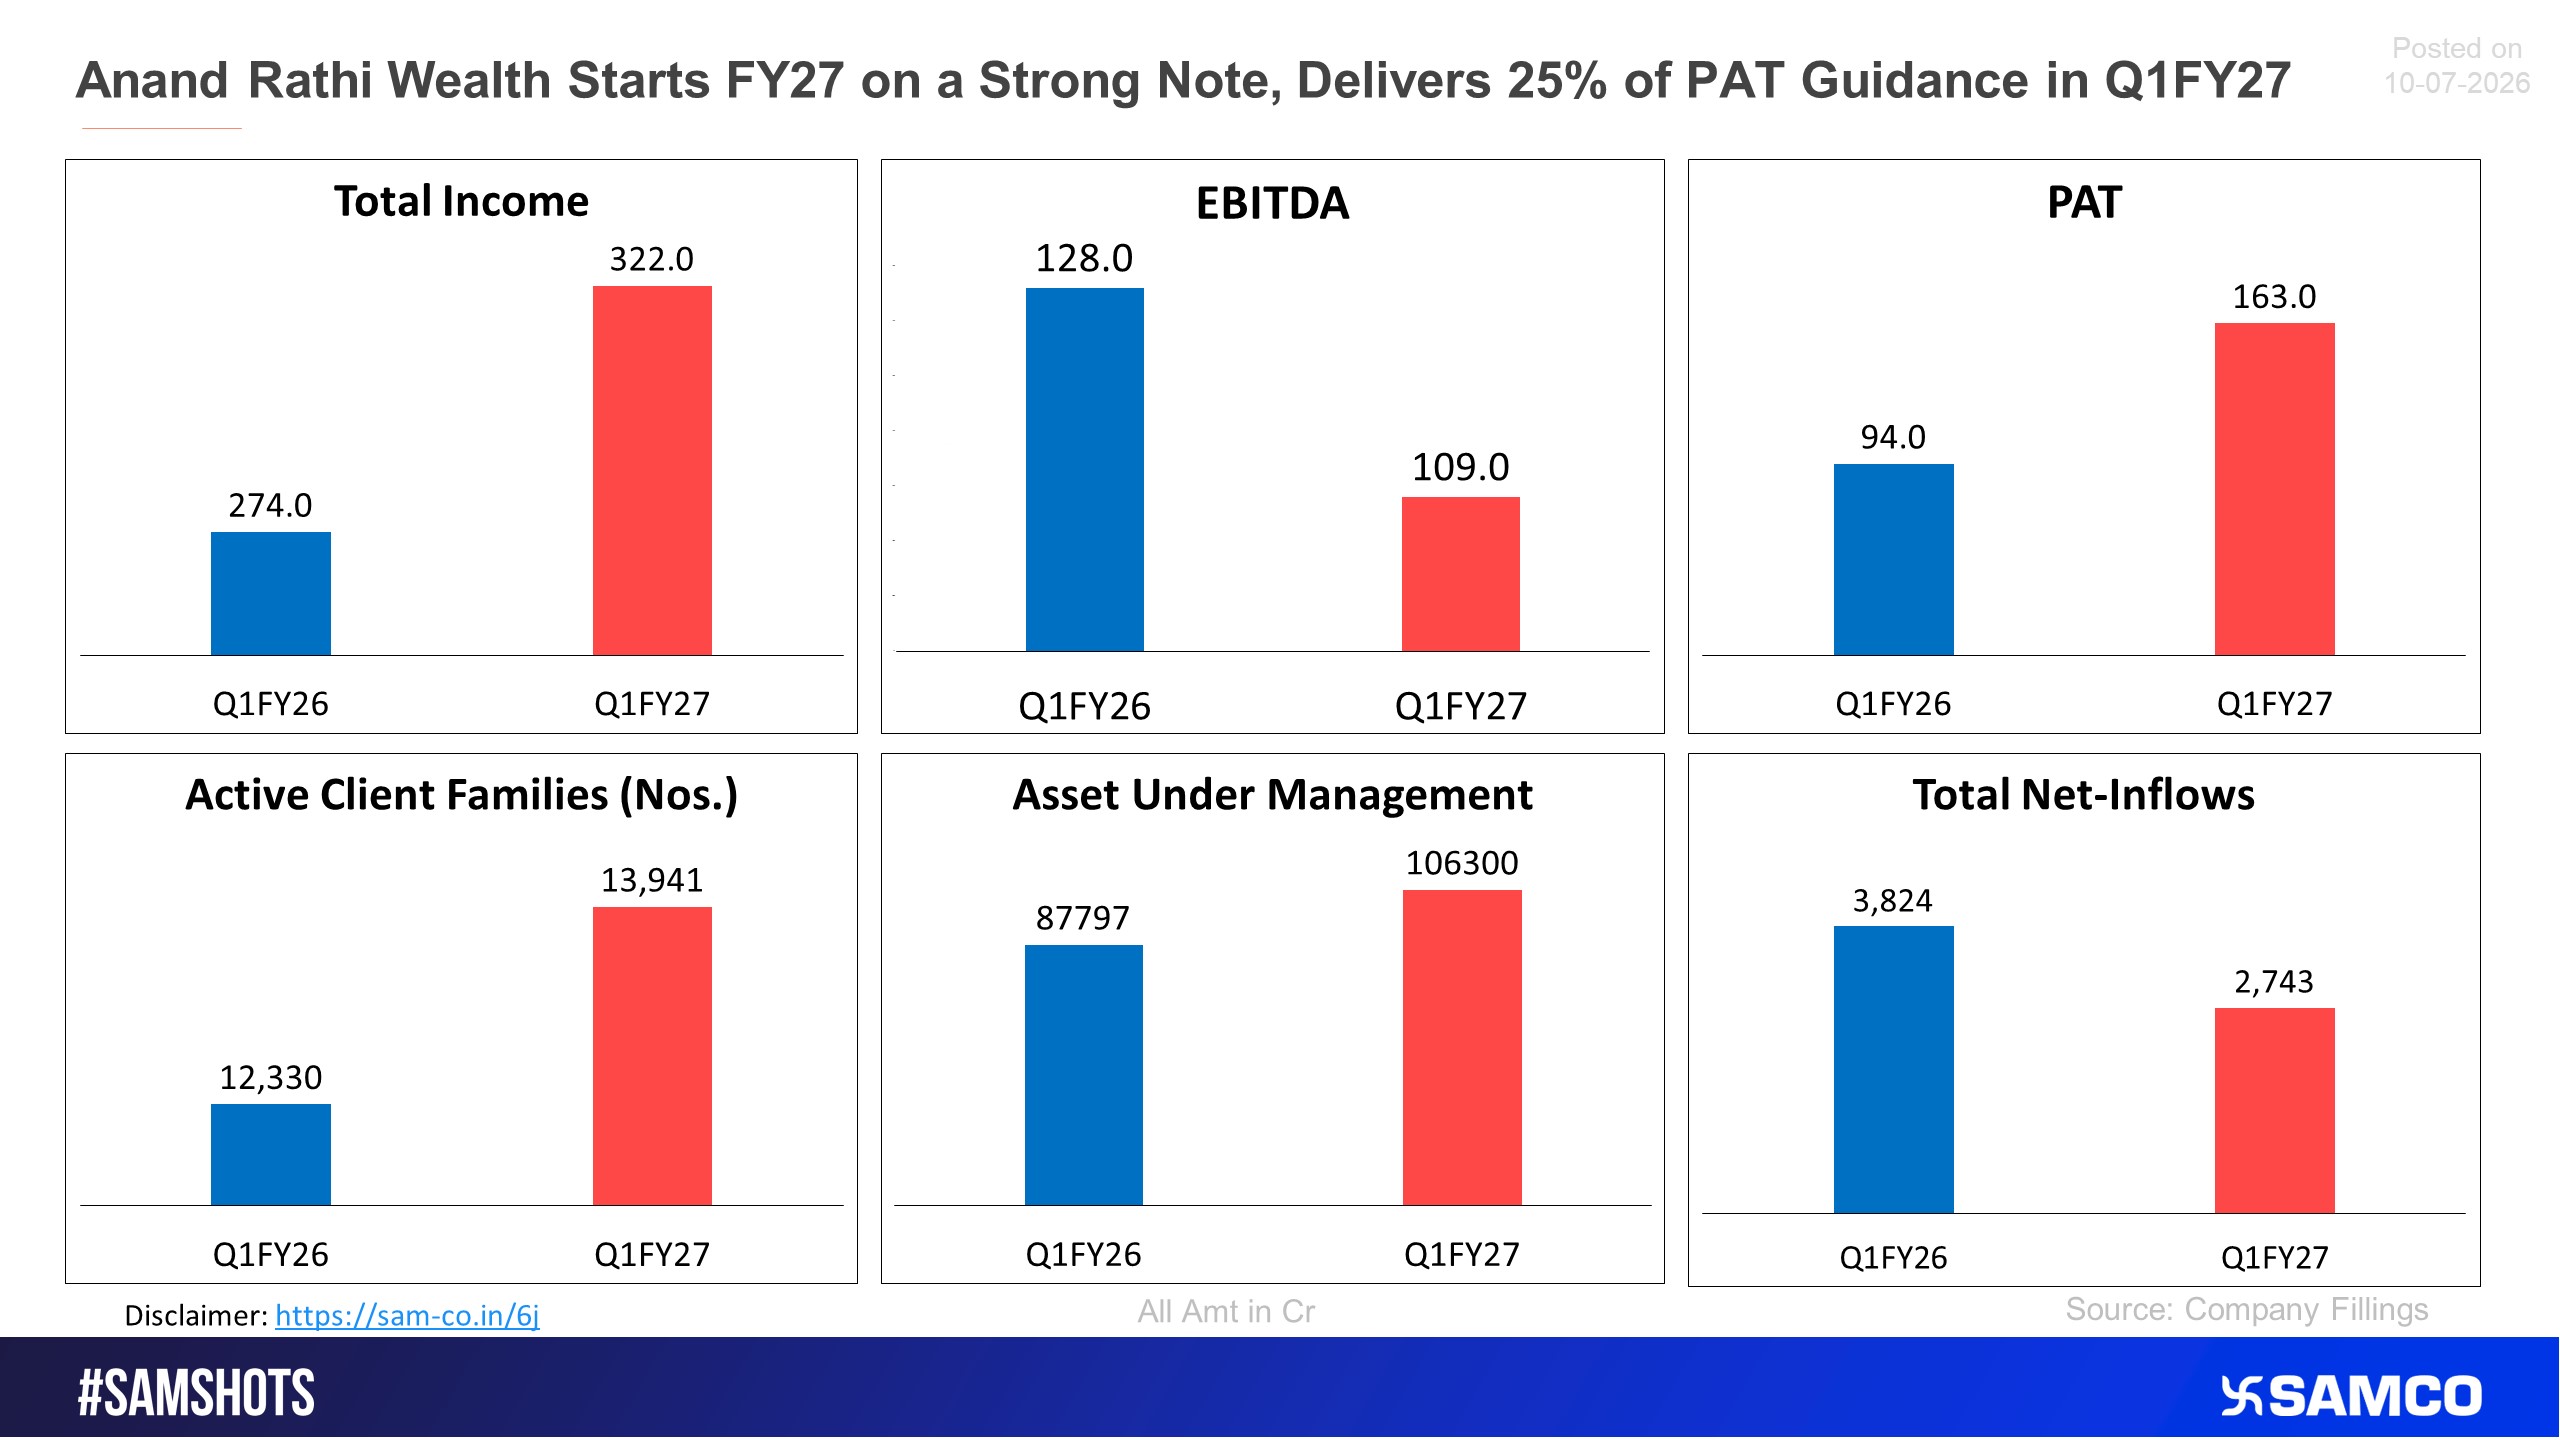
Here’s how Anand Rathi performed in Q1FY27.
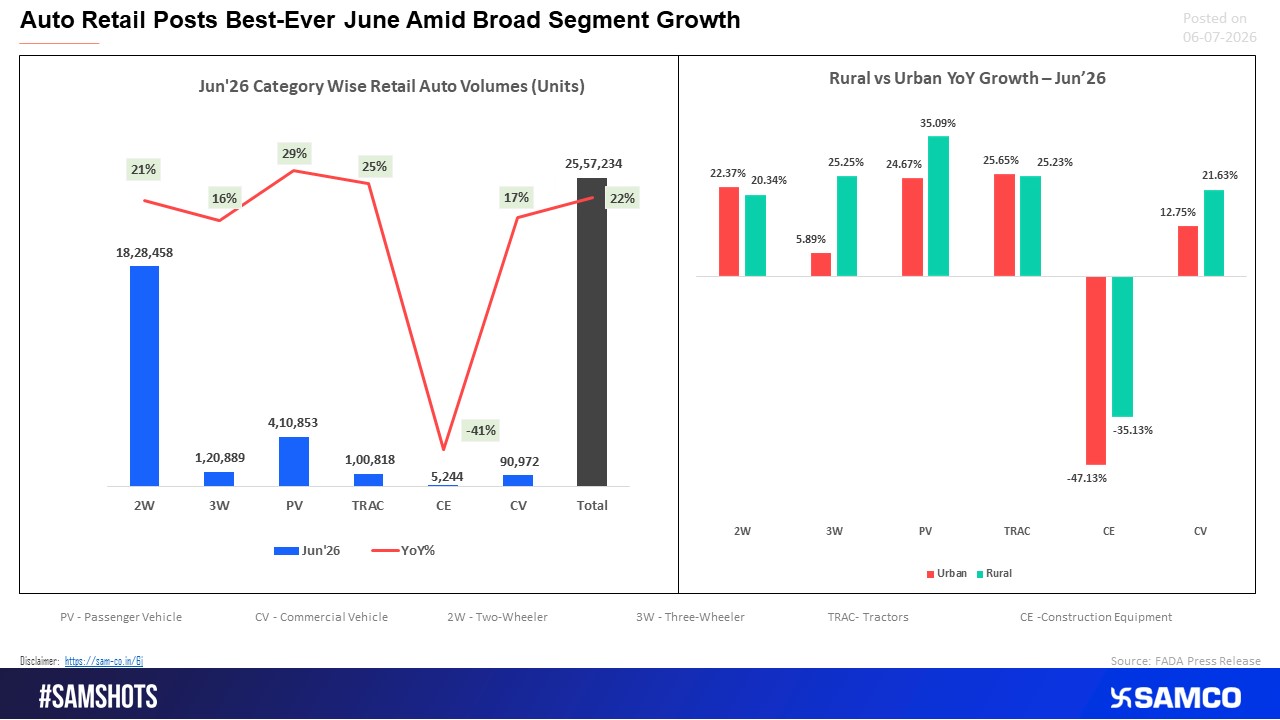
India\'s Auto Retail Clocks Best-Ever June Performance
Sector Rotation Favours Realty and Midcaps This Week
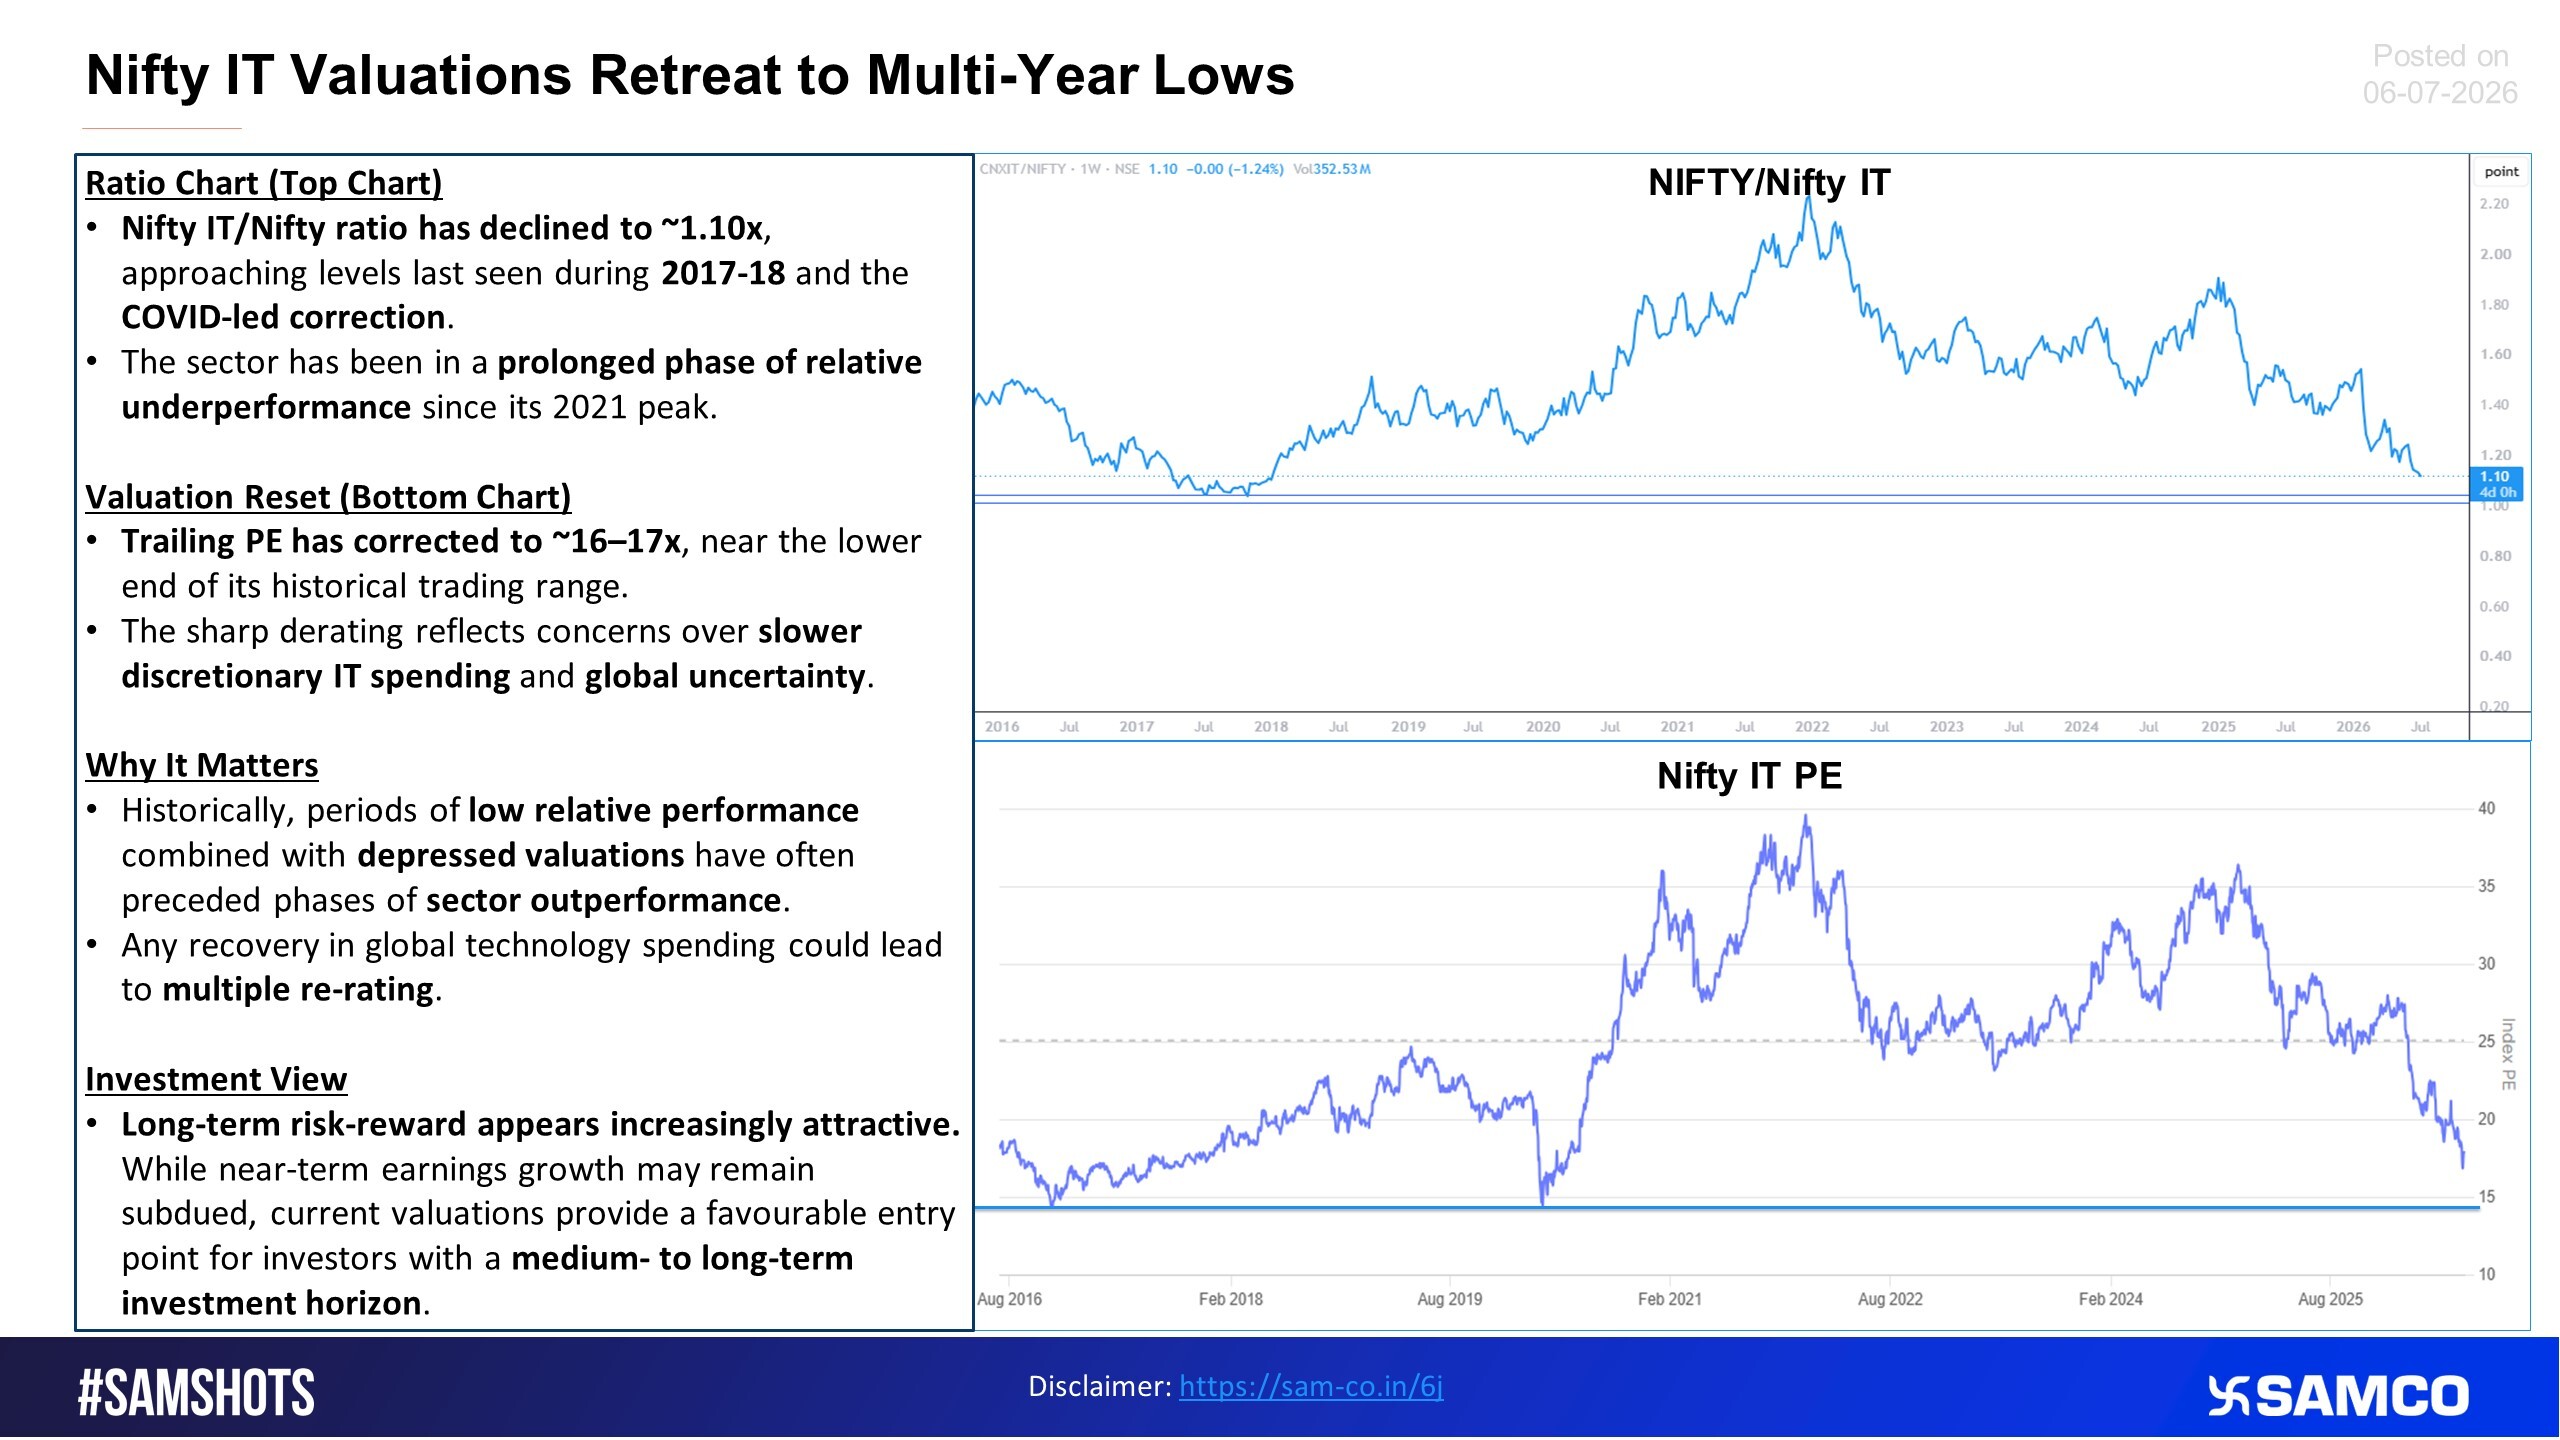
Nifty IT Trades at Multi-Year Low Valuations
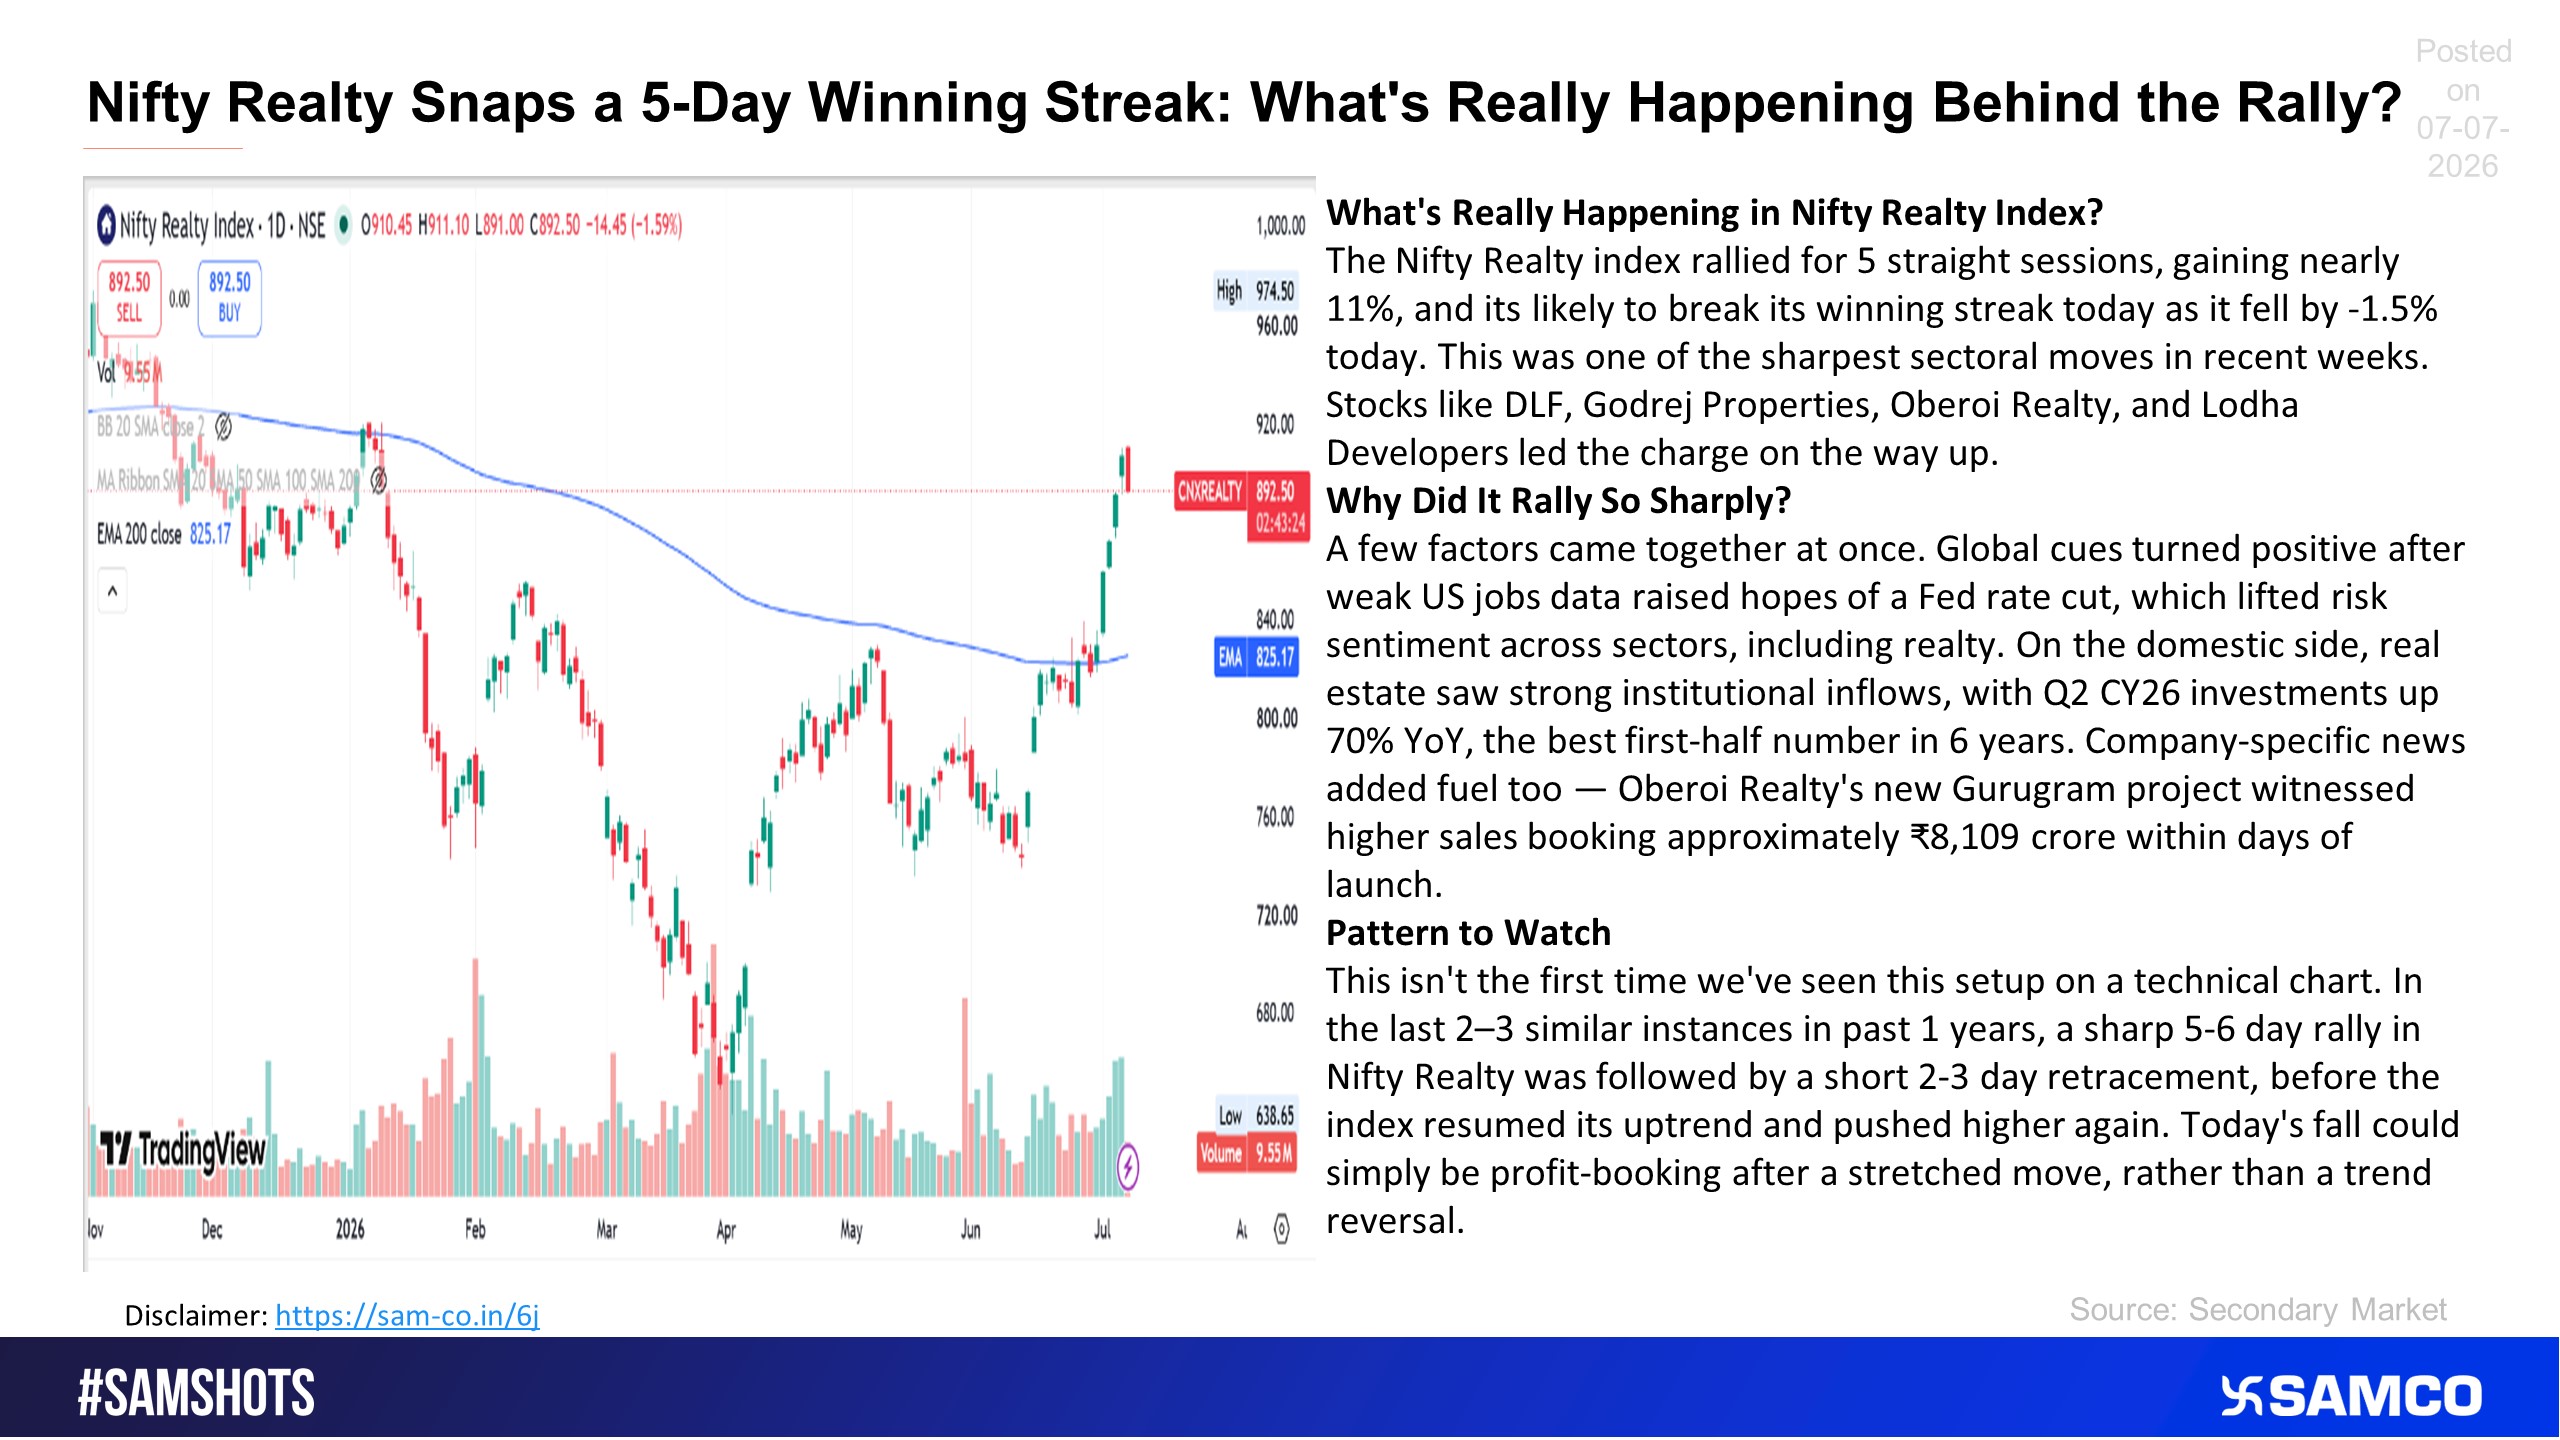
Here’s a snapshot of what is exactly happening in the Nifty Realty Index
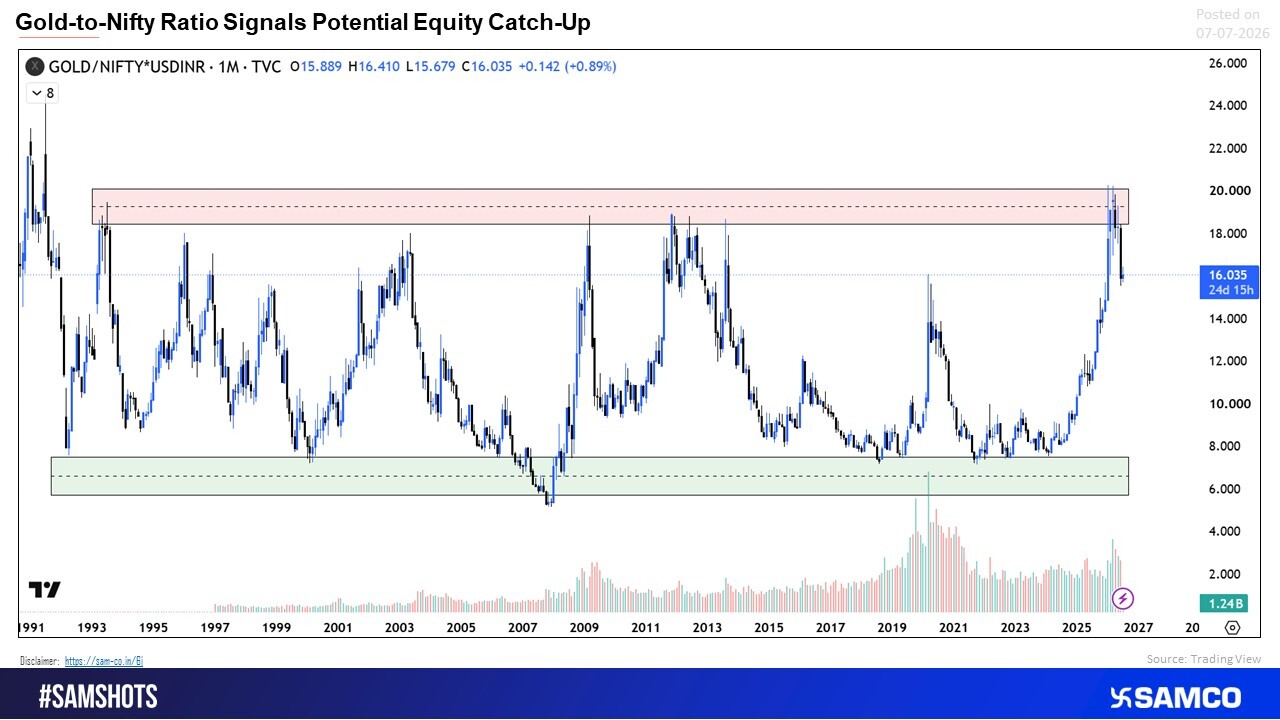
Gold-to-Nifty Ratio Signals Potential Market Rotation
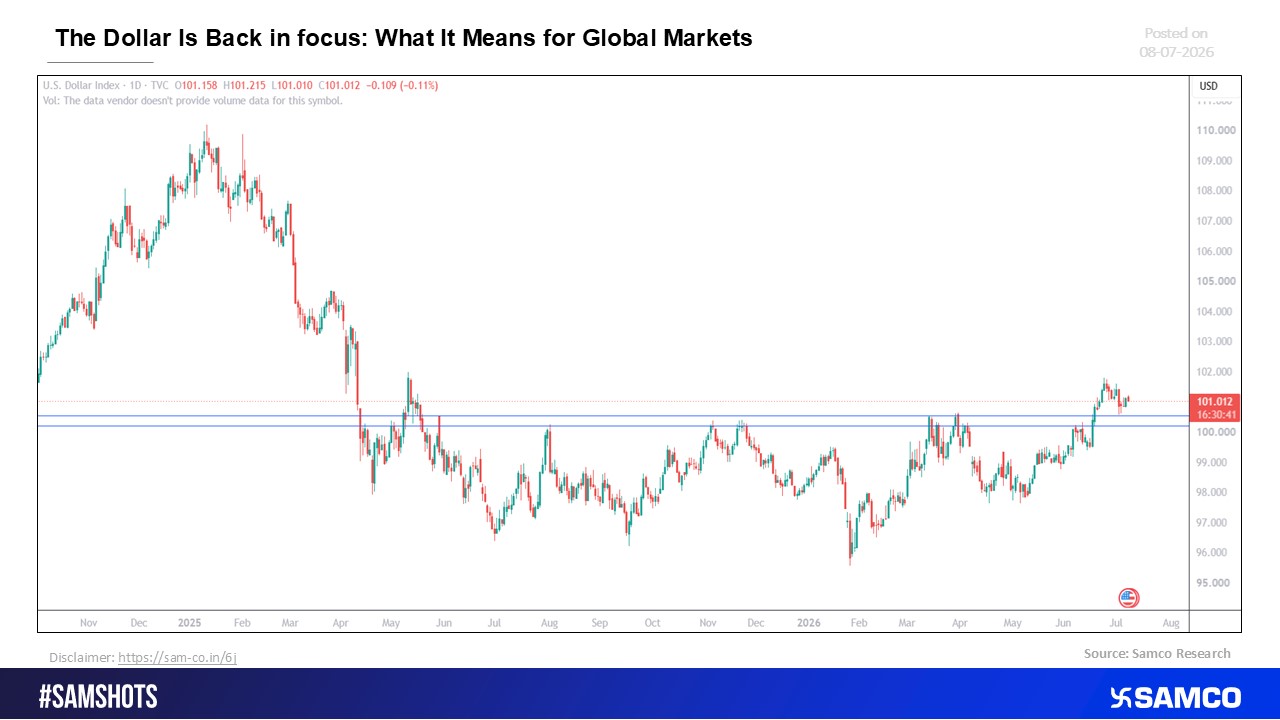
The Dollar Rebounds: What It Means for the Global Economy and Markets
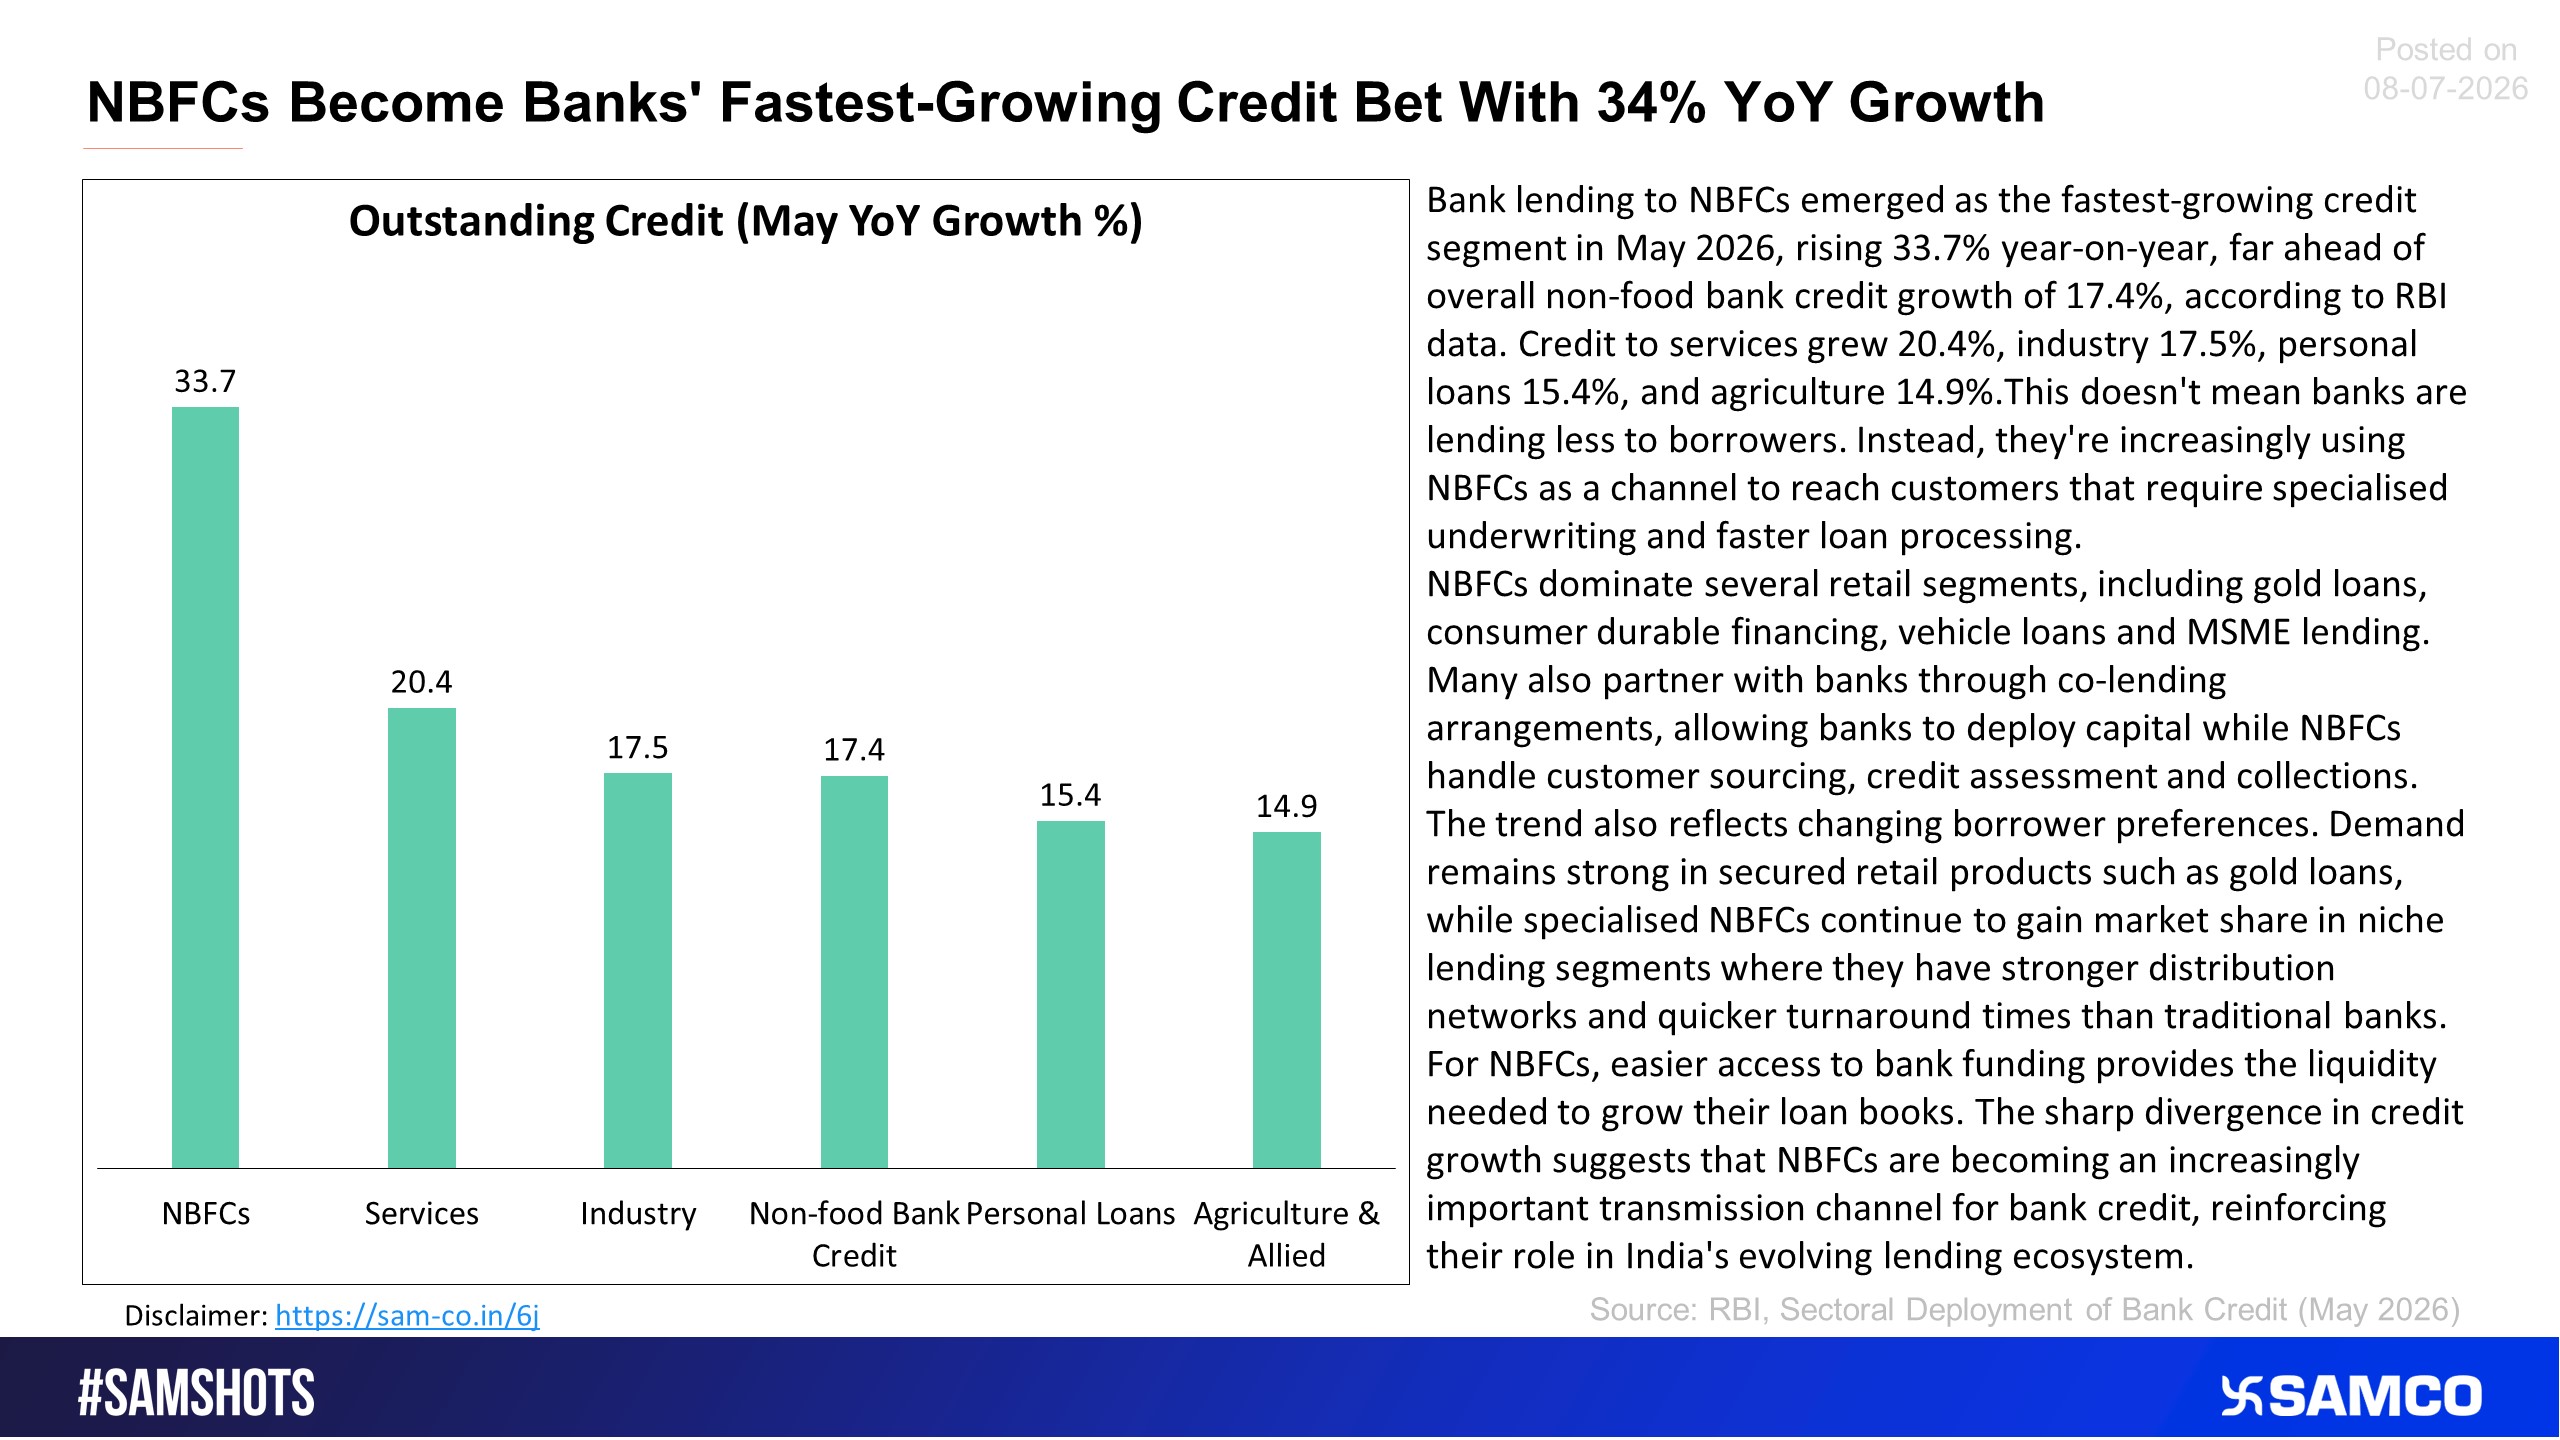
The below snip shows YoY growth in Bank’s lending segments.
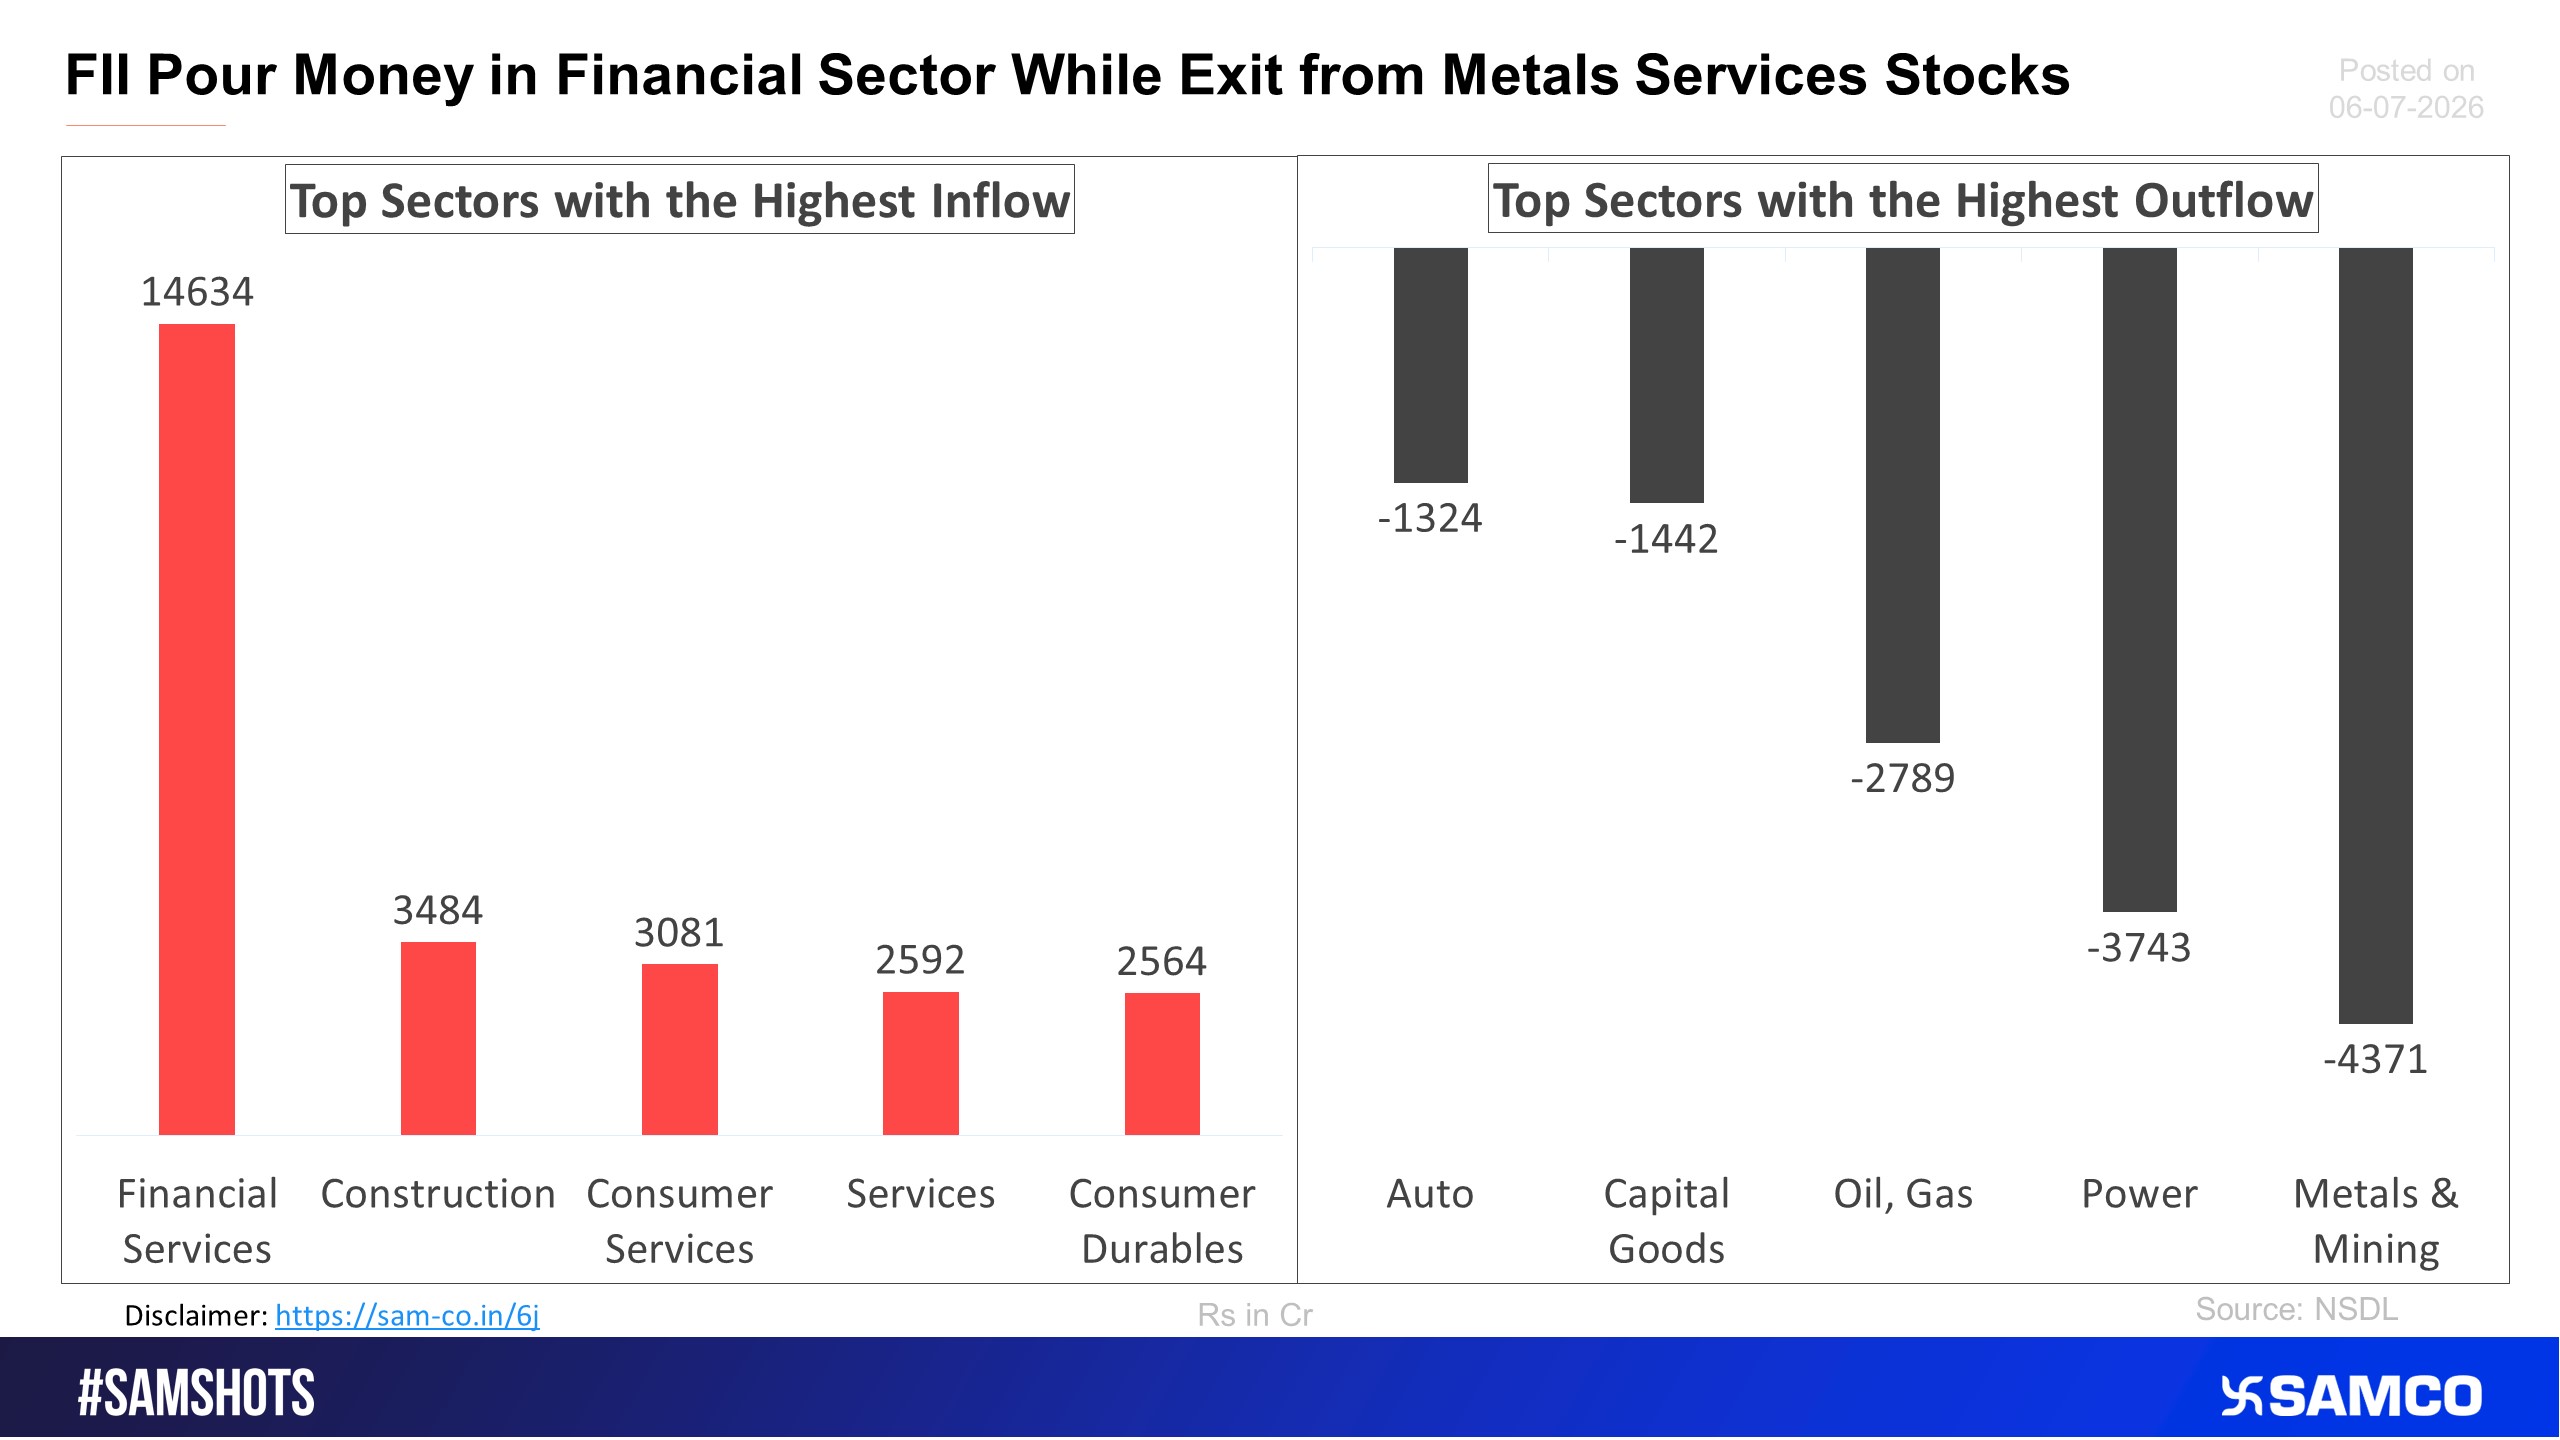
Here’s the list of sectors that witnessed the highest & lowest FPI selling in the previous fortnight
Here’s the sectoral % of outflow compared to the previous fortnight.
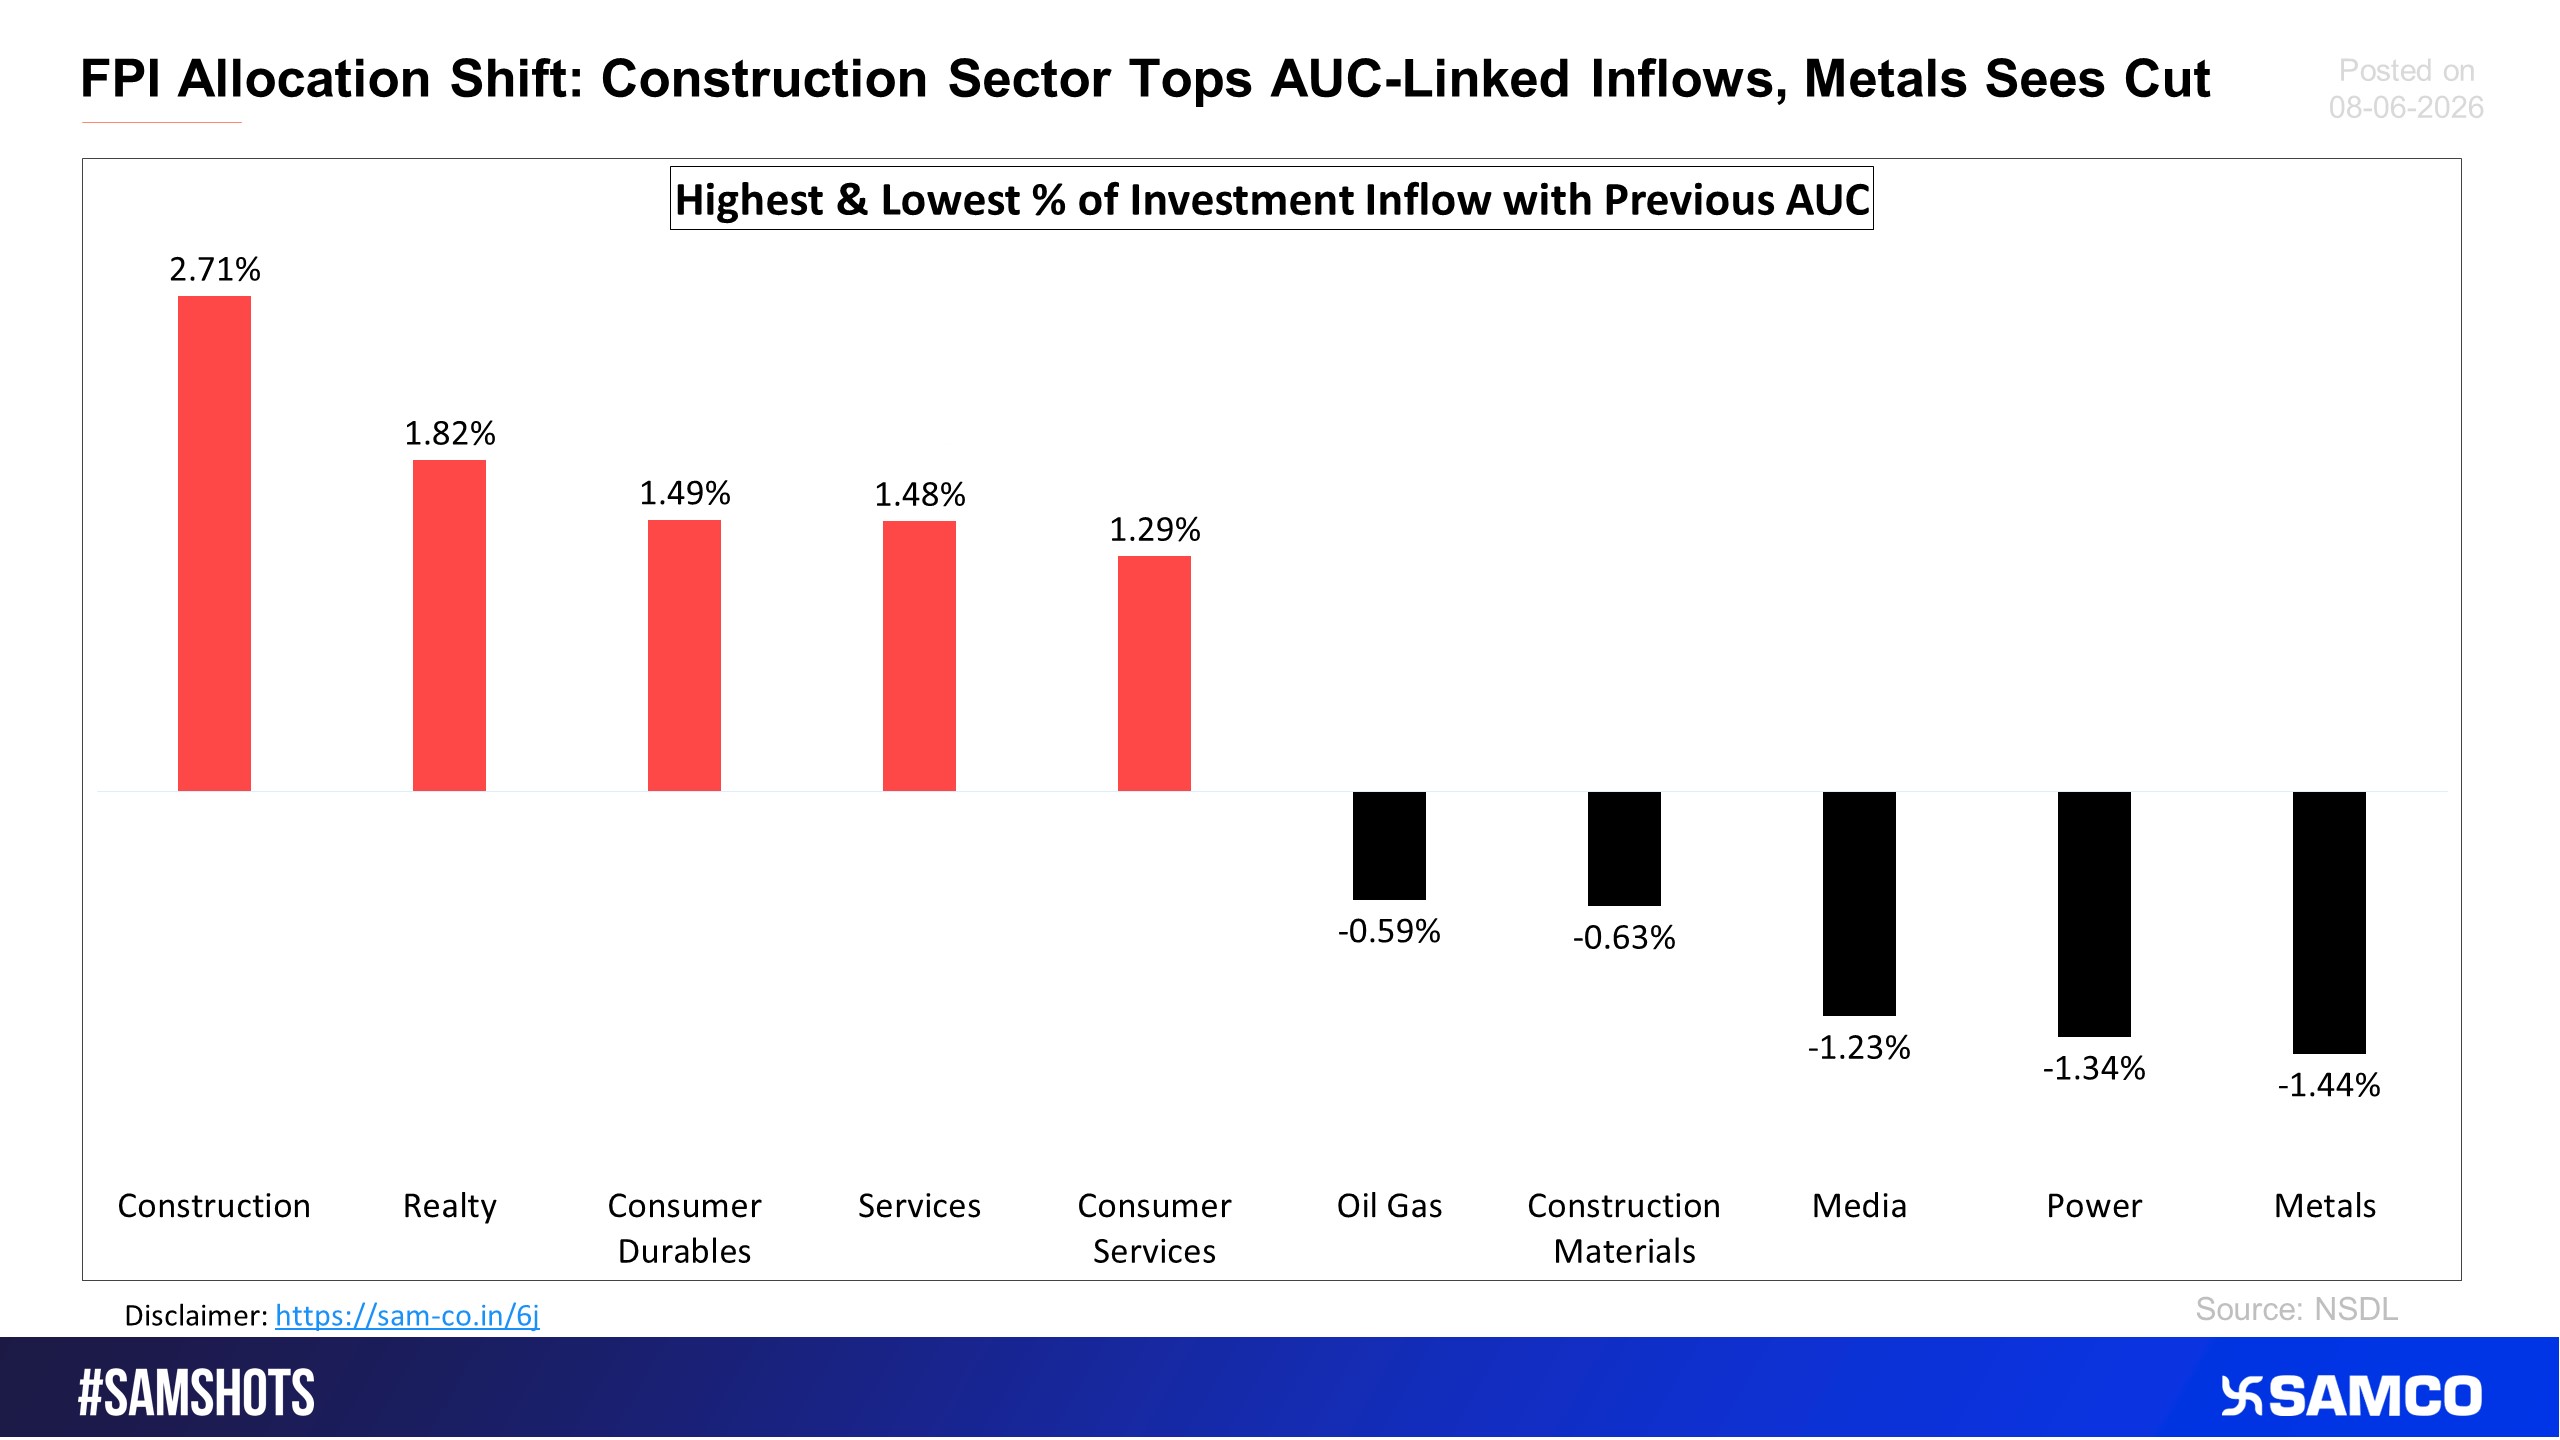
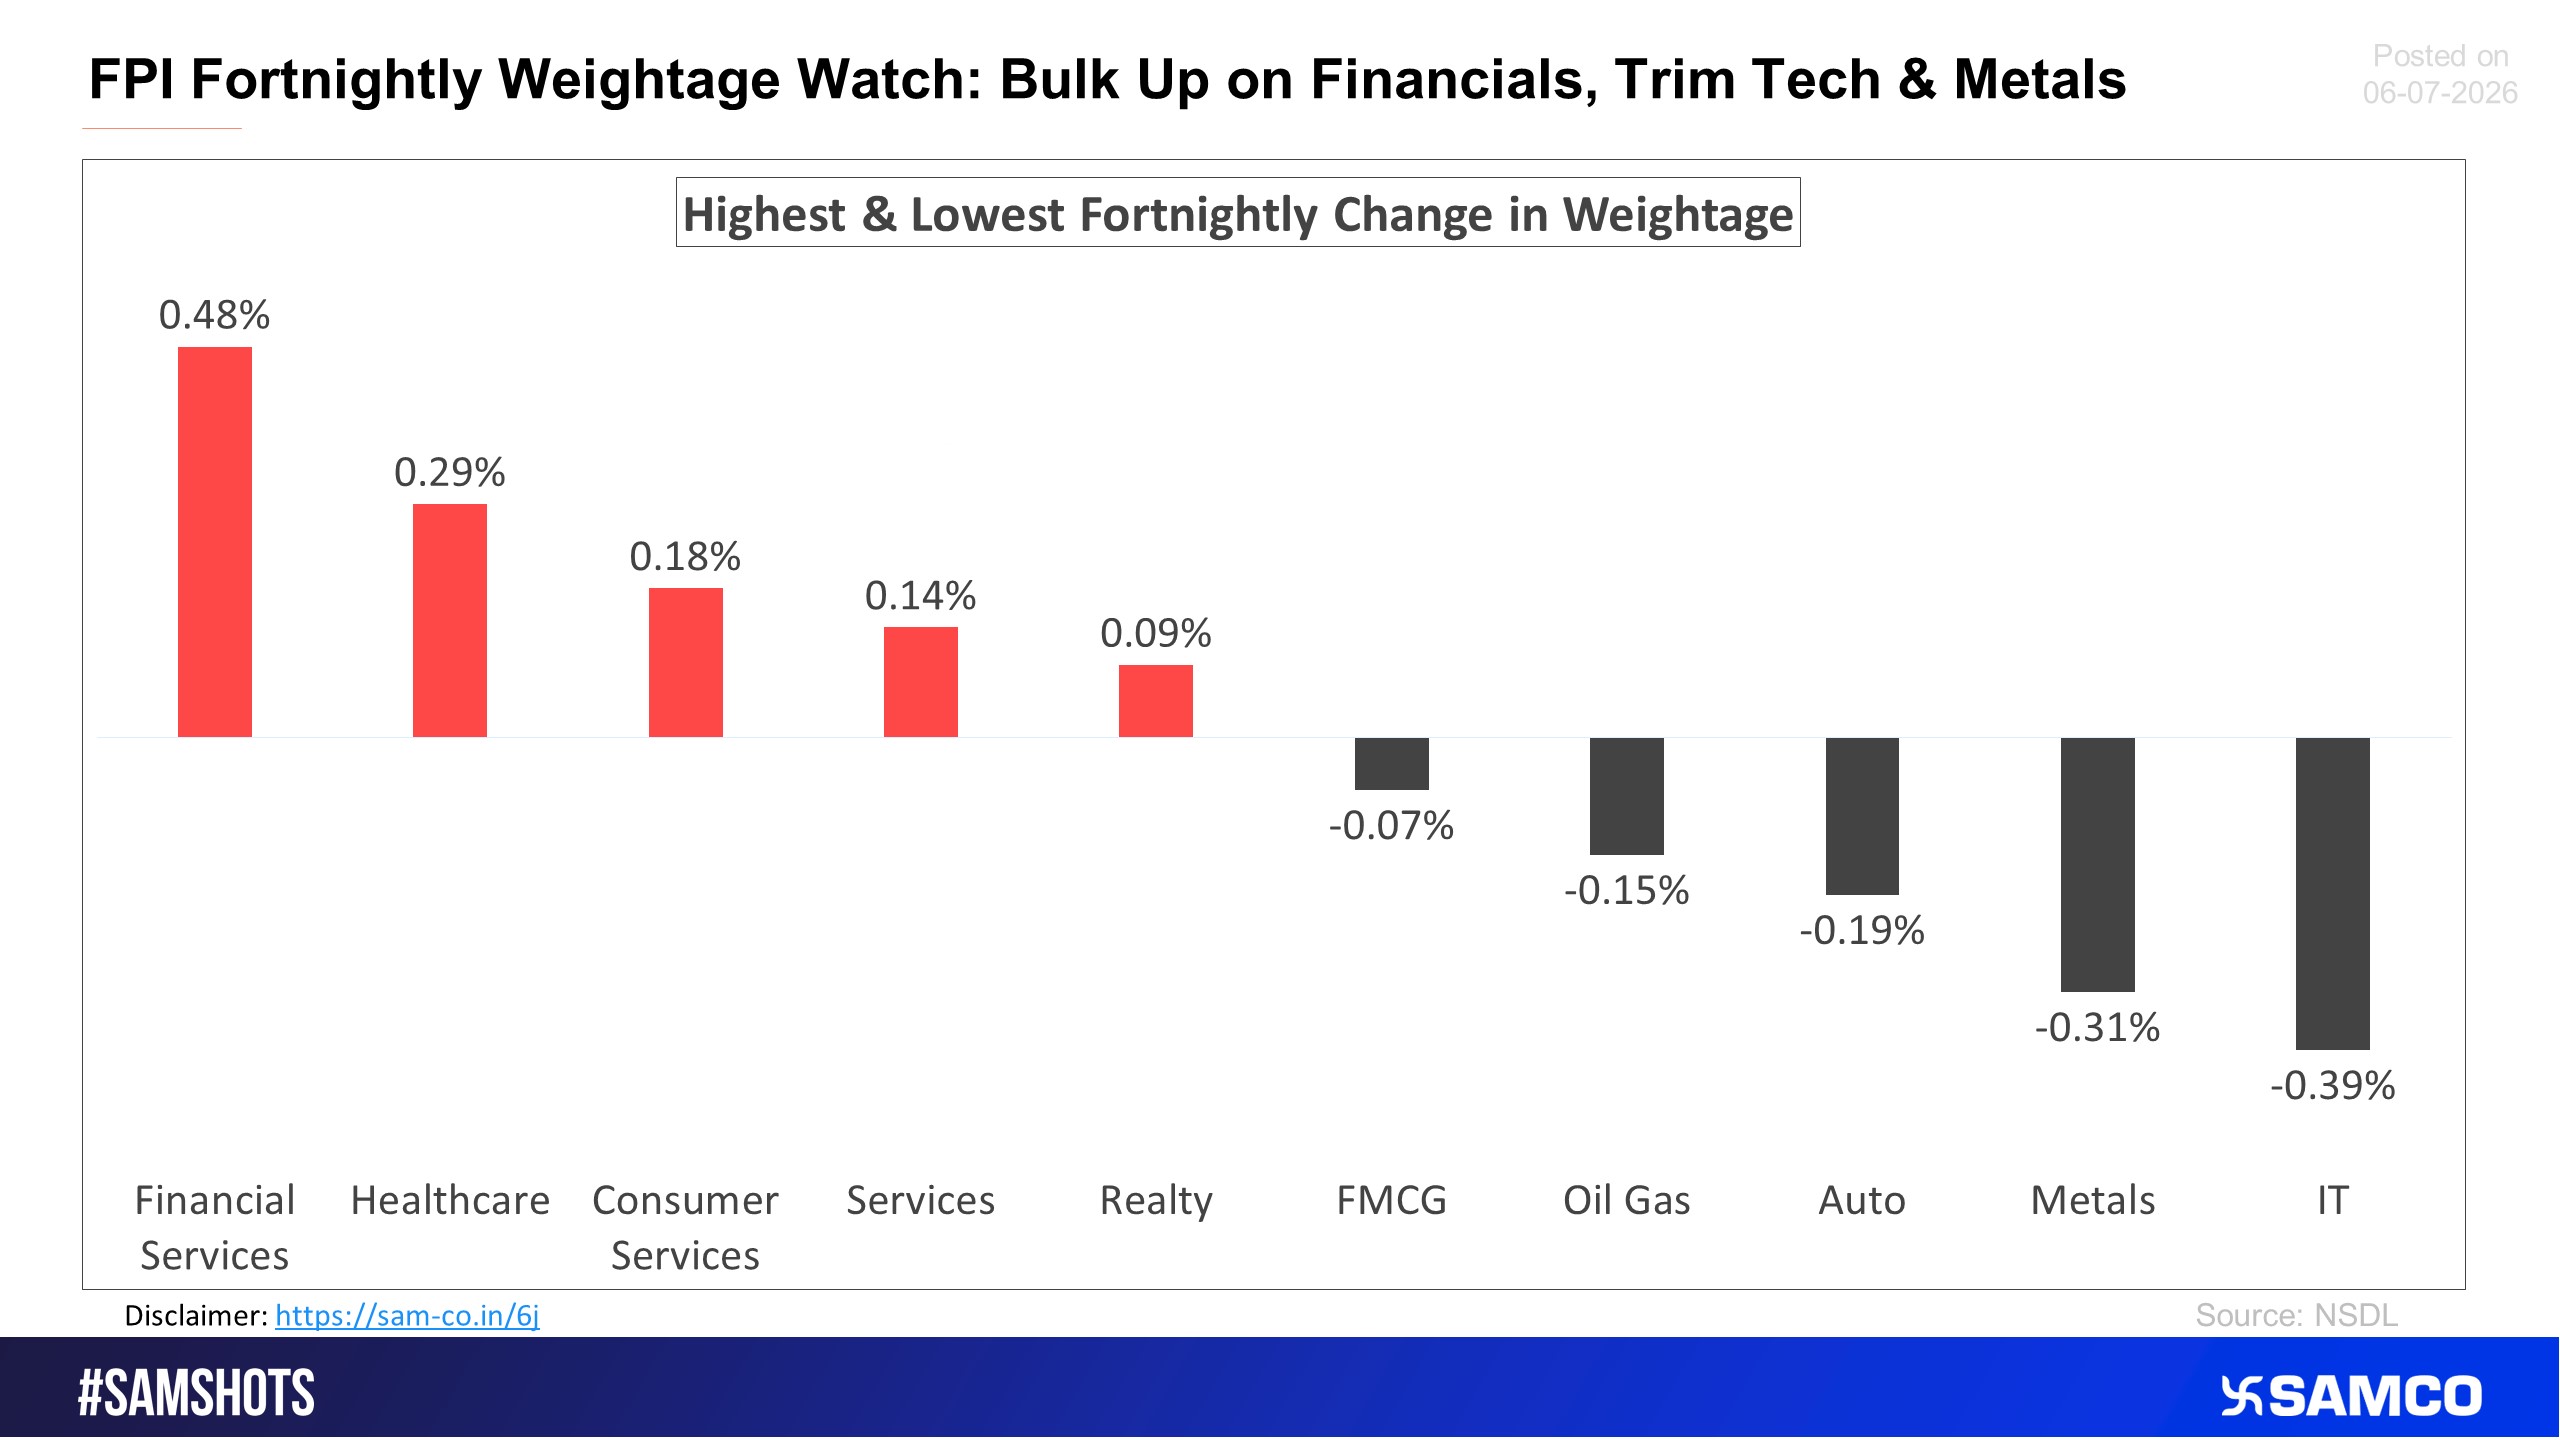
The chart below shows the change in sectoral weightage of FPI holdings.
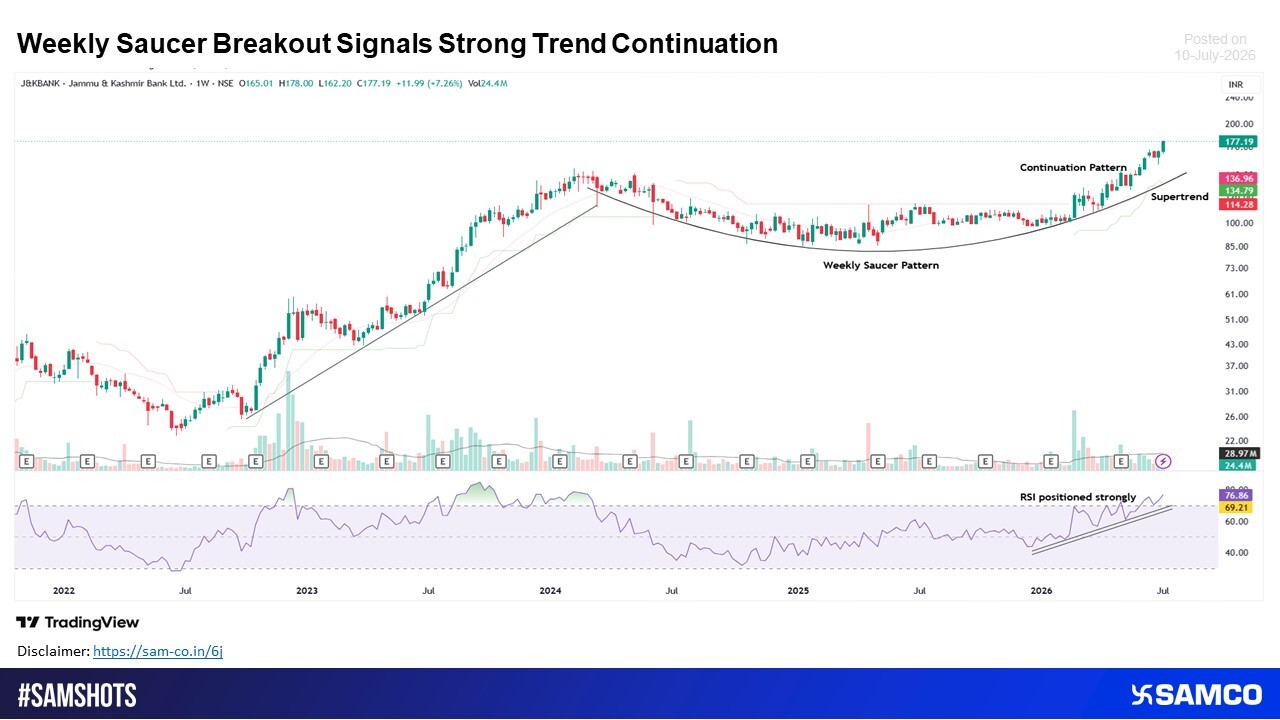
J&K Bank is progressing through a weekly saucer pattern and has now moved above the neckline, confirming a long-term trend continuation. The stock is trading firmly above its Supertrend indicator, which reflects sustained buying interest. A series of
Source: Visual Capitalist


 Easy & quick
1. Register On SCORES / SMARTODR Portal
2. Mandatory Details For filling Complaints on SCORES: (Name, PAN, Address, Mobile Number, Email ID)
3. Benefits
• Effective Communication
• Speedy Redressal of Grievance / Dispute
https://scores.sebi.gov.in/

