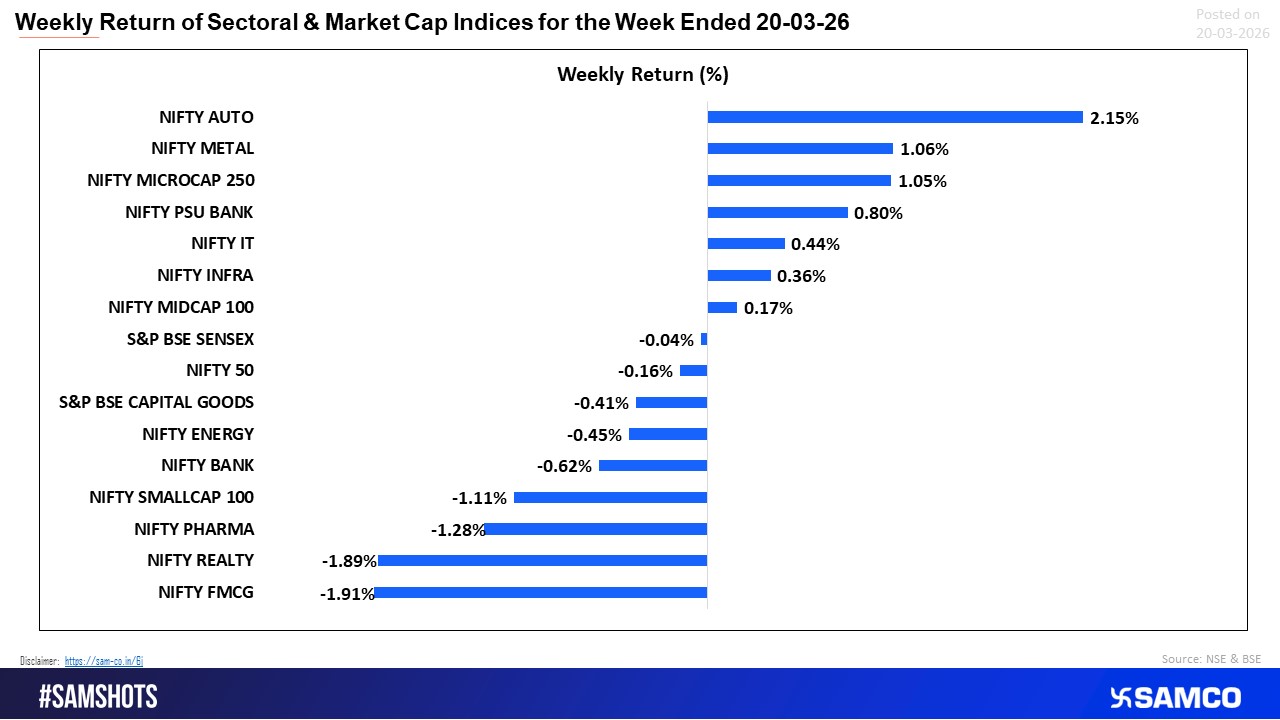
This week saw a mixed-to-negative market breadth, with sectoral divergence clearly visible across the Indian equity landscape. Nifty Auto (+2.15%) emerged as the top performer, followed by Metals and Microcaps, indicating selective risk appetite among market participants. PSU Banks and IT posted modest gains, while broader indices like Midcaps remained largely flat. On the downside, FMCG (-1.91%) and Realty (-1.89%) led the losses, reflecting defensive and rate-sensitive weakness respectively. Smallcaps and Pharma also witnessed corrections, signalling pressure in broader markets. Benchmark indices Nifty 50 and Sensex ended marginally negative, suggesting an absence of strong directional momentum — the week was largely driven by stock and sector-specific action rather than any broad-based trend.
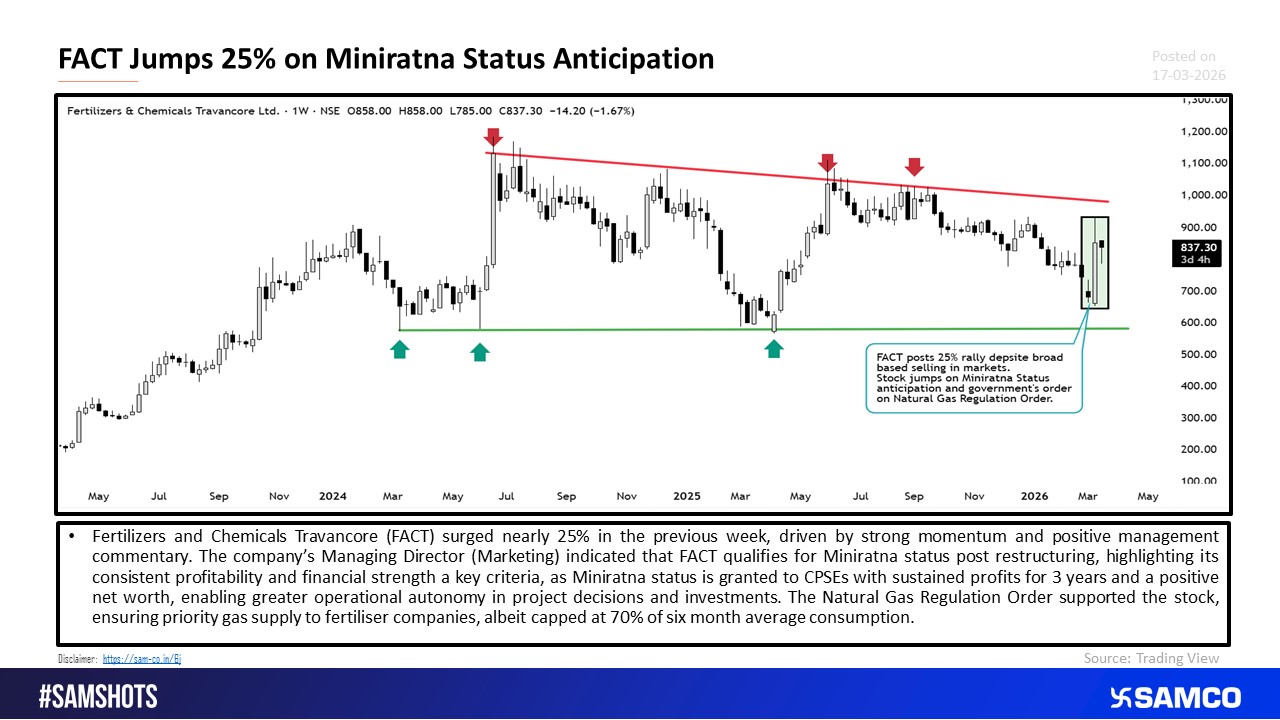
FACT Jumps on Miniratna Status Anticipation


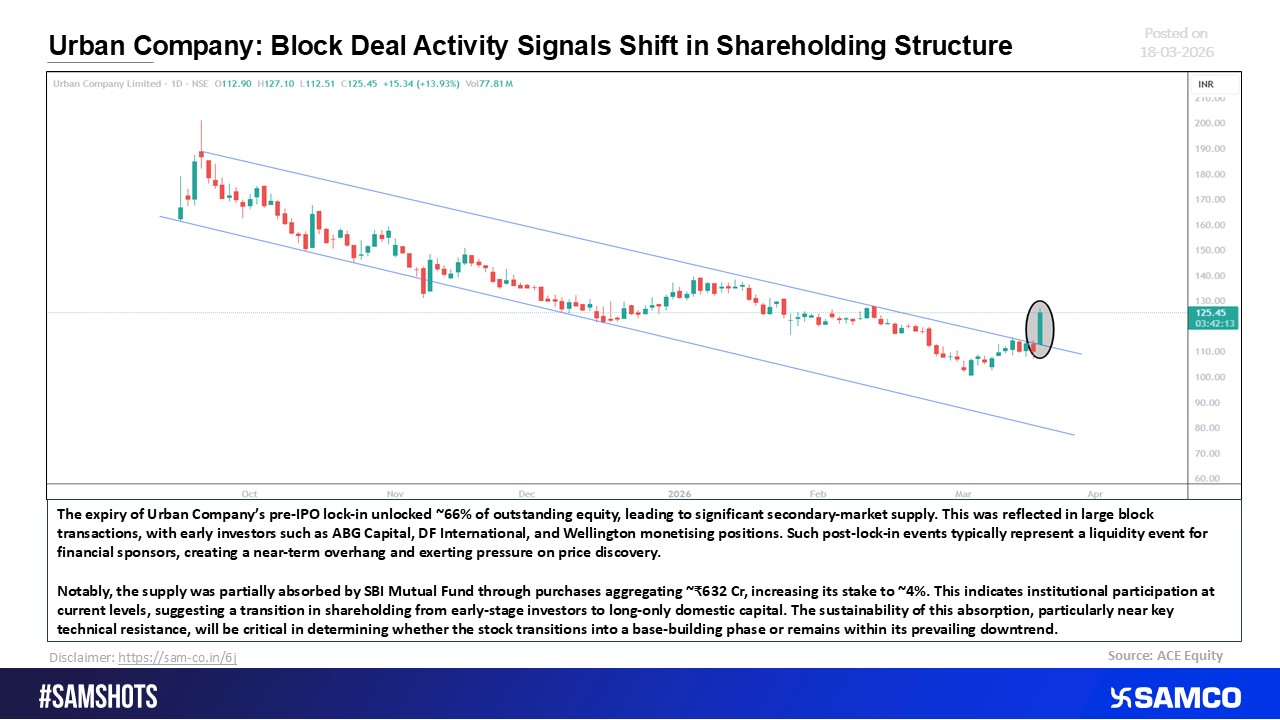
Urban Company: Block Transactions Indicate a Changing Ownership Structure
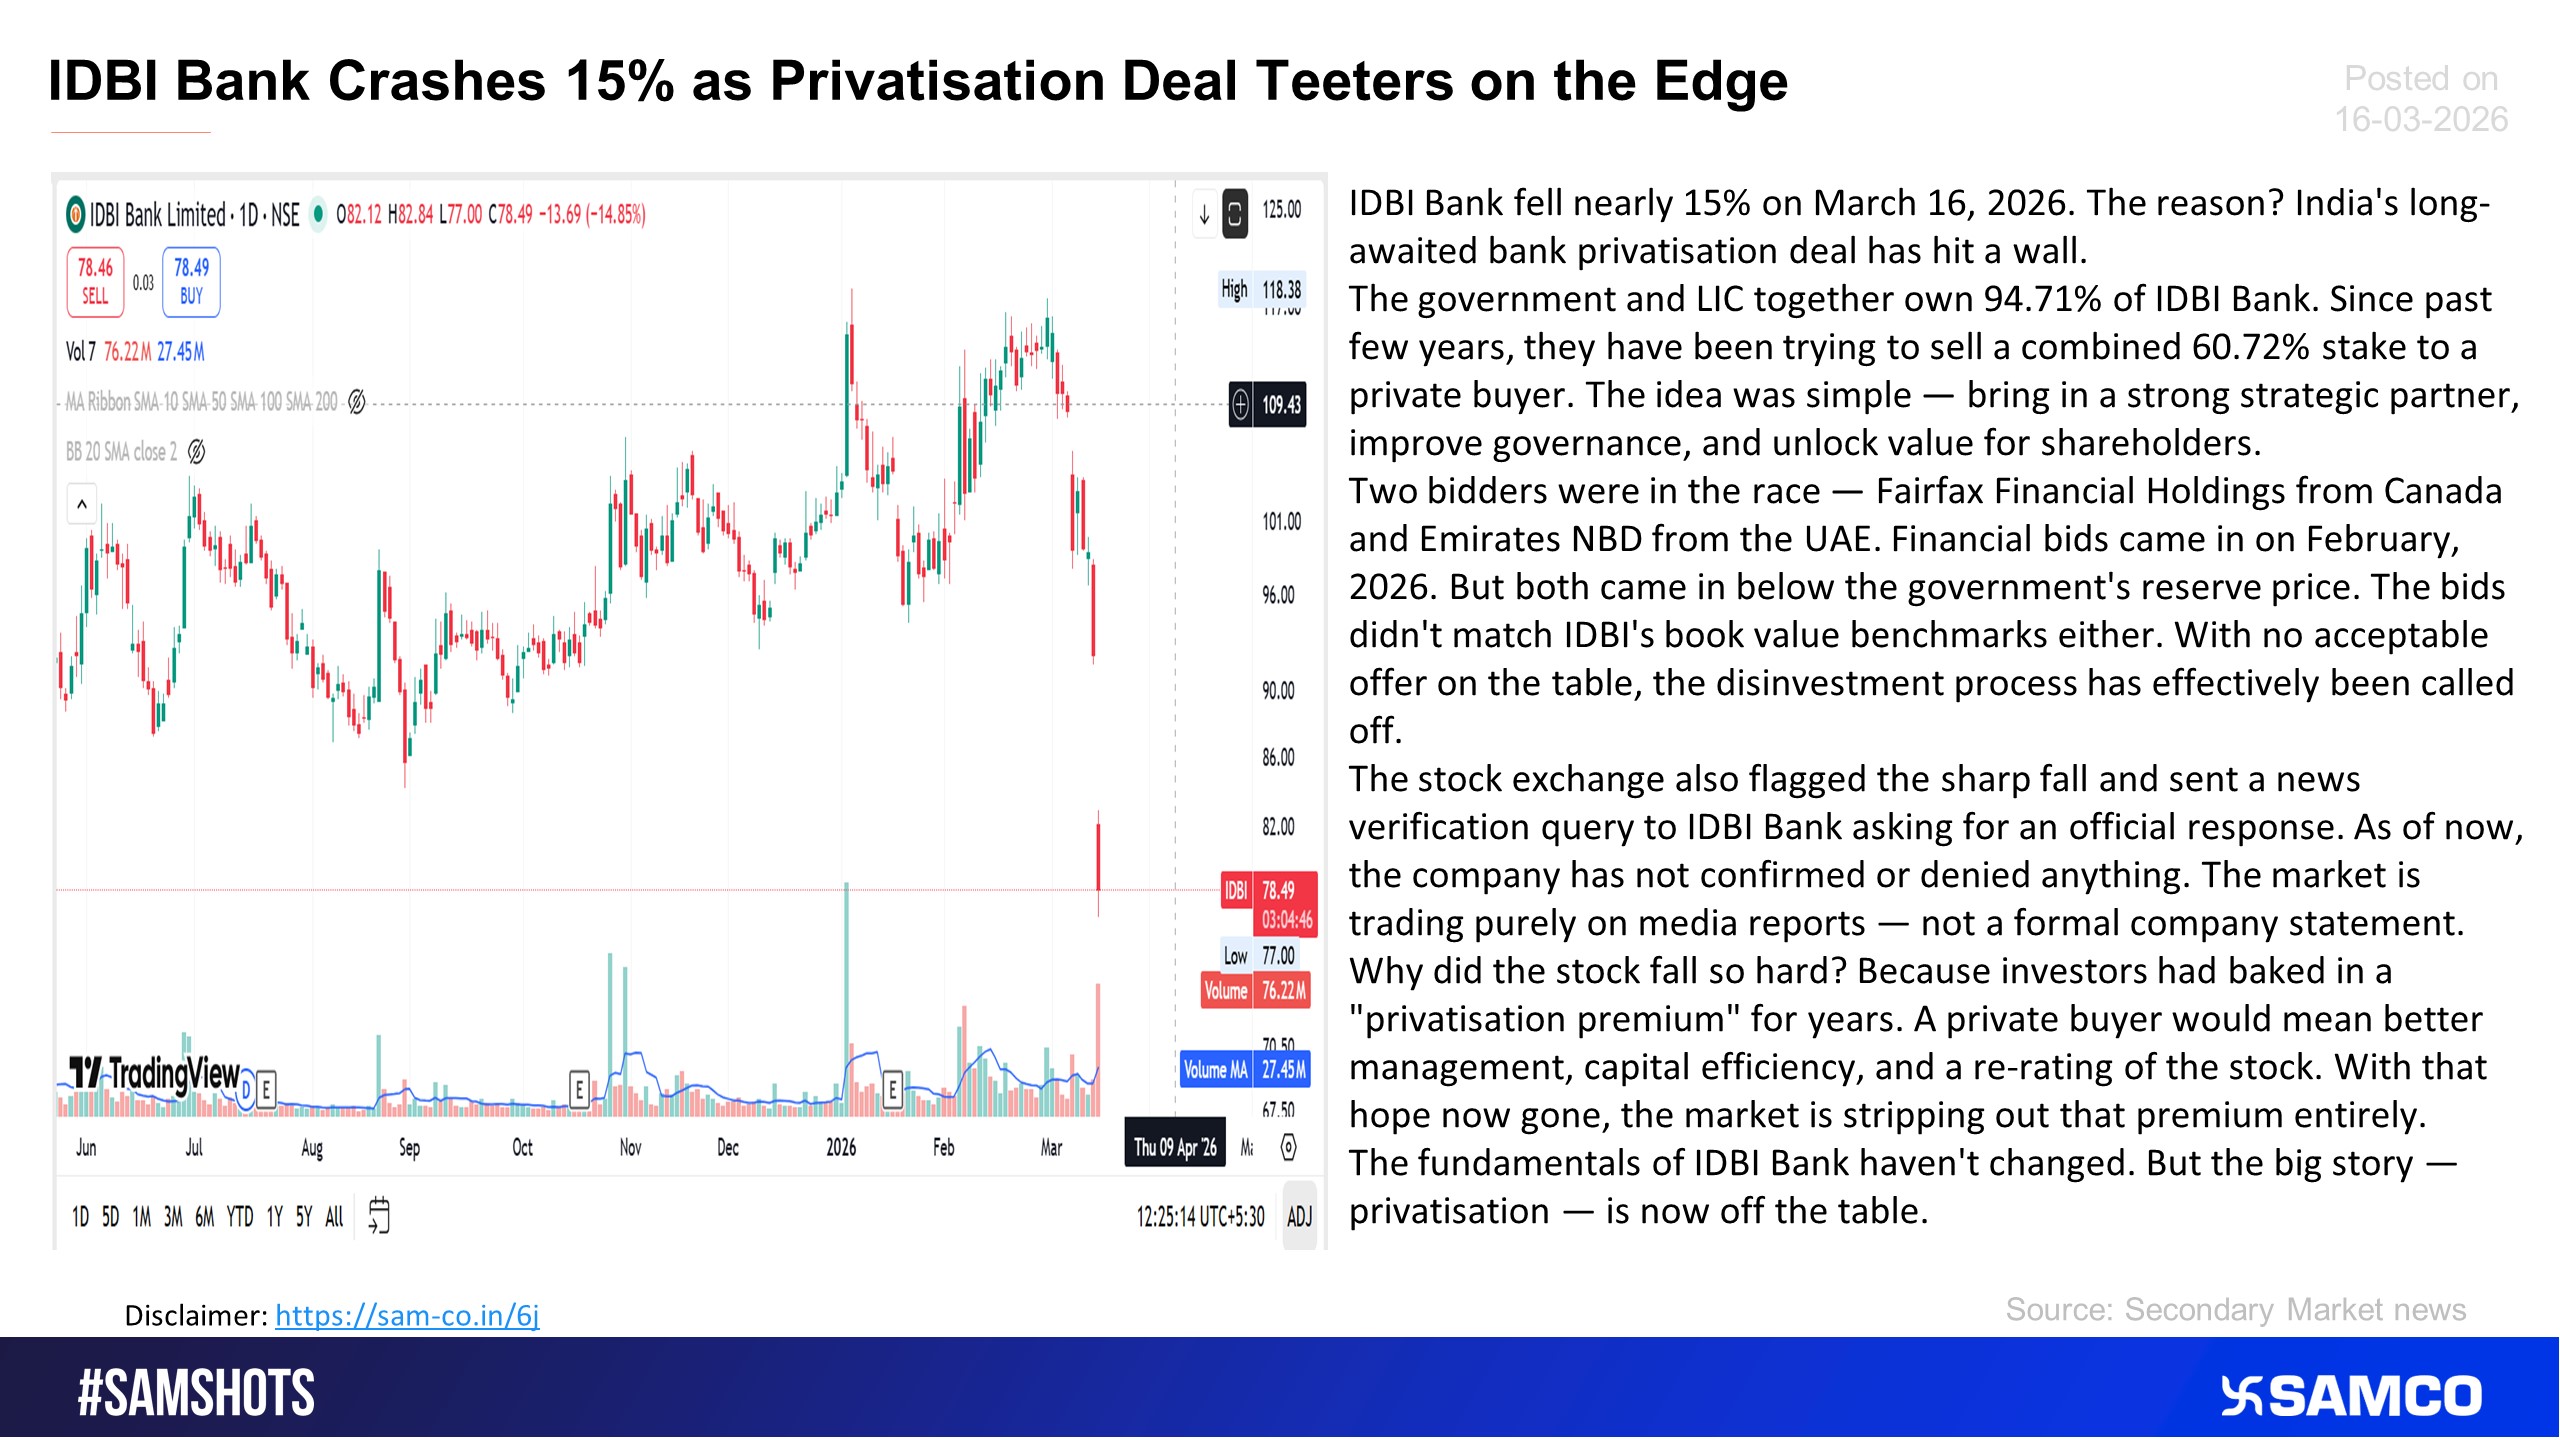
Here’s why IDBI bank fell 15% in a day.
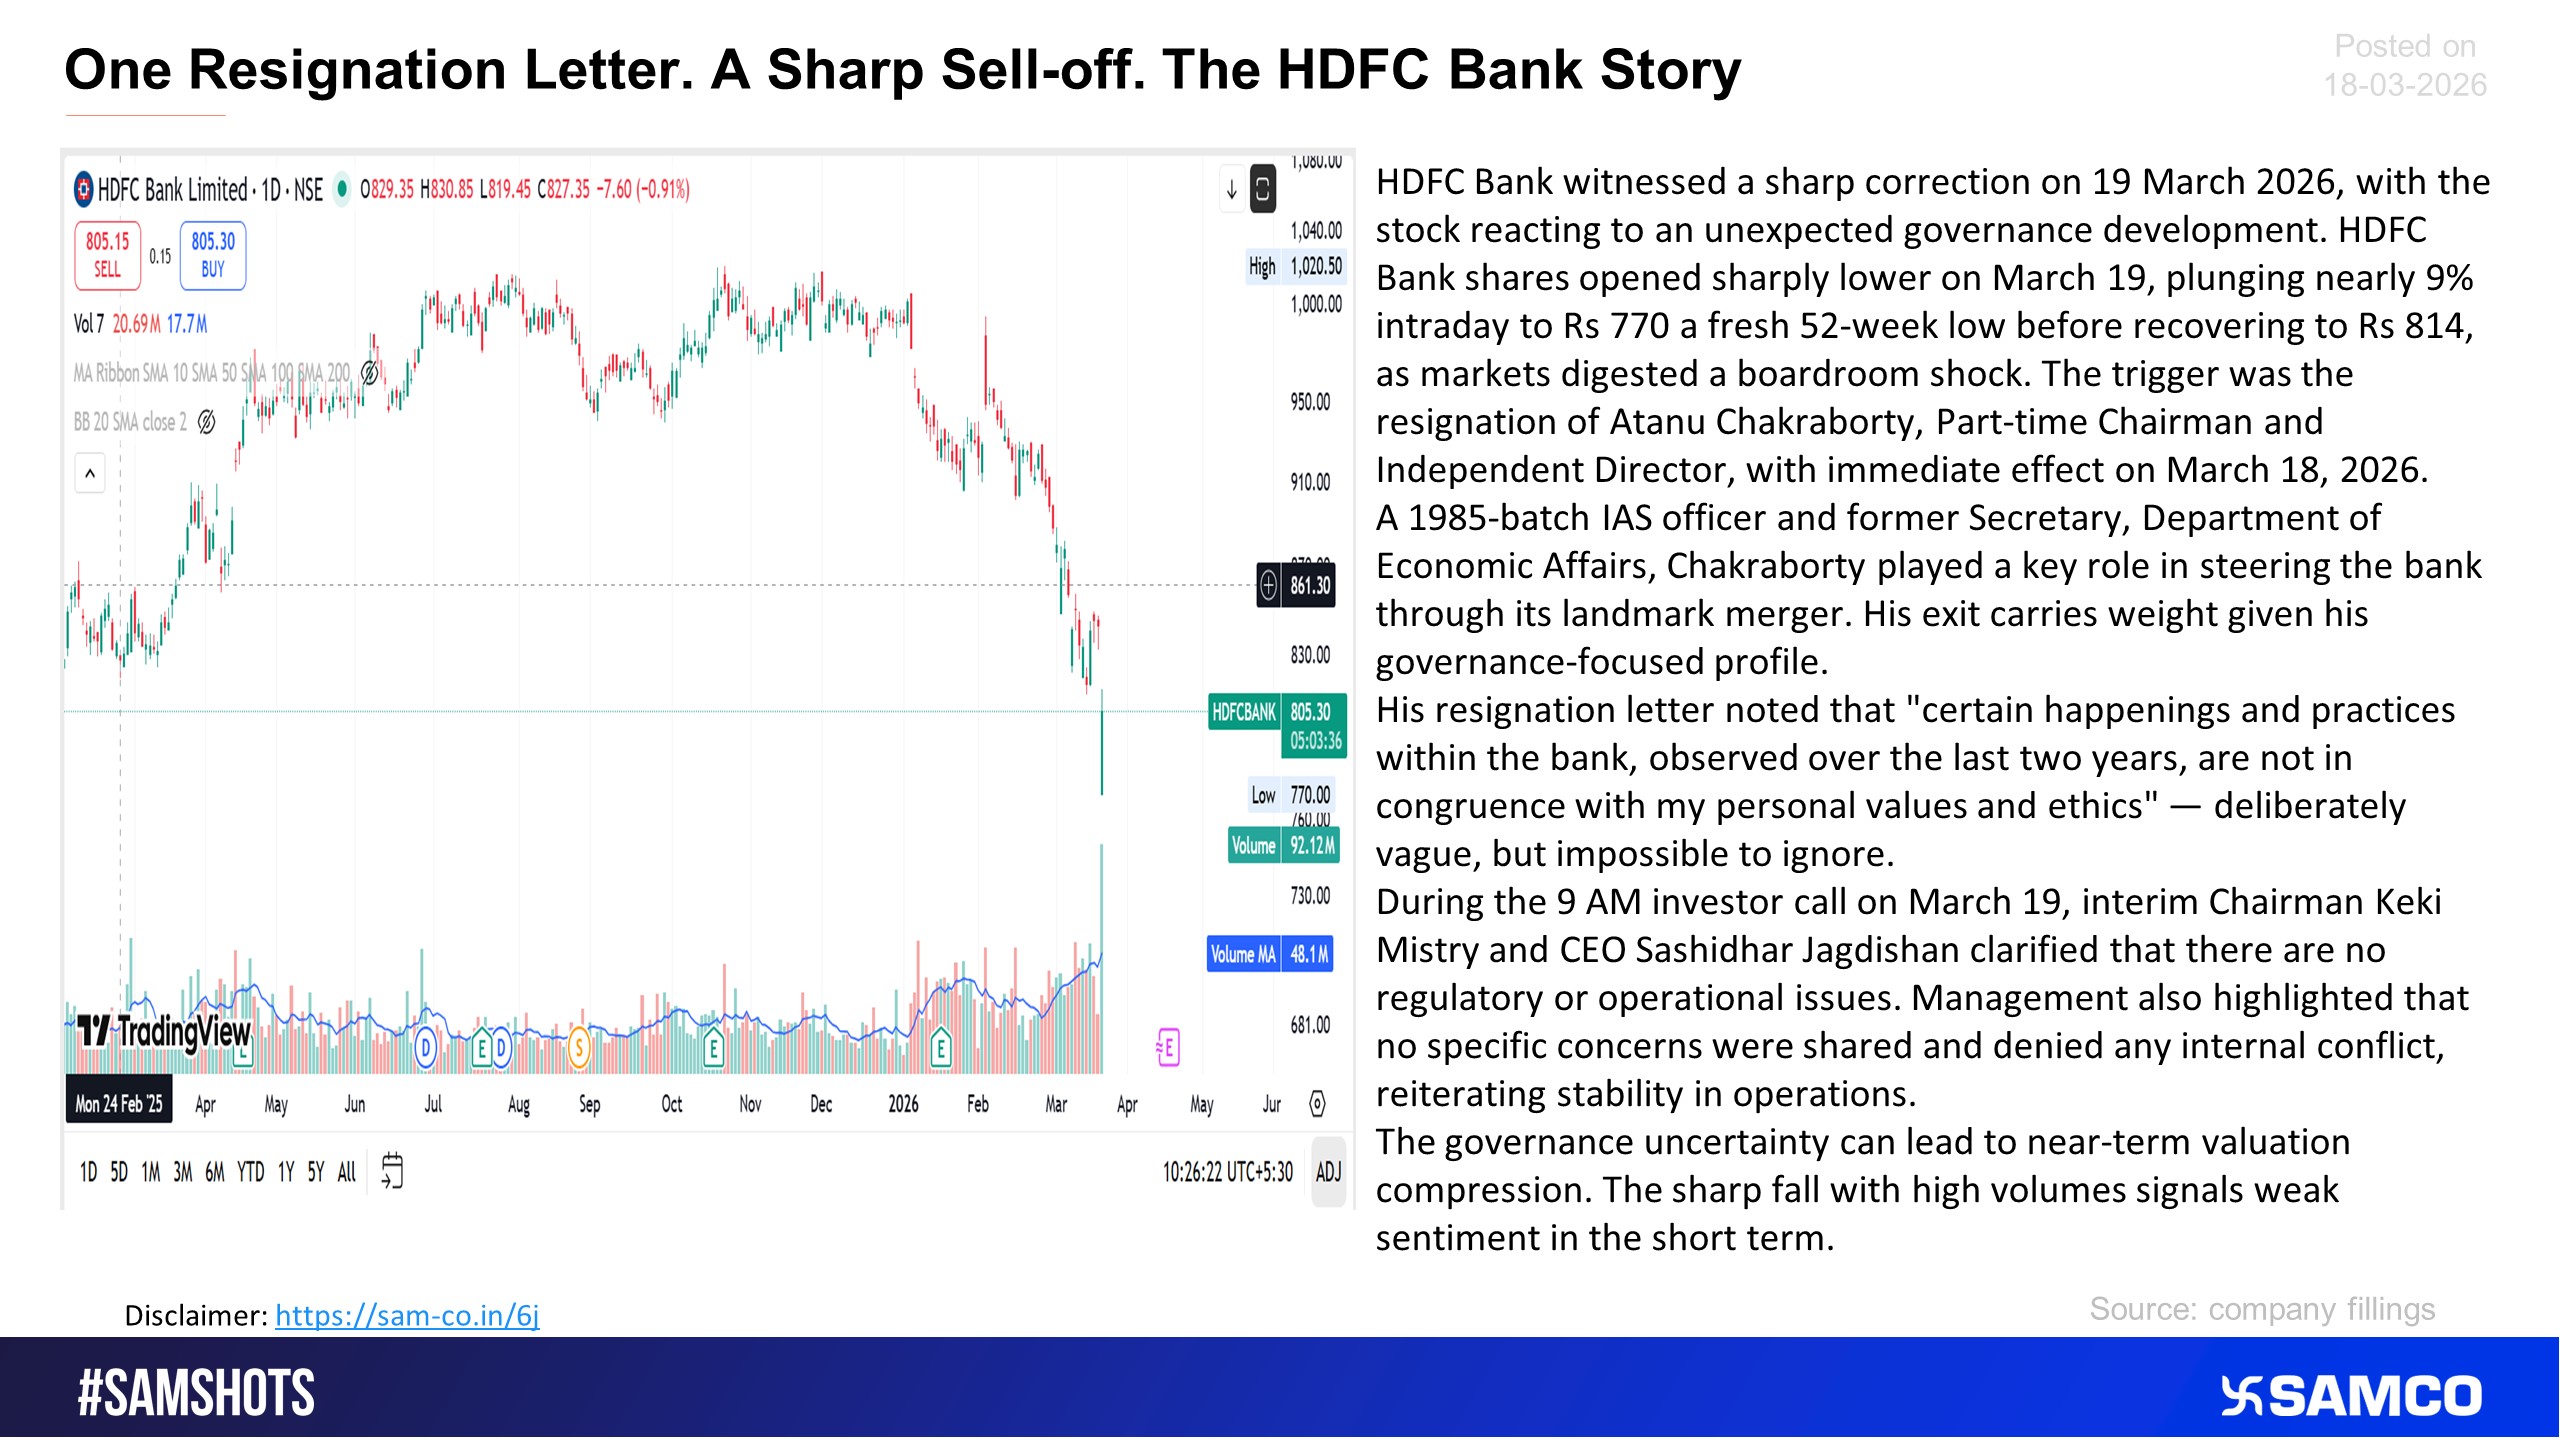
The shares of HDFC bank fell after the resignation by Part-time chairman.
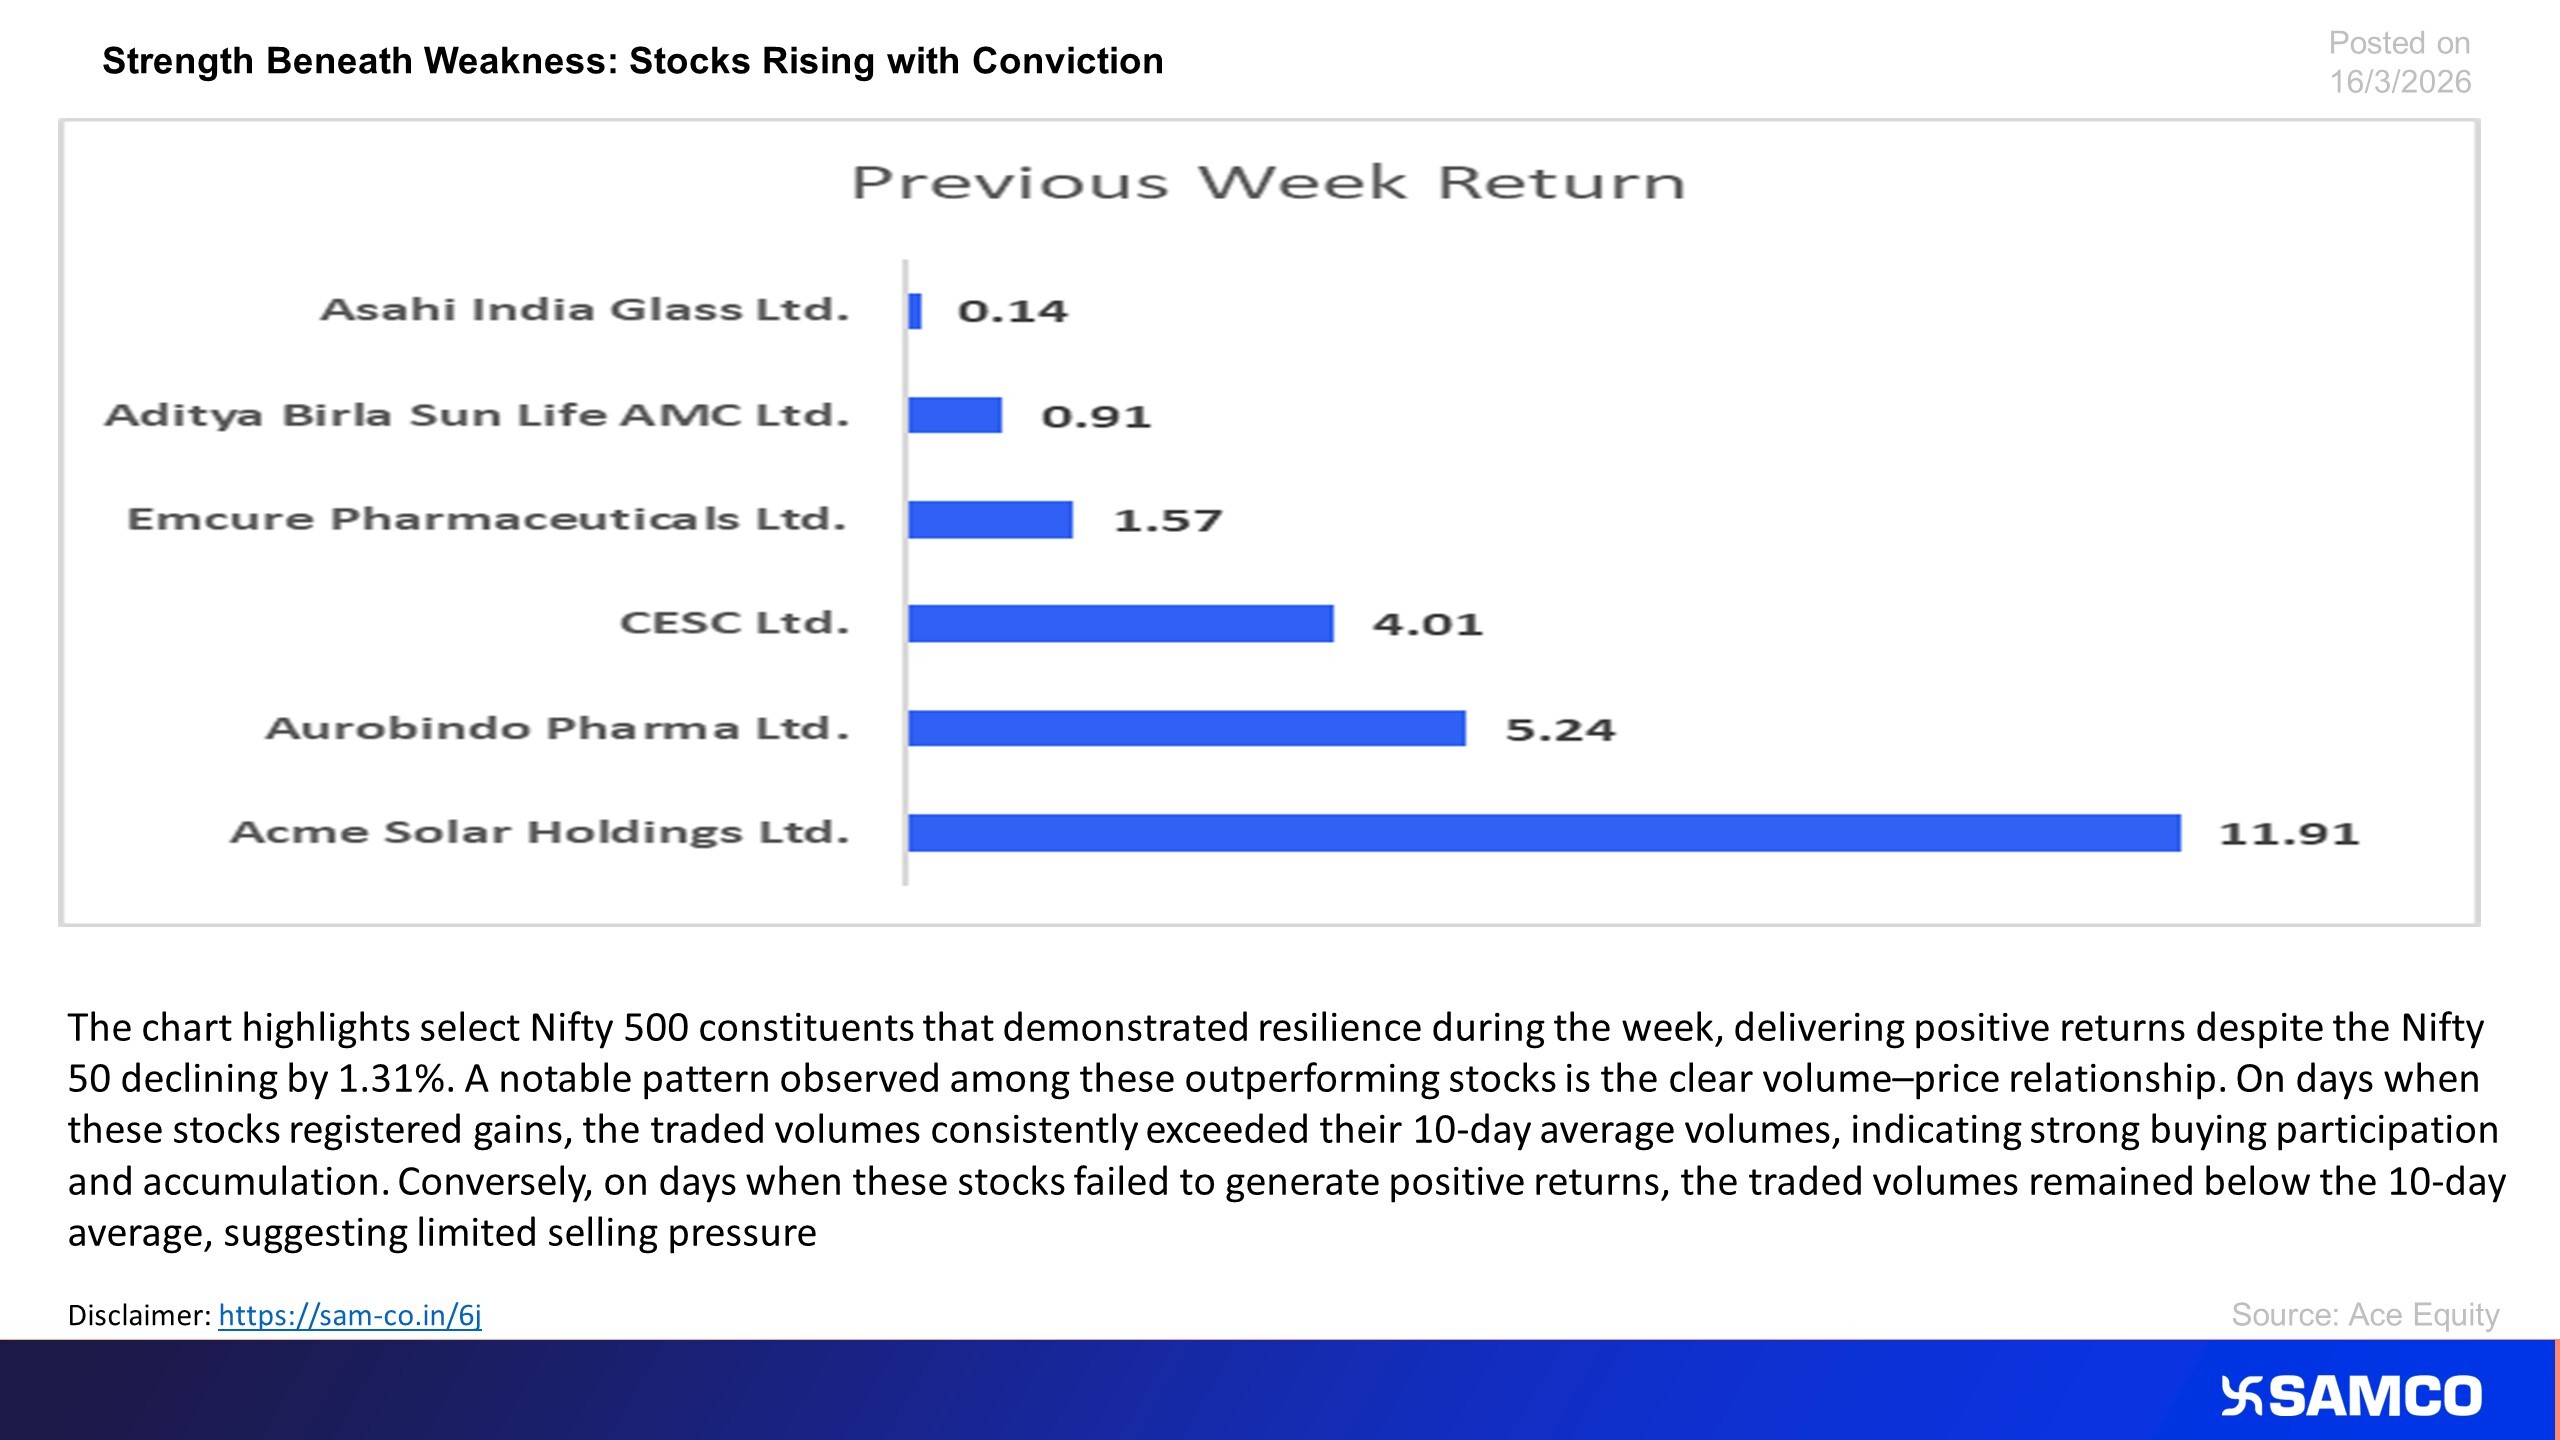
Stocks Gaining with increasing volumes during a tough week for Market
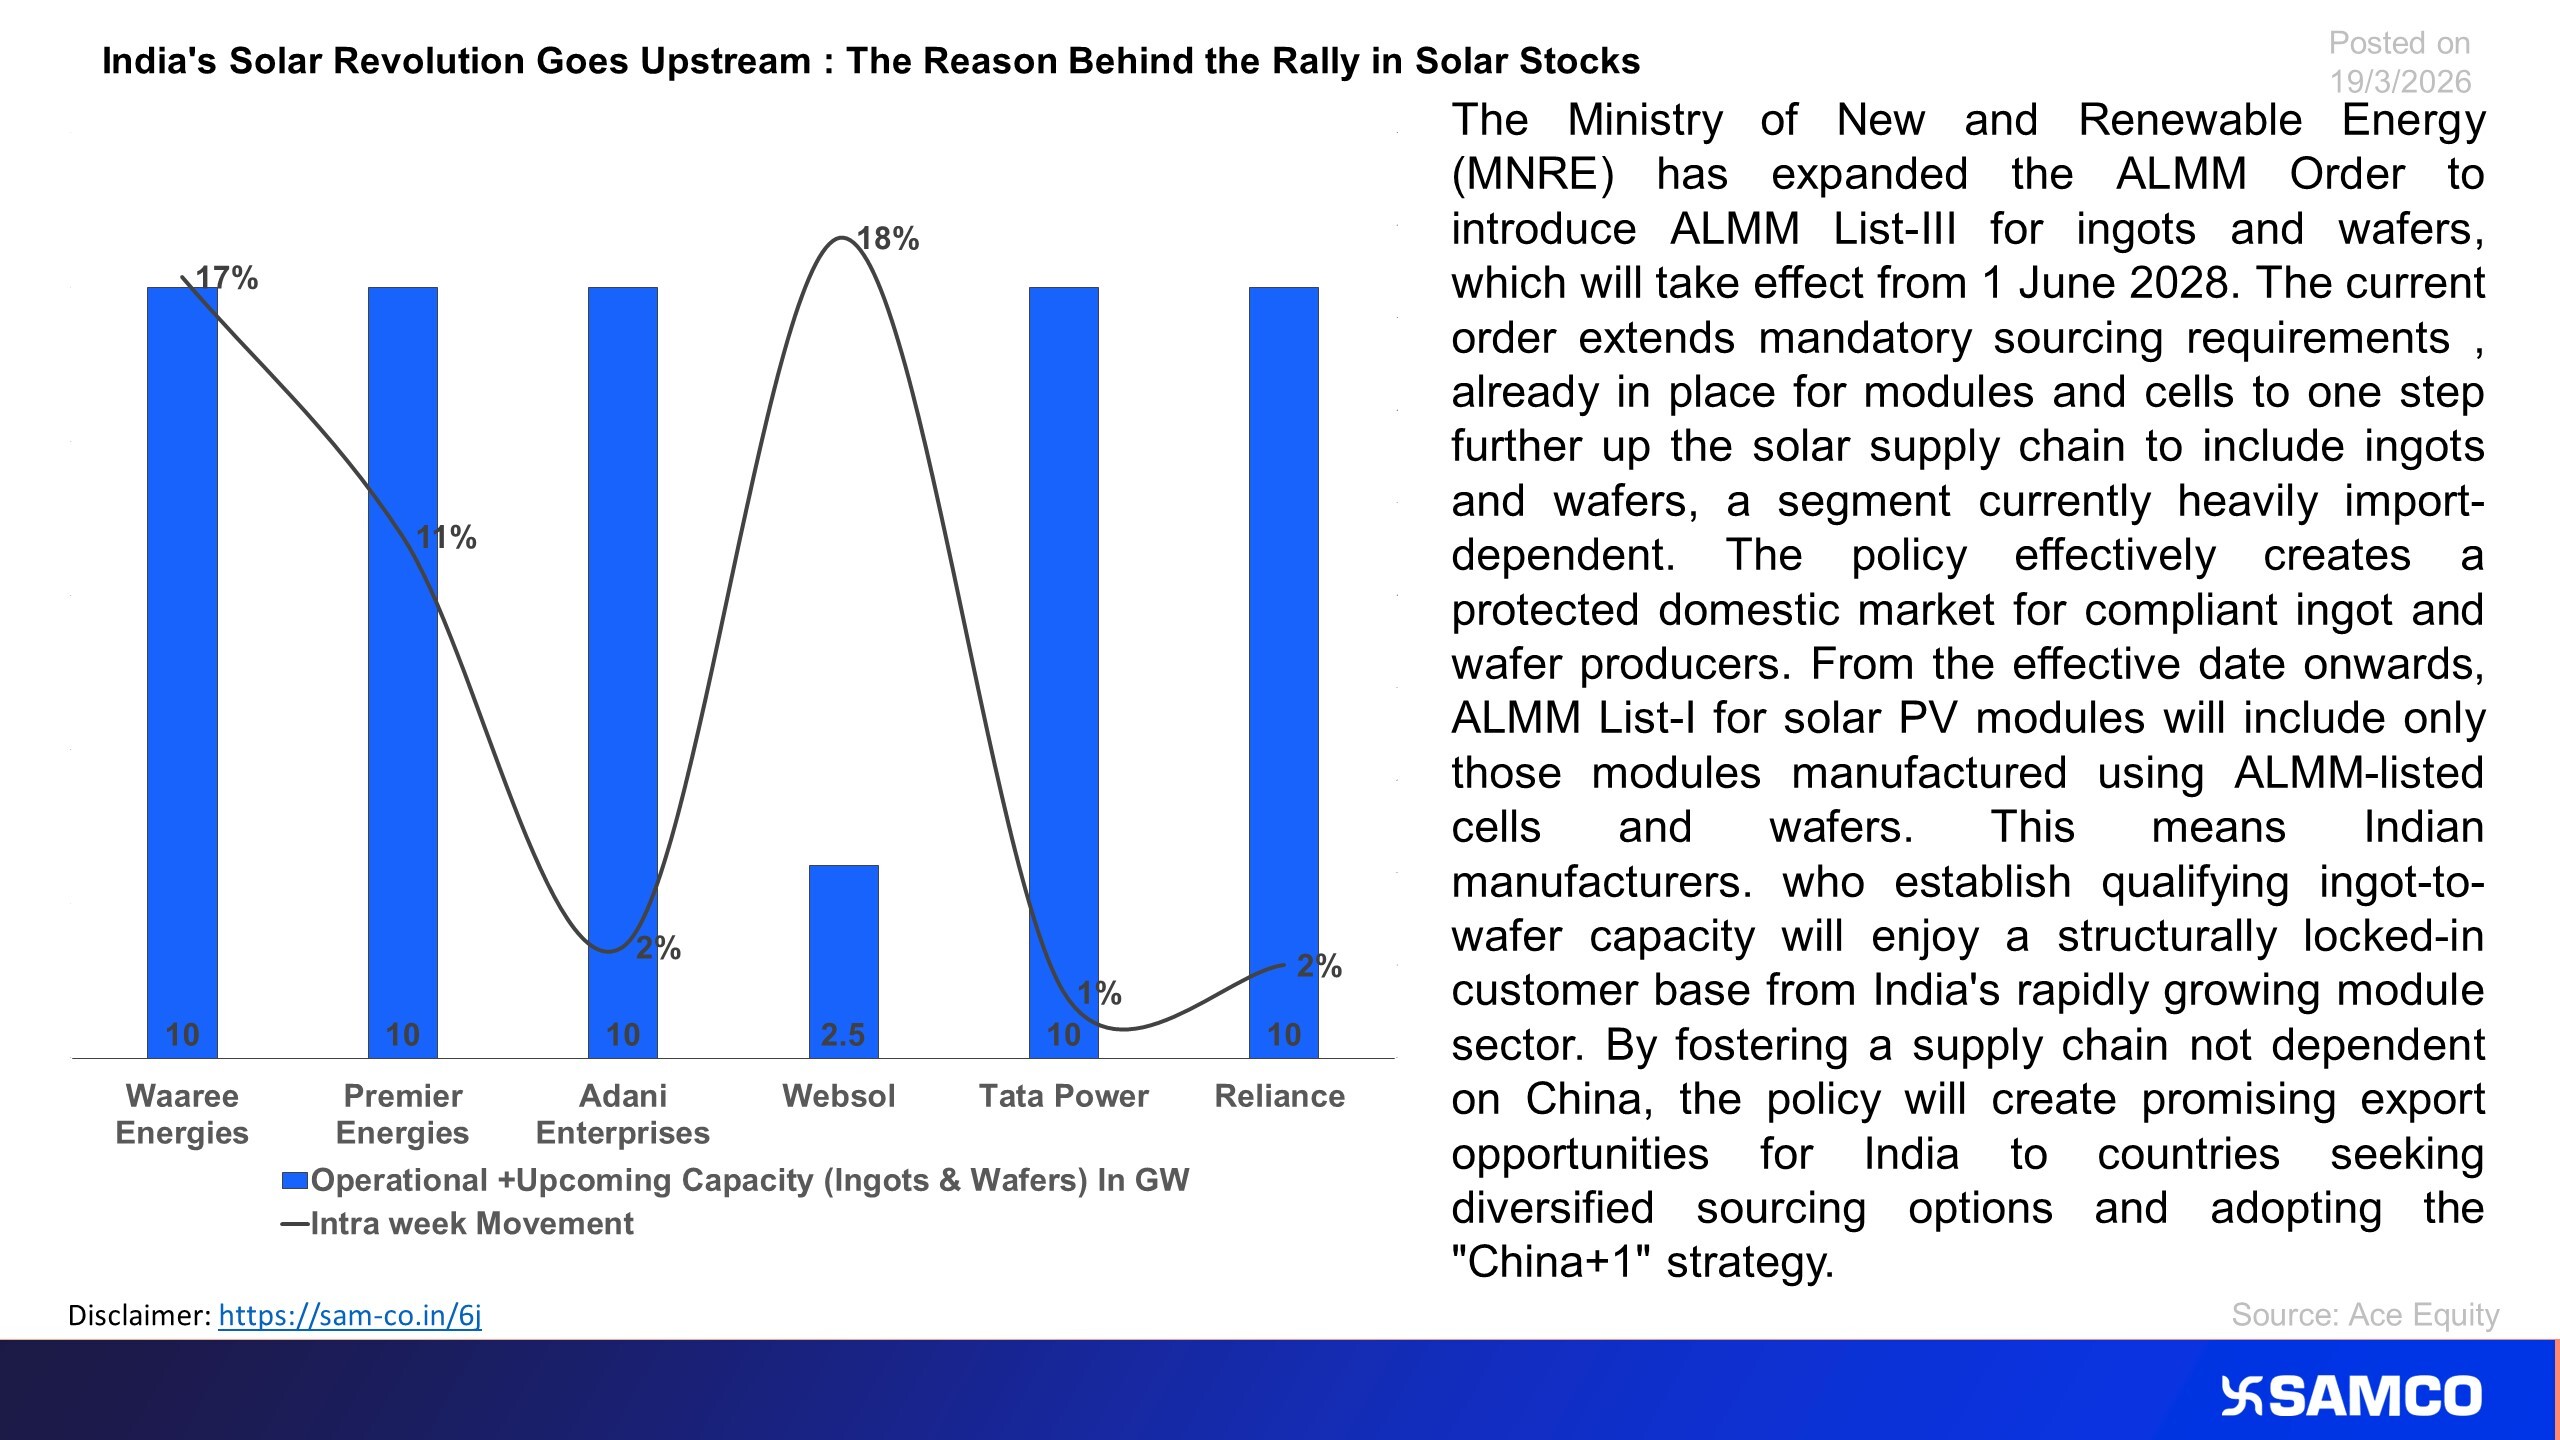
ALMM New Provision Brings New Shine in Solar Stocks
Auto Drives Gains as Broader Market Shows Weak Breadth
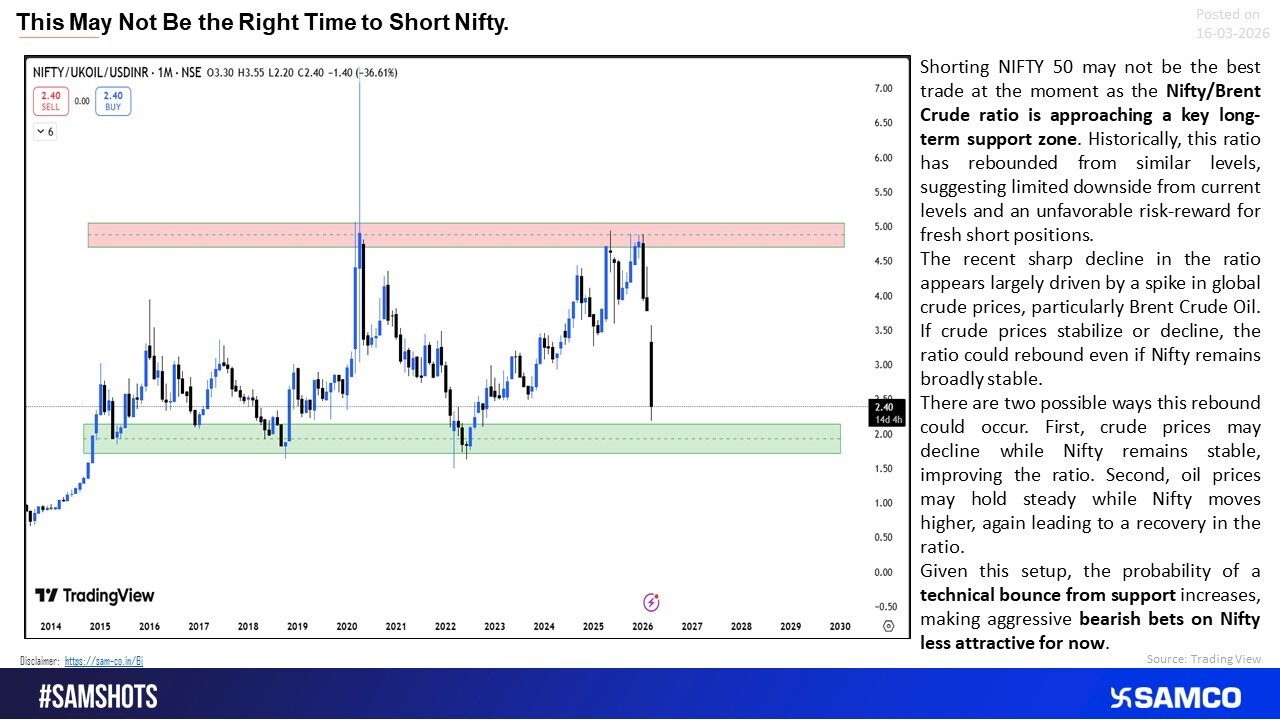
Nifty Shorts? Support Says Not Yet.
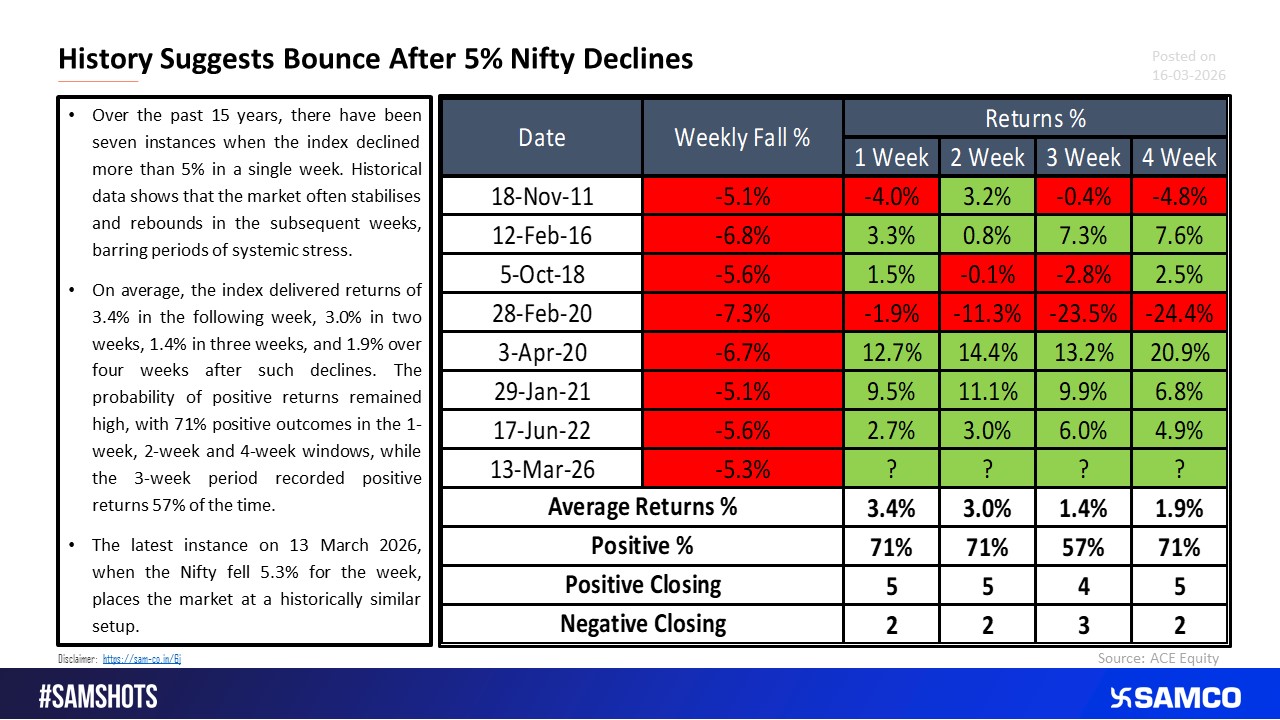
After 5% Weekly Falls, Nifty Tends to Rebound: Analysis of 15-Year Data
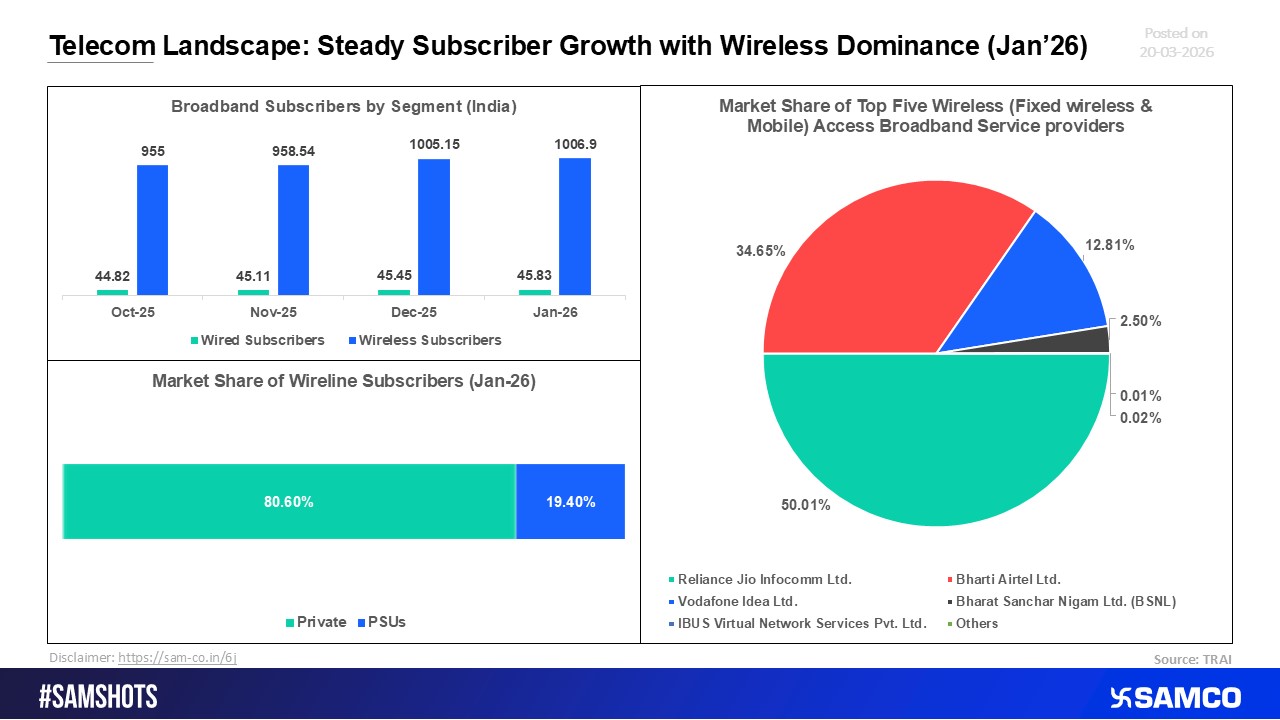
Telecom Sector Update: Consistent Subscriber Expansion Led by Wireless
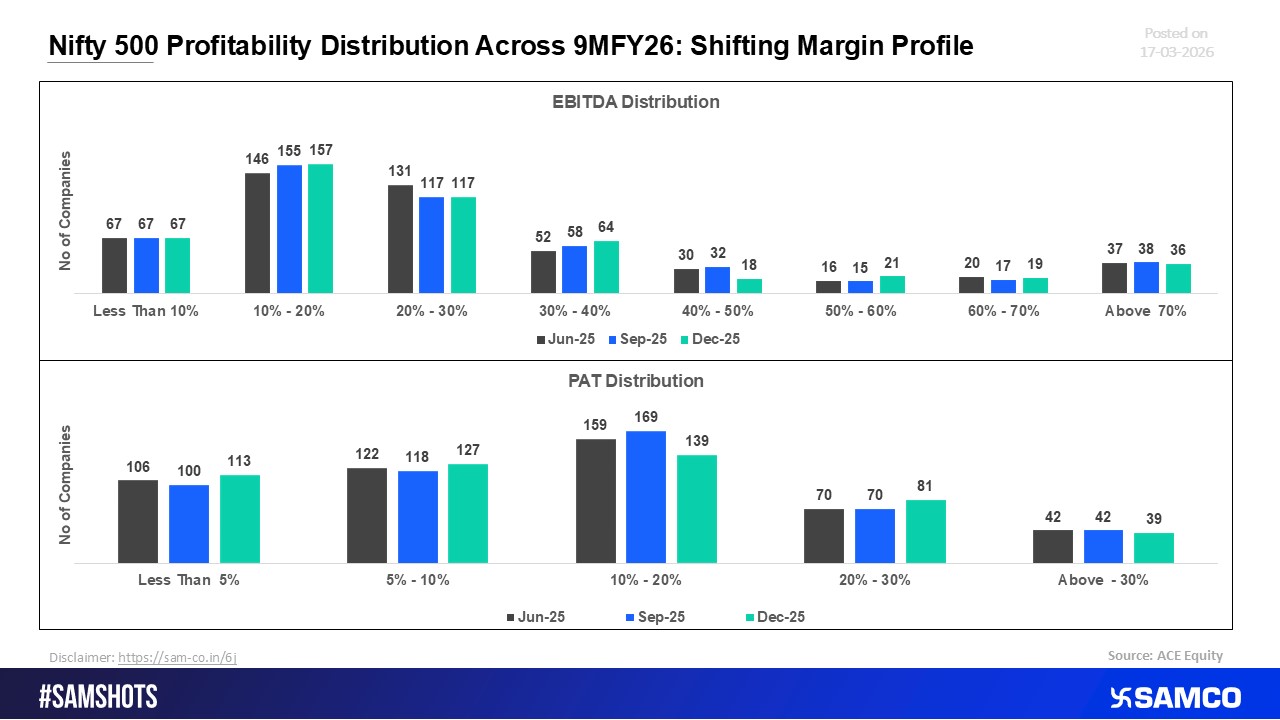
Nifty 500 Profitability Mix in 9MFY26: Evolving Margin Dynamics
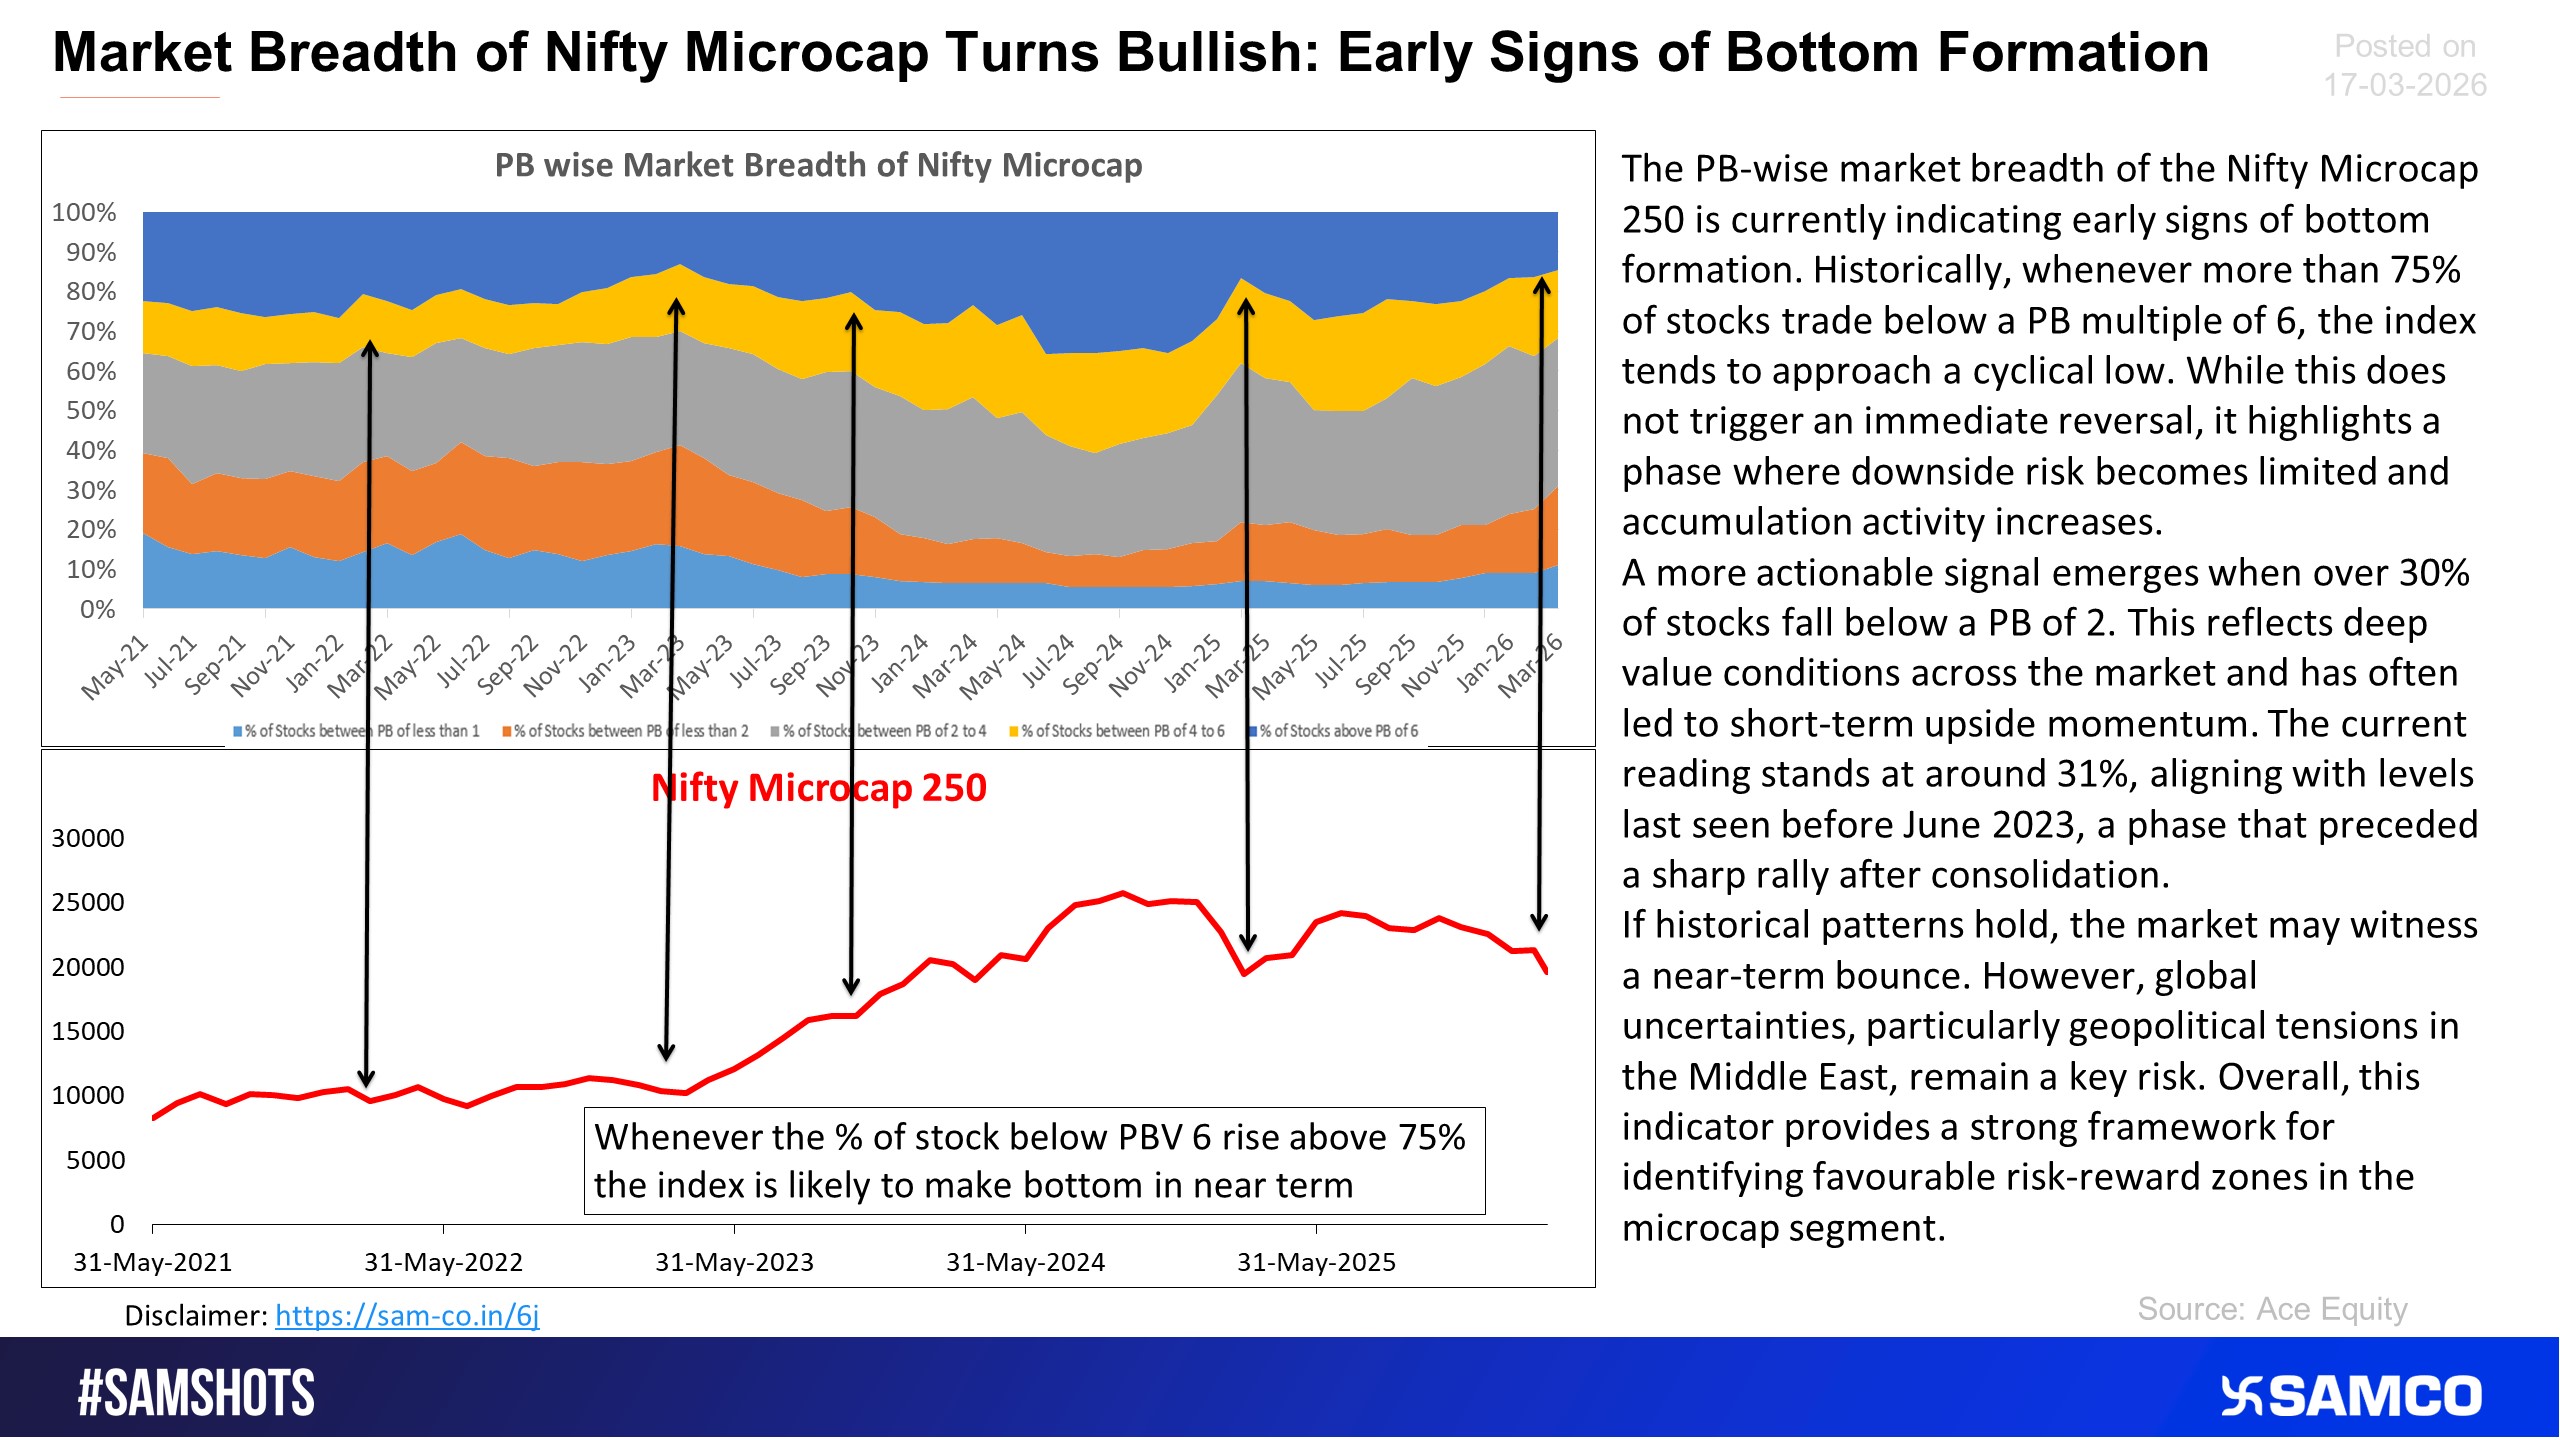
The below chart shows the PB wise sectoral market breadth of Nifty Microcap.
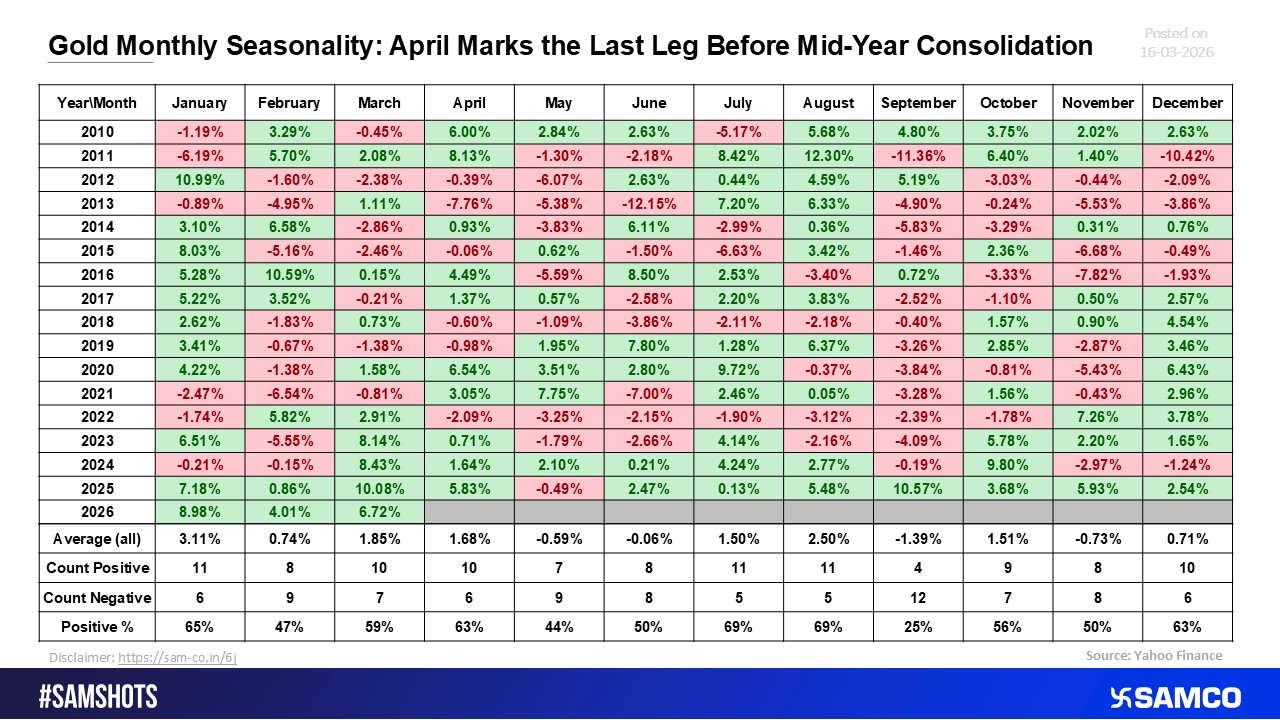
Gold’s Monthly Seasonality: April Signals the Final Upswing Ahead of Mid-Year Consolidation
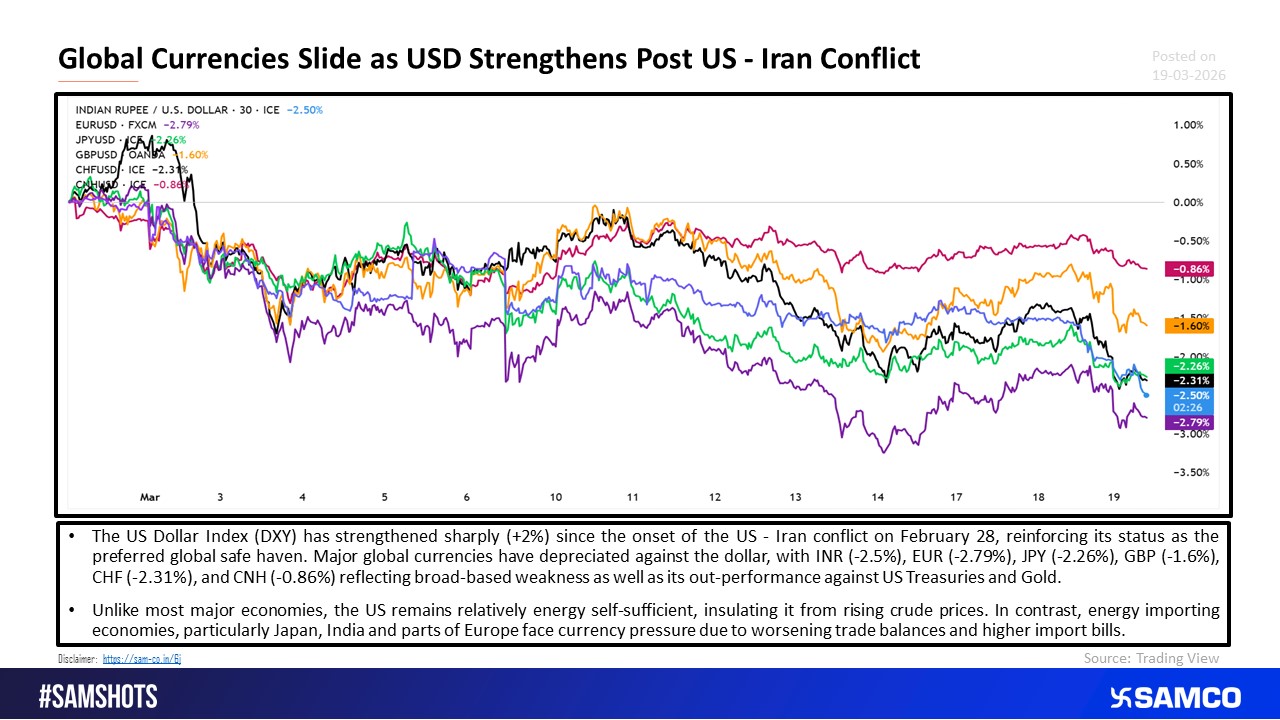
Global Currencies Slide as USD Strengthens Post Conflict
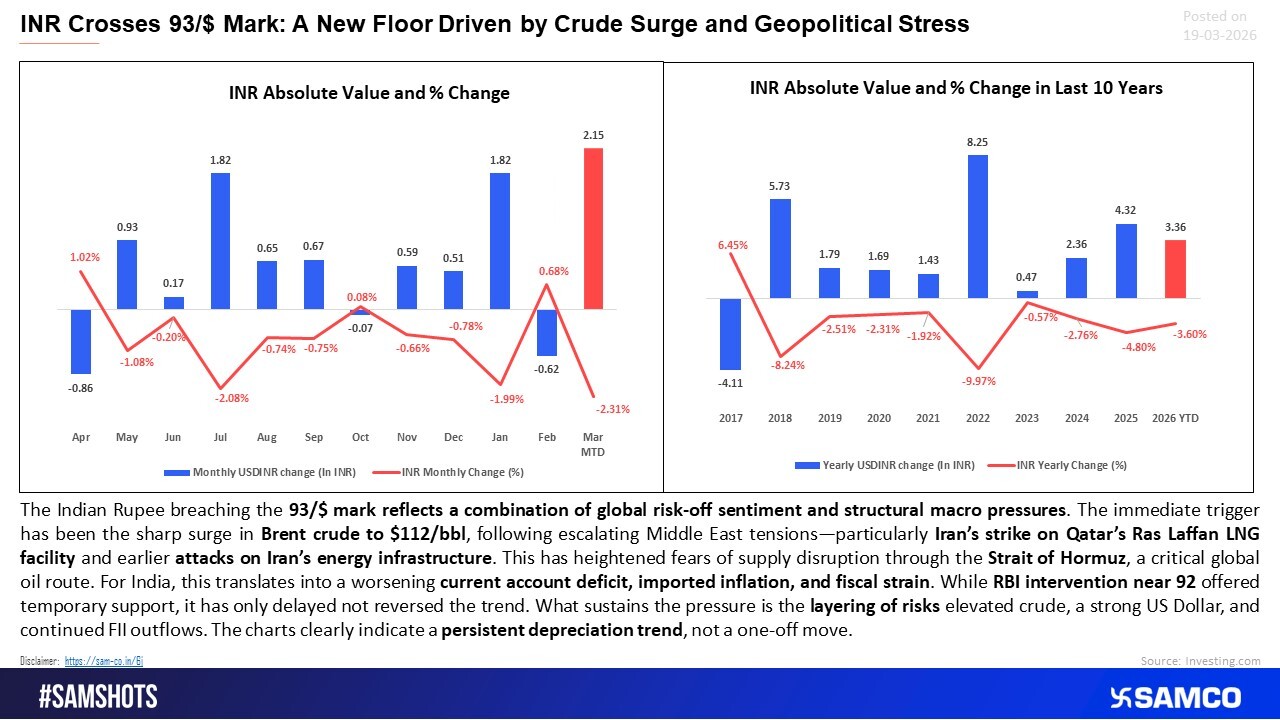
Rupee at 93/$: Crude Shock and Geopolitics Redefine Currency Floor
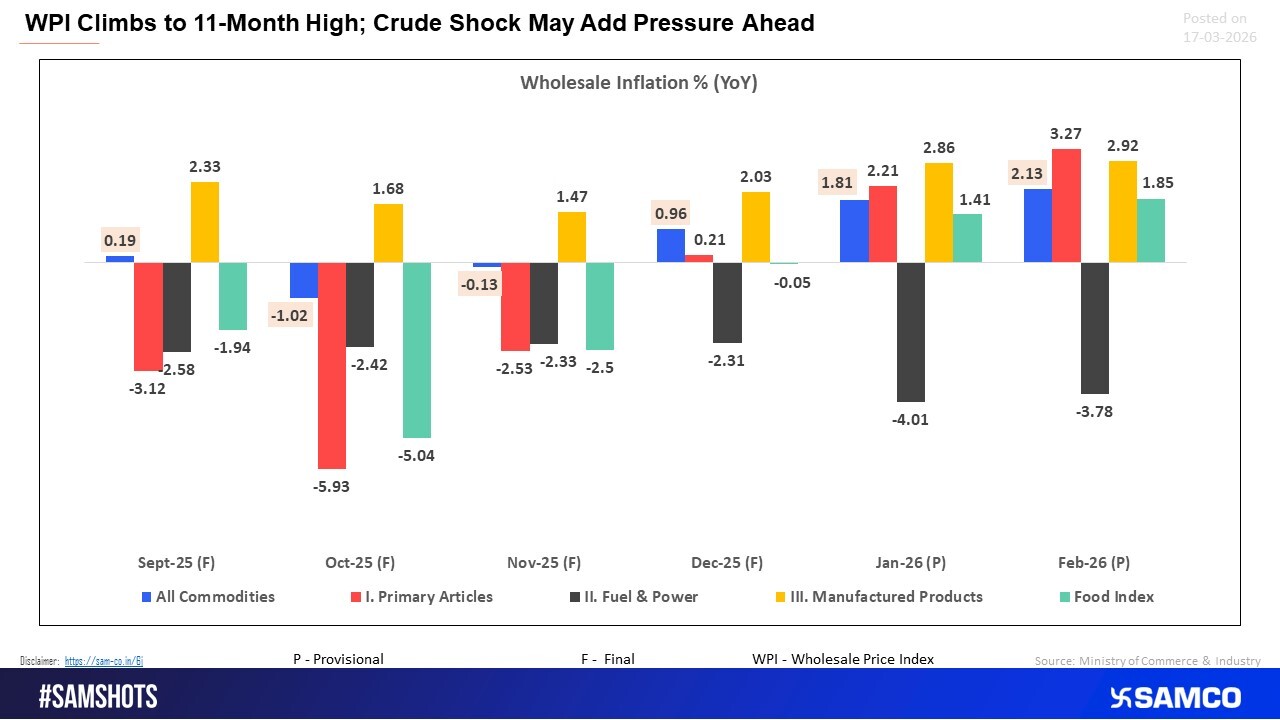
Inflation Heats Up: WPI Peaks as Crude Risk Builds
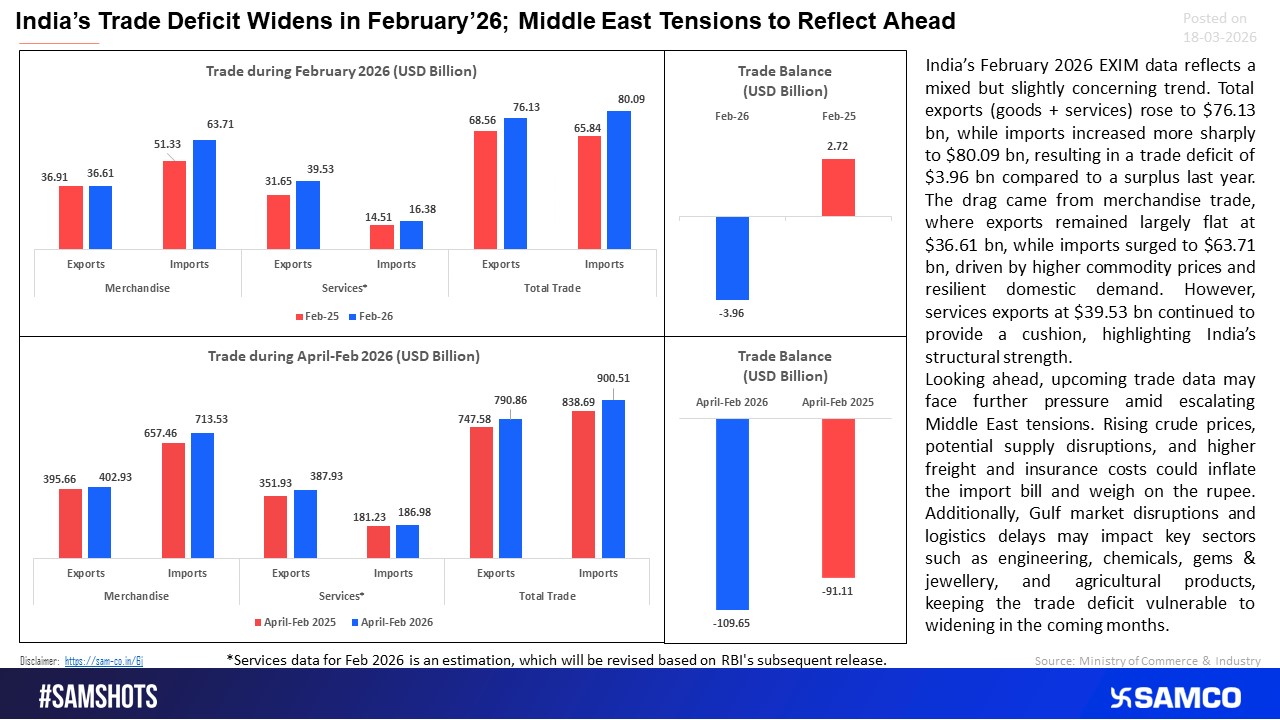
Trade Deficit Widens: Crude and Conflict Add to External Pressure
The below chart shows the sectors with highest & lowest investment flow between 1st March to 15th March
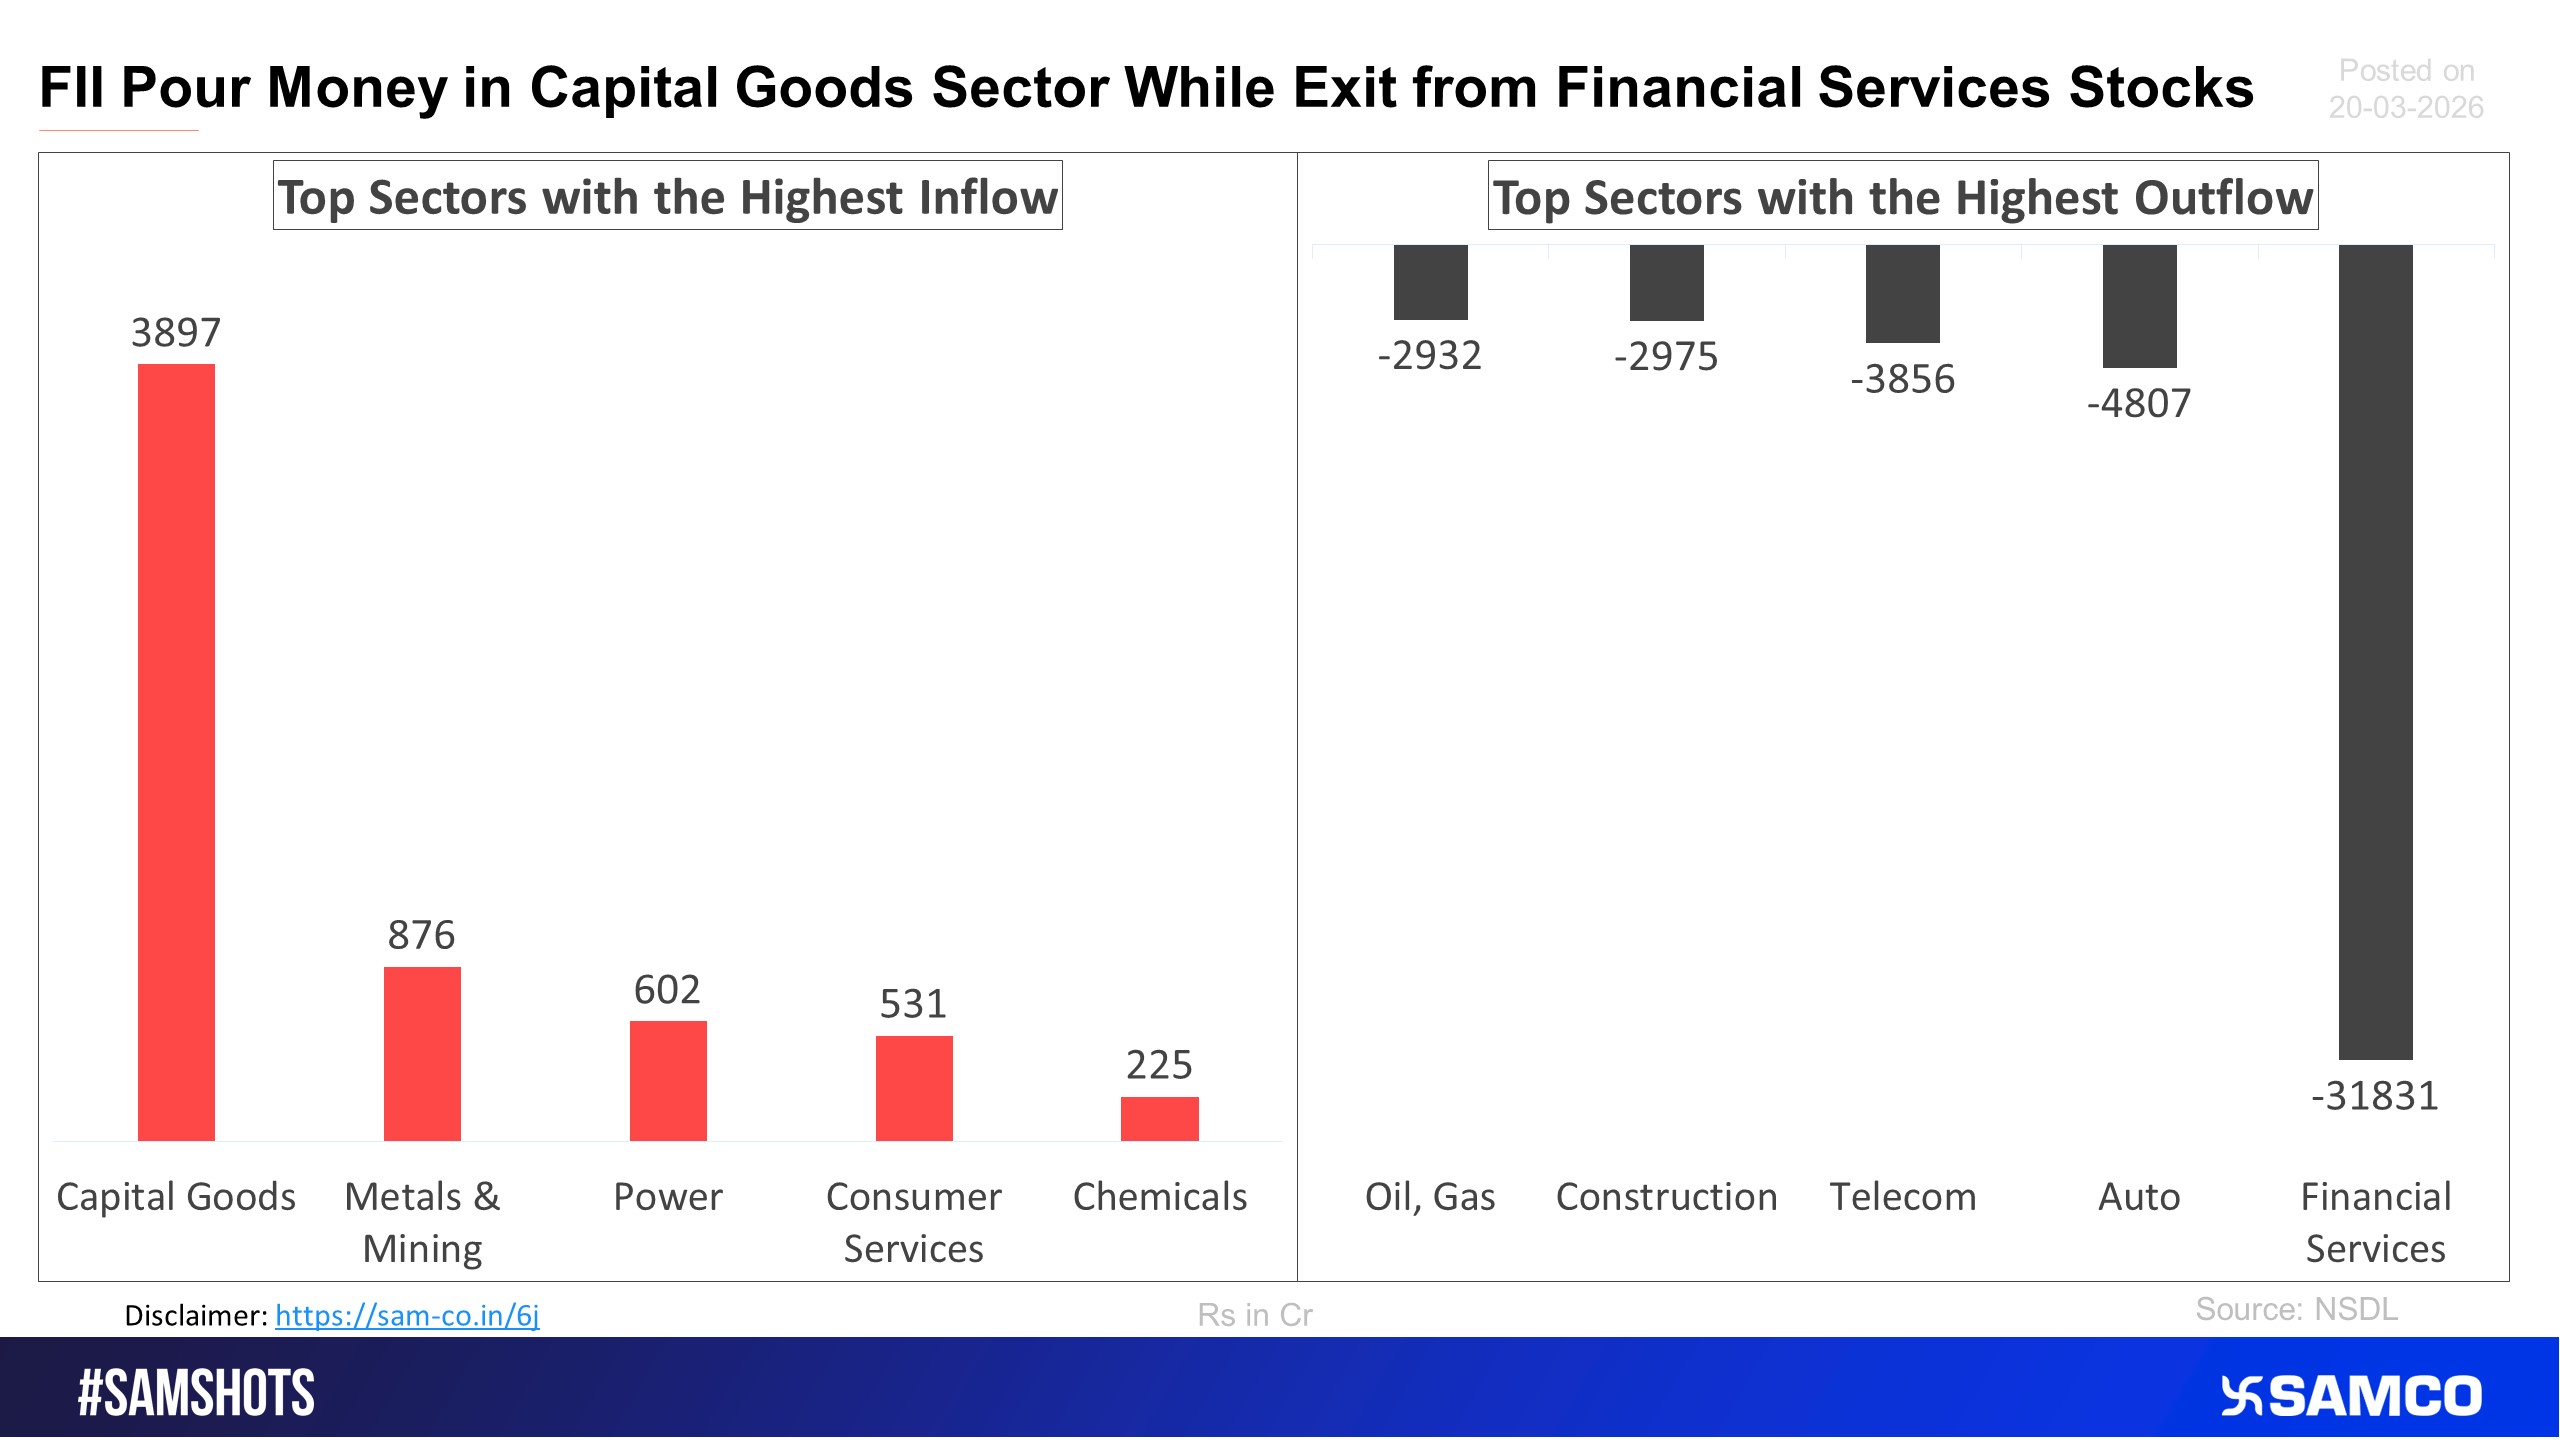
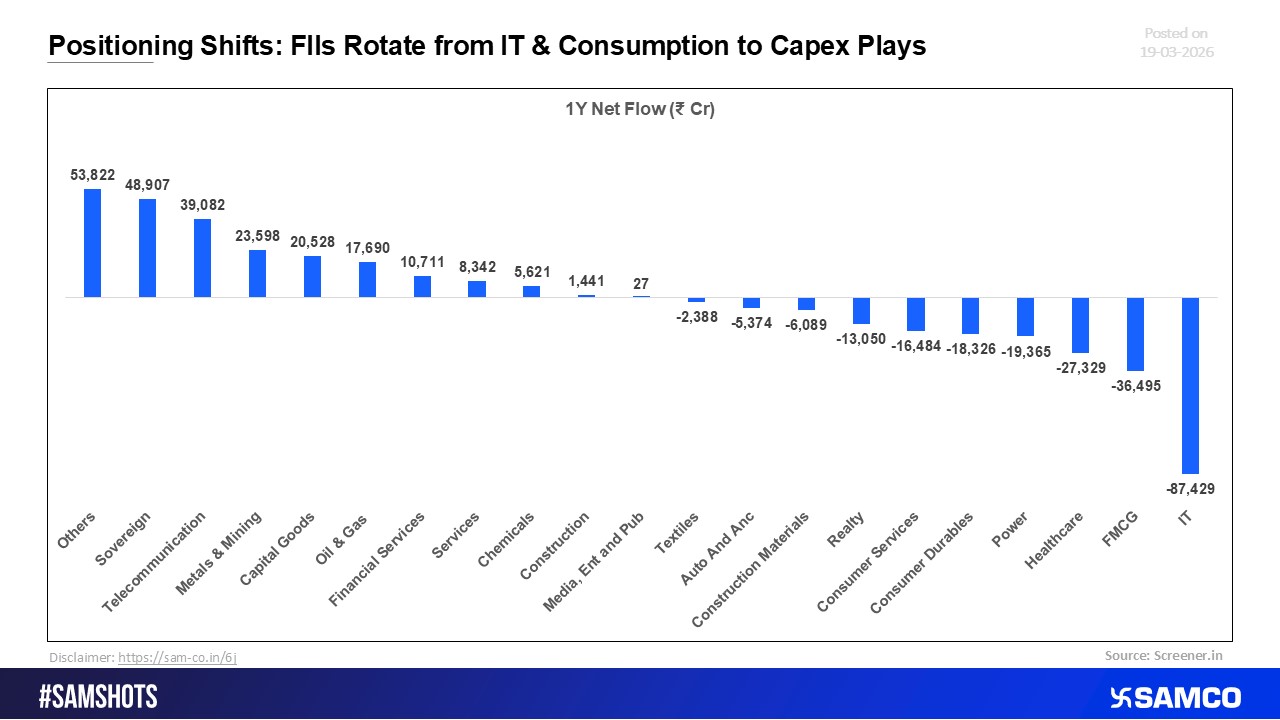
Capital Reallocation: FIIs Pivot Towards Capex-Driven Themes
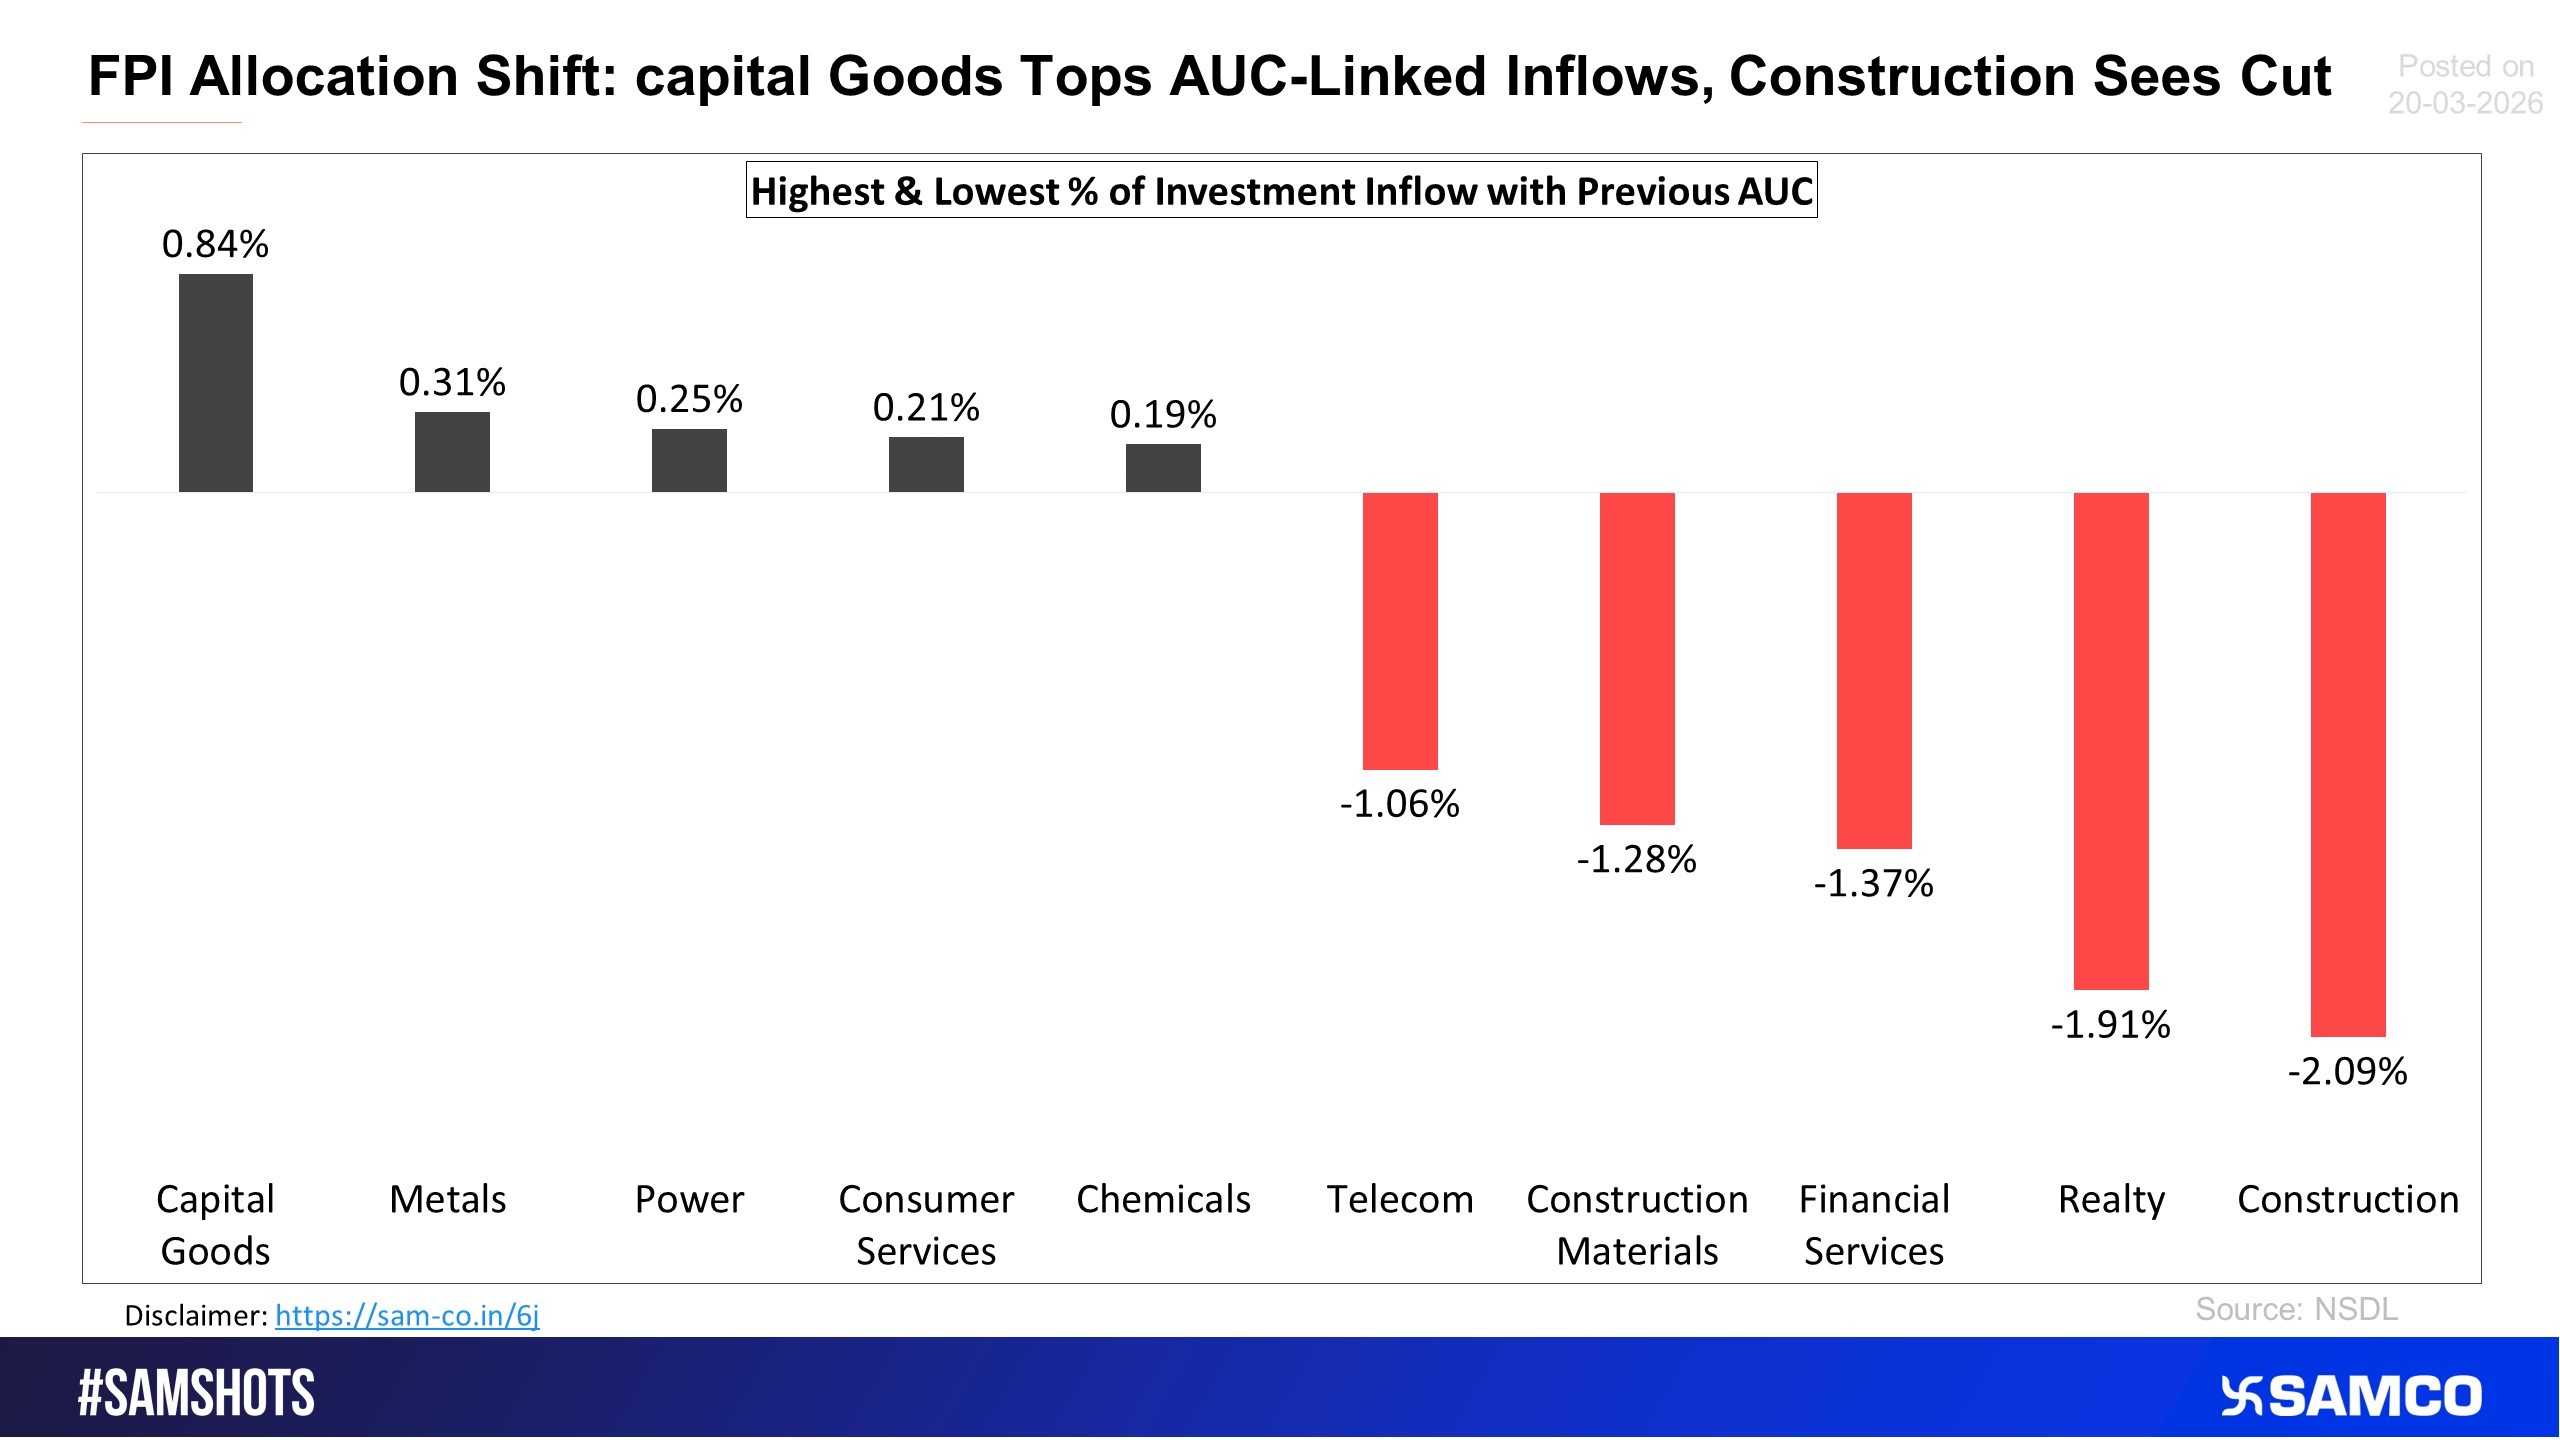
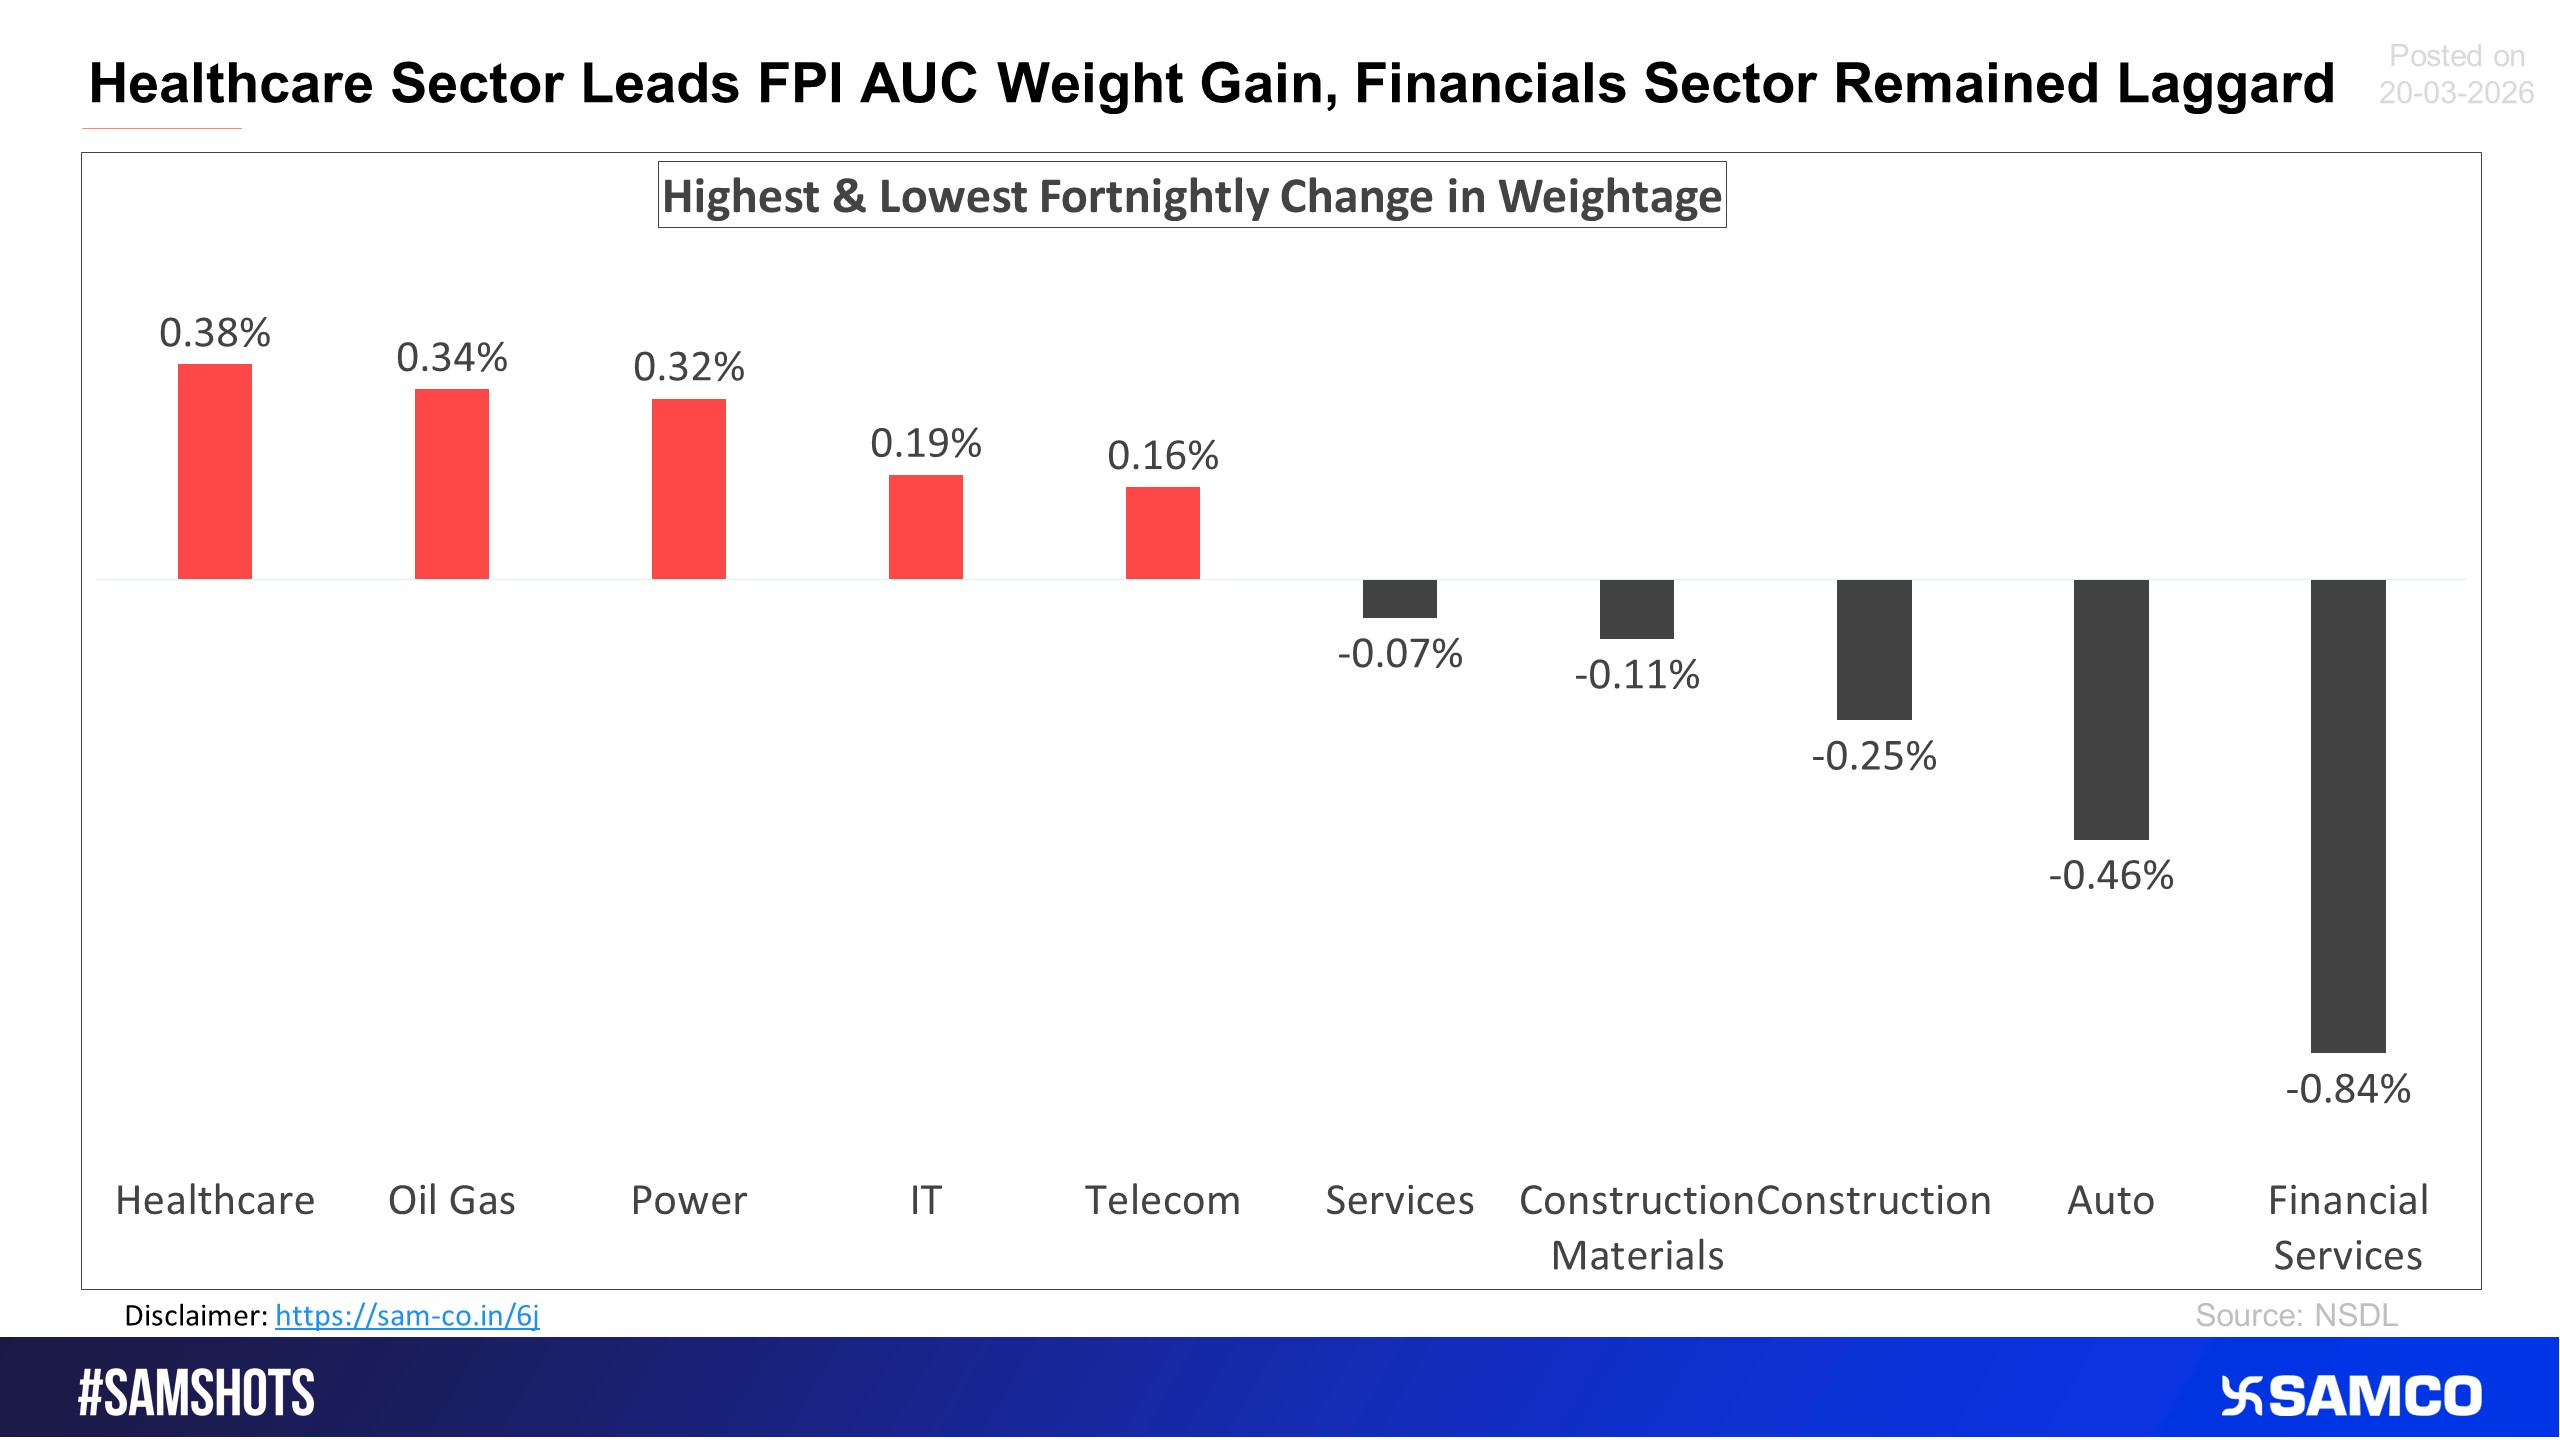
Here’s the list of sectors with highest and lowest % of inflow compared to previous period AUC.
The attached chart shows the change in weightage of FPI holdings in the latest 16th feb to 28 feb 2026 fortnight.
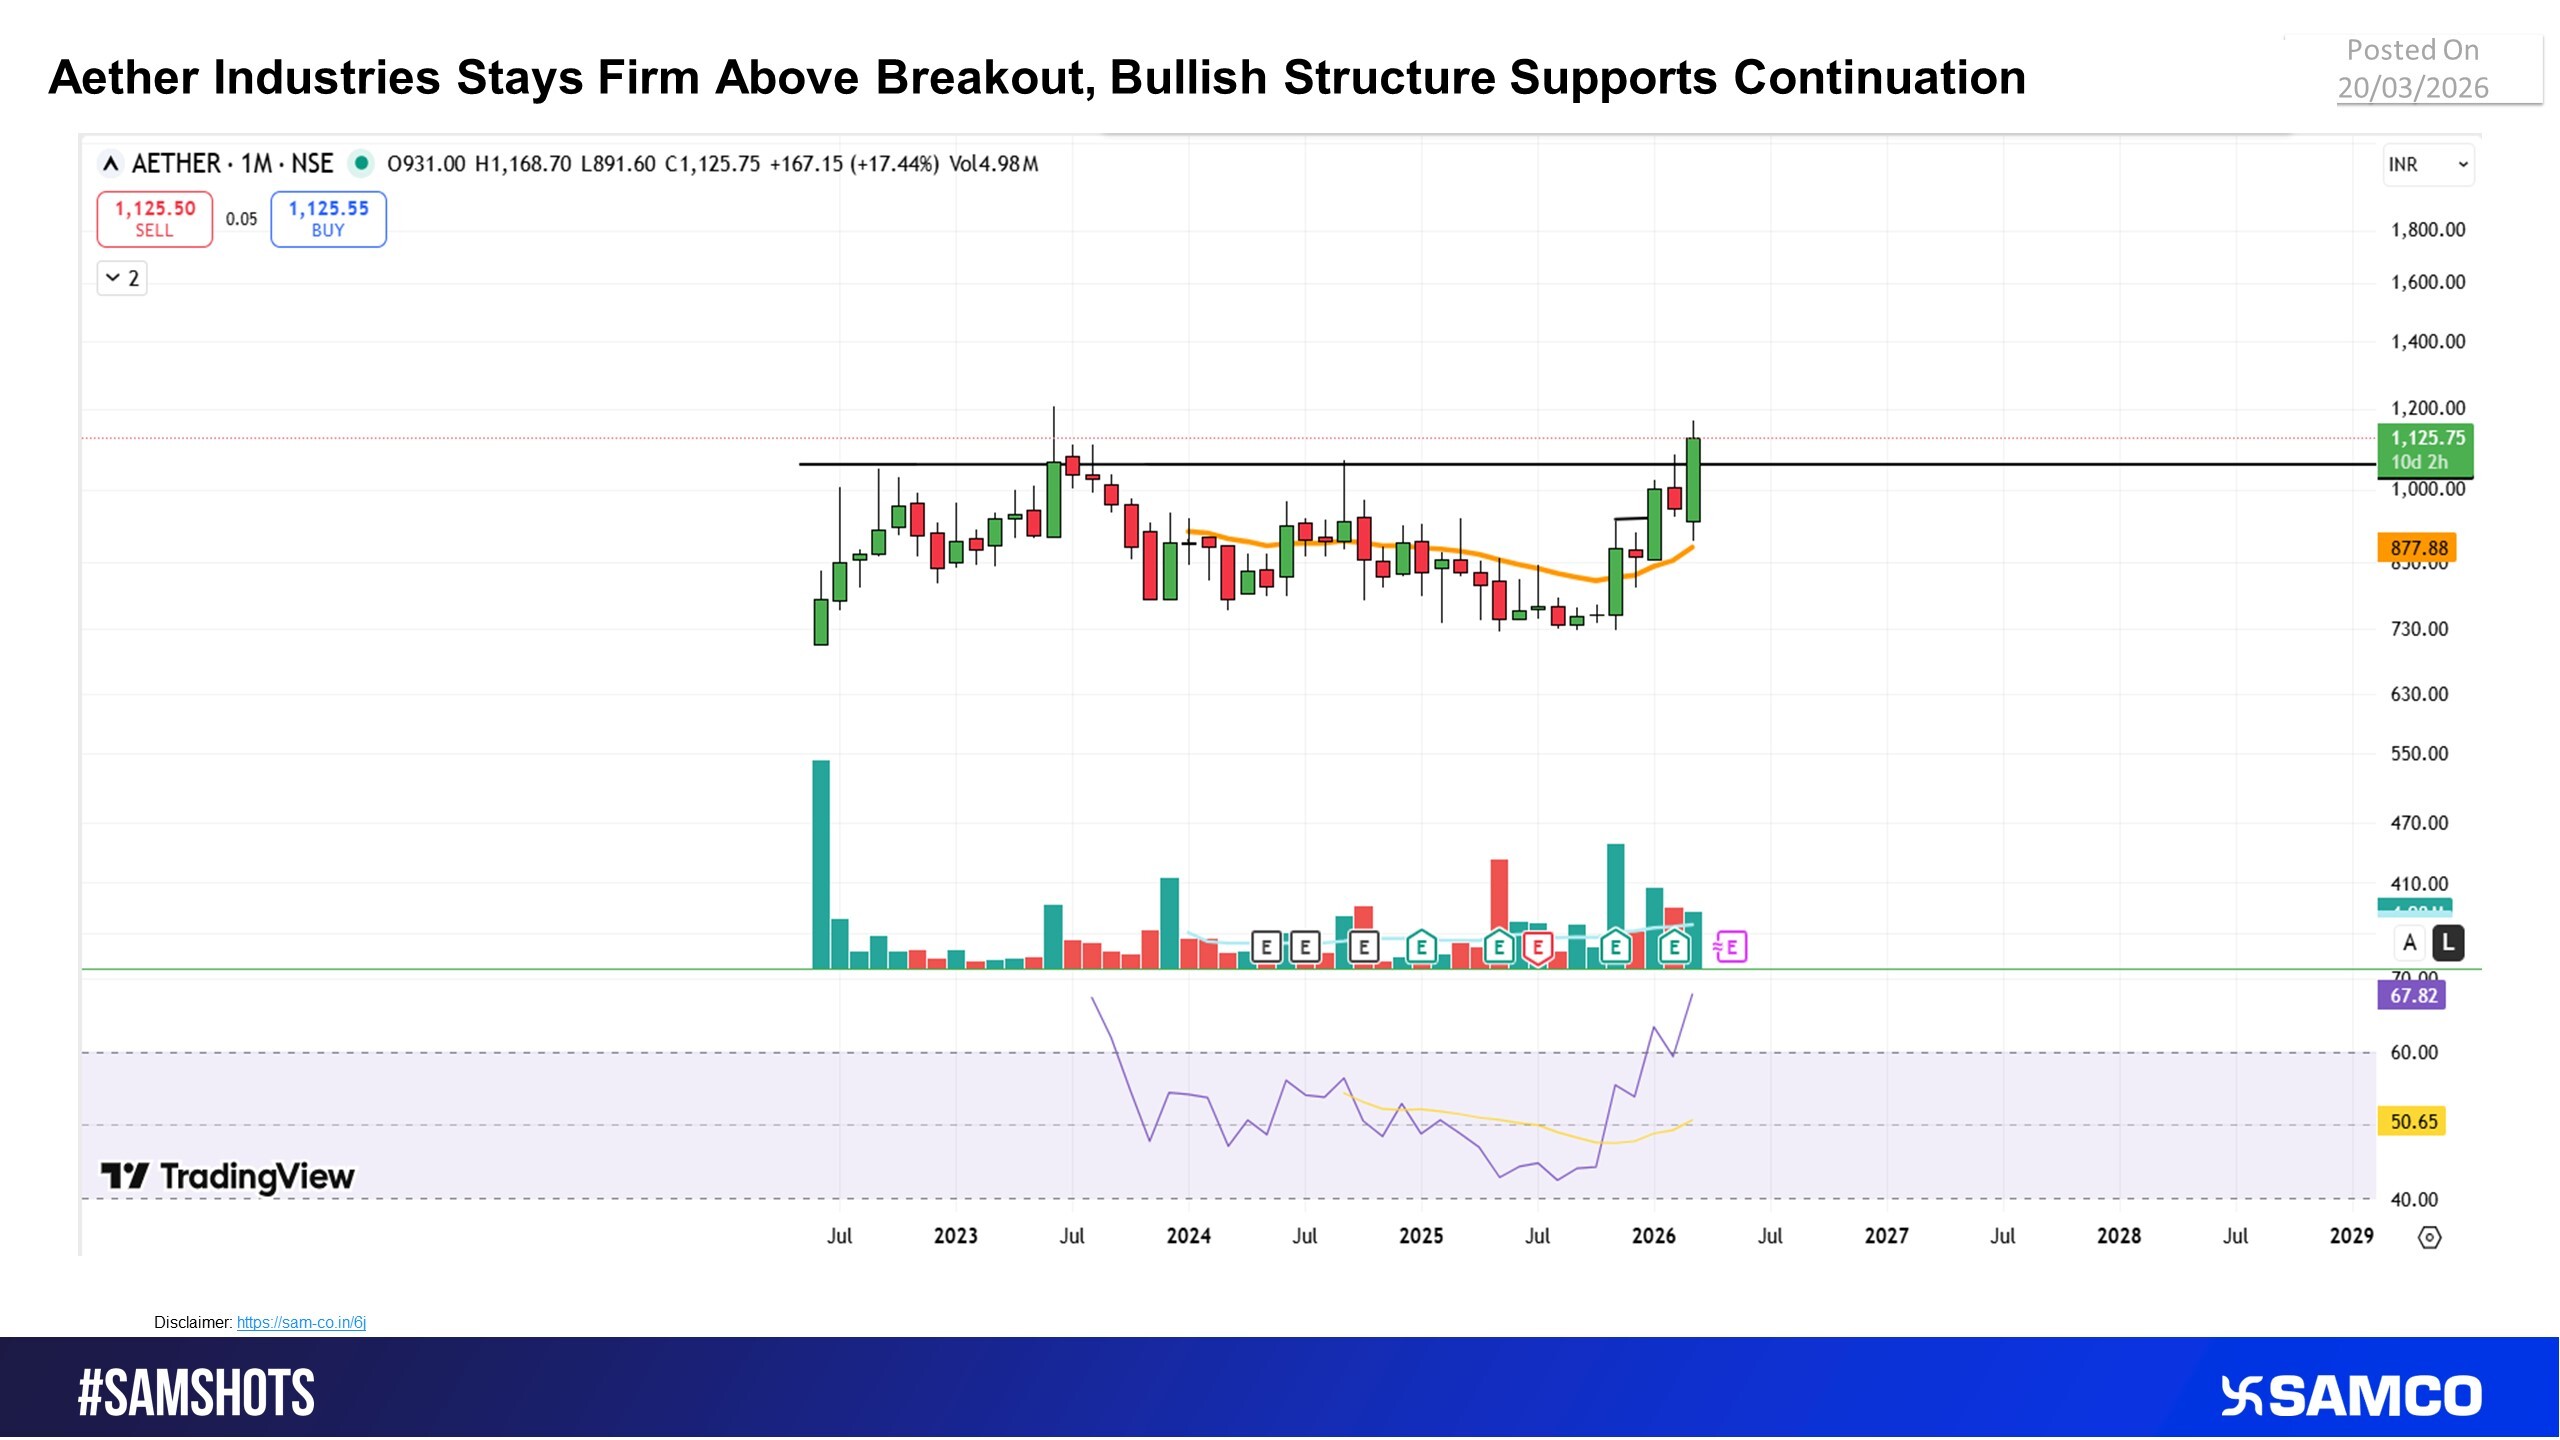
Aether Industries maintains higher-high structure; breakout signals ongoing uptrend
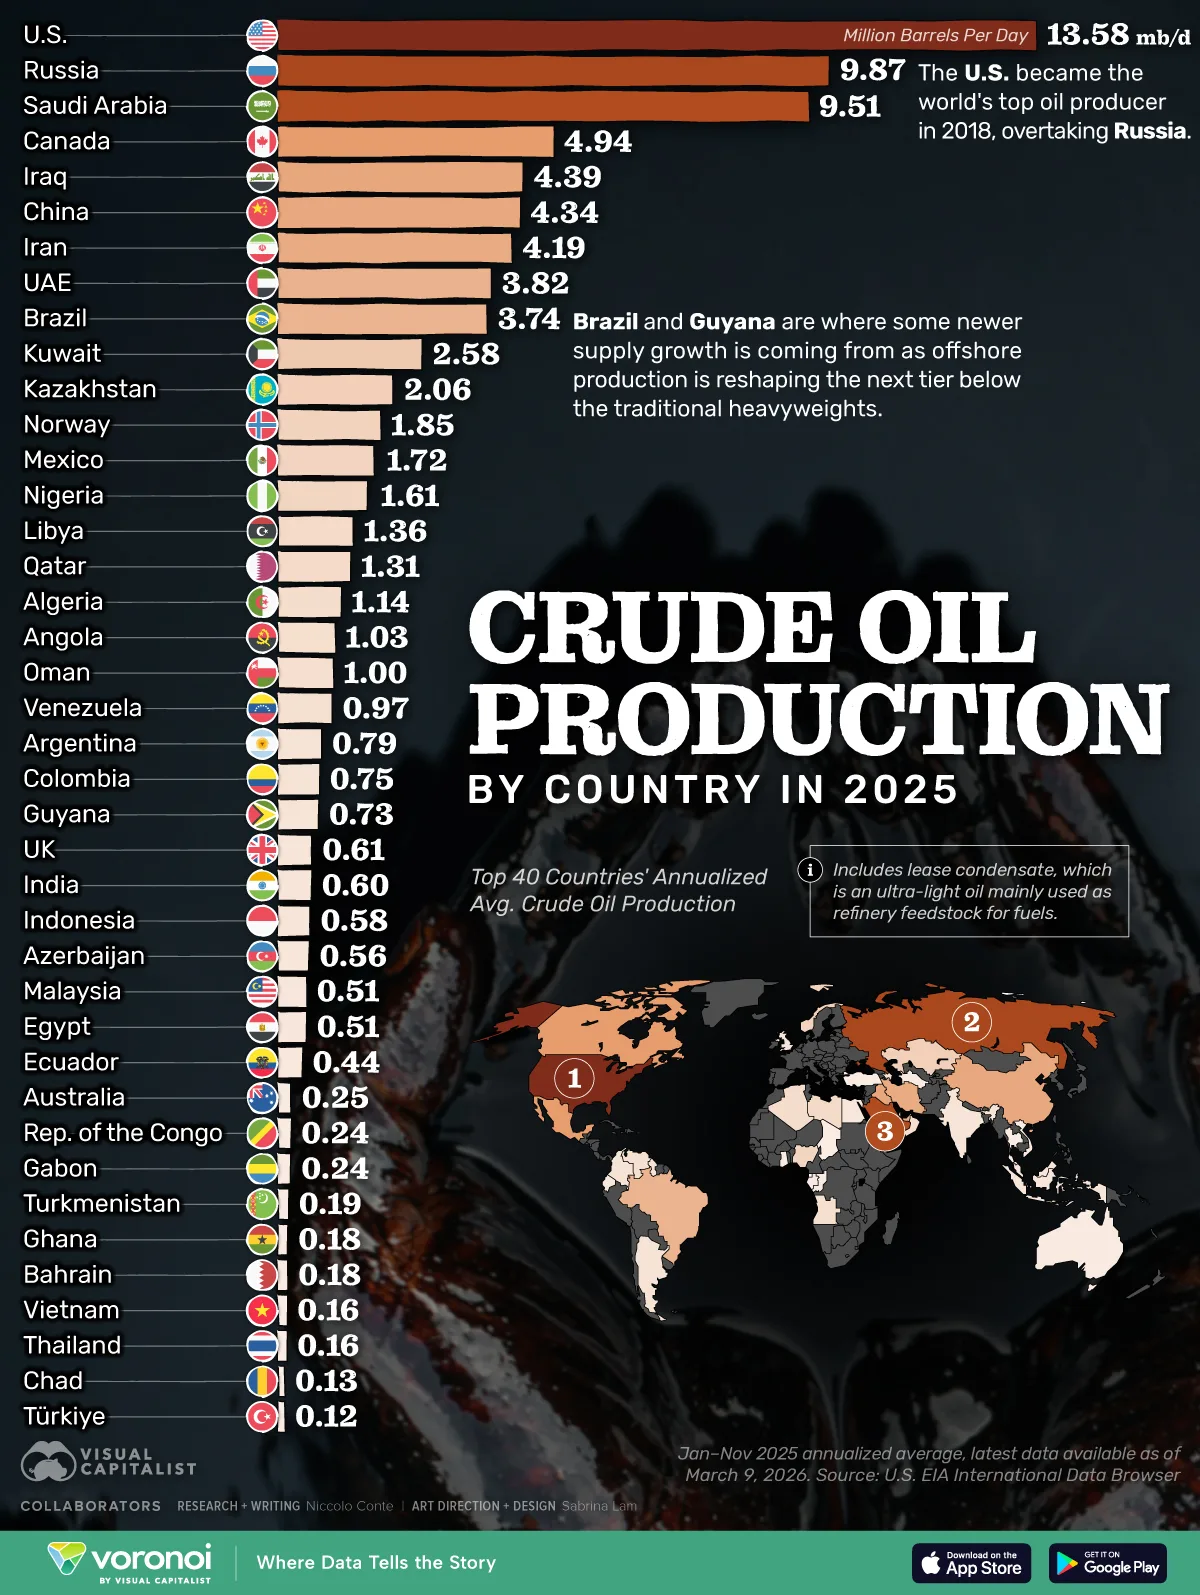
Source: visualcapitalist.com


 Easy & quick
1. Register on SCORES portal
2. Mandatory details for filling complaints on SCORES
Name | PAN | Address | Mobile | Number | E-mail ID
3. Benefits
Effective Communication
Speedy redressal of the grievances