


Sonaselection India Limited Share Price

₹
104.89
-0.24
(-0.23%)

Updated on 09-11-2026 8:18 AM
Sonaselection India Limited Price Performance

- Day's Low
- ₹104.1
- Day's High
- ₹106.8
₹ 104.89
- 52-w low
- ₹88.1
- 52-w high
- ₹117
104.89
- Day's open
₹106 - Previous close
₹105.129997 - VWAP
₹104.99 - Lower price band
₹83.92 - Upper price band
₹125.86
Today's Market Action
The last traded share price of Sonaselection India Limited was 104.89 down by -0.23% on the NSE. Its last traded stock price on BSE was 104.62 down by -0.62%. The total volume of shares on NSE and BSE combined was 36,899 shares. Its total combined turnover was Rs 0.39 crores.
Sonaselection India Limited Medium and Long Term Market Action

Sonaselection India Limited hit a 52-week high of 117 on 15-10-2026 and a 52-week low of 88.1 on 05-10-2026.
The stock price of Sonaselection India Limited is up by 7% over the last one month. Don't forget to check the full stock price history in the table below.
Sonaselection India Limited Fundamentals
-
Market Cap (Cr): 0
-
Book Value (₹):
-
Stock P/E:
-
Revenue (Cr):
-
Total Debt (Cr):
-
Face Value (₹):
-
Roce (%):
-
ROE (%):
-
Earnings (Cr):
-
Promoter’s Holdings (%):
-
EPS (₹):
-
Debt to Equity:
-
Dividend Yield (%):
-
Cash (Cr):
Sonaselection India Limited Mutual fund holdings and trends
| FUND NAME | Quantity | Monthly Change (Qty) |
|---|
Sonaselection India Limited Shareholding Pattern
Similar Stocks
| Company | Price | Market Cap (Cr) | P/E |
|---|
About Sonaselection India Limited
Data not available.
Sonaselection India Limited FAQ's
What is Share Price of Sonaselection India Limited?
What is the Market Cap of Sonaselection India Limited?
What is PE Ratio of Sonaselection India Limited?
What is PB Ratio of Sonaselection India Limited?
What is the CAGR of Sonaselection India Limited?
How to Buy Sonaselection India Limited Share?
Can I buy Sonaselection India Limited from Samco?

How do I buy Sonaselection India Limited from Samco?
Financials


(*All values are in Rs. Cr)
(*All values are in Rs. Cr)
(*All values are in Rs. Cr)
(*All values are in Rs. Cr)
(*All values are in Rs. Cr)
Consolidated Financial Performace In Graph(Net Profit)
Standalone Financial Performace In Graph(Net Profit)
(*All values are in Rs. Cr)
Consolidated Financial Performace In Graph(Net Profit)
Standalone Financial Performace In Graph(Net Profit)
(*All values are in Rs. Cr)
Consolidated Financial Performace In Graph(Cash Flow)
Standalone Financial Performace In Graph(Cash Flow)
News
Review
 Pros
Zero Debt
Strong Working Capital Cycle
 Cons
Low Sustainable RoE
Low Return on Capital Employed
Poor Cash Flow Conversion
Negative operating earnings and interest coverage
Capital Intensive Business
Poor Corporate Governance
Valuation Analysis
Margin of safety
(09/11/2026)
(09/11/2026)
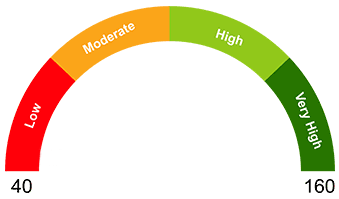

98
 0%
0% People are bullish about Sonaselection India Limited
 0%
0 % People are bearish about Sonaselection India Limited
What is your opinion about this Stock?
Historical Data
Sonaselection India Limited
₹
104.89
-0.24
(-0.23%)
Brokerage & Taxes at Samco
Brokerage & Taxes at Other traditional broker
Potential Brokerage Savings with Samco ₹ 49.62()
Top Gainers (NIFTY 50)
Stock Name Change %
Top Losers (NIFTY 50)
Stock Name Change %
