


VL E-Governance IT Solutions Ltd Share Price

₹
7.87
+0.06
(0.77%)

Updated on 22-11-2026 8:17 AM
VL E-Governance IT Solutions Ltd Price Performance

- Day's Low
- ₹7.65
- Day's High
- ₹8.1
₹ 7.87
- 52-w low
- ₹6.76
- 52-w high
- ₹26.96
7.87
- Day's open
₹7.65 - Previous close
₹7.81 - VWAP
₹7.87 - Lower price band
₹7.48 - Upper price band
₹8.26
Today's Market Action
The last traded share price of VL E-Governance IT Solutions Ltd was 7.87 up by 0.77% on the NSE. Its last traded stock price on BSE was 7.97 up by 2.44%. The total volume of shares on NSE and BSE combined was 77,594 shares. Its total combined turnover was Rs 0.06 crores.
VL E-Governance IT Solutions Ltd Medium and Long Term Market Action

VL E-Governance IT Solutions Ltd hit a 52-week high of 26.96 on 21-11-2025 and a 52-week low of 6.76 on 26-10-2026.
The stock price of VL E-Governance IT Solutions Ltd is up by 5% over the last one month. It is down by -67.96% over the last one year. Don't forget to check the full stock price history in the table below.
VL E-Governance IT Solutions Ltd Fundamentals
-
Market Cap (Cr): 155
-
Book Value (₹):
-
Stock P/E:
-
Revenue (Cr):
-
Total Debt (Cr):
-
Face Value (₹):
-
Roce (%):
-
ROE (%):
-
Earnings (Cr):
-
Promoter’s Holdings (%):
-
EPS (₹):
-
Debt to Equity:
-
Dividend Yield (%):
-
Cash (Cr):
VL E-Governance IT Solutions Ltd Mutual fund holdings and trends
| FUND NAME | Quantity | Monthly Change (Qty) |
|---|
VL E-Governance IT Solutions Ltd Shareholding Pattern
Similar Stocks
| Company | Price | Market Cap (Cr) | P/E |
|---|
About VL E-Governance IT Solutions Ltd
Data not available.
VL E-Governance IT Solutions Ltd FAQ's
What is Share Price of VL E-Governance IT Solutions Ltd?
What is the Market Cap of VL E-Governance IT Solutions Ltd?
What is PE Ratio of VL E-Governance IT Solutions Ltd?
What is PB Ratio of VL E-Governance IT Solutions Ltd?
What is the CAGR of VL E-Governance IT Solutions Ltd?
How to Buy VL E-Governance IT Solutions Ltd Share?
Can I buy VL E-Governance IT Solutions Ltd from Samco?

How do I buy VL E-Governance IT Solutions Ltd from Samco?
Financials


(*All values are in Rs. Cr)
(*All values are in Rs. Cr)
(*All values are in Rs. Cr)
(*All values are in Rs. Cr)
(*All values are in Rs. Cr)
Consolidated Financial Performace In Graph(Net Profit)
Standalone Financial Performace In Graph(Net Profit)
(*All values are in Rs. Cr)
Consolidated Financial Performace In Graph(Net Profit)
Standalone Financial Performace In Graph(Net Profit)
(*All values are in Rs. Cr)
Consolidated Financial Performace In Graph(Cash Flow)
Standalone Financial Performace In Graph(Cash Flow)
News
Review
 Pros
- No Data Available
 Cons
- No Data Available
Valuation Analysis
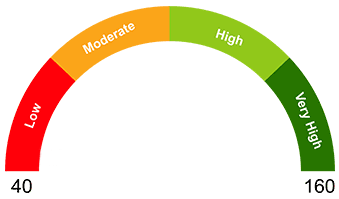
Margin of safety
(23/11/2026)
(23/11/2026)

0
 0%
0% People are bullish about VL E-Governance IT Solutions Ltd
 0%
0 % People are bearish about VL E-Governance IT Solutions Ltd
What is your opinion about this Stock?
Historical Data
VL E-Governance IT Solutions Ltd
₹
7.87
+0.06
(0.77%)
Brokerage & Taxes at Samco
Brokerage & Taxes at Other traditional broker
Potential Brokerage Savings with Samco ₹ 49.62()
Top Gainers (NIFTY 50)
Stock Name Change %
Top Losers (NIFTY 50)
Stock Name Change %
