A Security’s price fluctuates on a frequent basis through out the year. In the stock market parlance, instead of yearly highs and lows, 52 weeks high and low are usually considered. A 52 week high price is the highest price a particular security has traded during the previous 52 weeks prior to the current date and a 52 week low is the price which is the lowest price traded.
It is an important indicator as the prices at or near 52 week lows indicate that the price is trading at the lowest levels of the year. Many investors consider as the best time of the year to invest in that security or share, while traders consider this as the potential weakness in the stock and believe that it should go down more. All the investors who have bought the share in the past 52 weeks would have incurred losses in this security.
On the other hand, 52 week highs are considered by investors as the right time to go short or sell this securities while the traders consider it as the strength in the stock. Anyone who has invested in the stock and held onto it would be gaining profits in the stock.
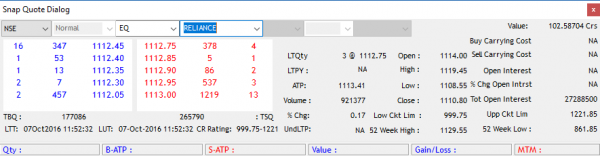
On the SAMCO NEST Trader, 52 Week high and low can be checked from the snap quote dialog box using the short cut key “F6”
 Easy & quick
Leave A Comment?