SAMCO NEST Trader display real time candles for both minute by minute intraday and historical charts. The candle gets modified along with the price on a real time basis. To understand the intraday movement of stocks over a number of days, it also provides the intraday chart upto 22 days. All the indicators can be found on the left hand side of the chart window.
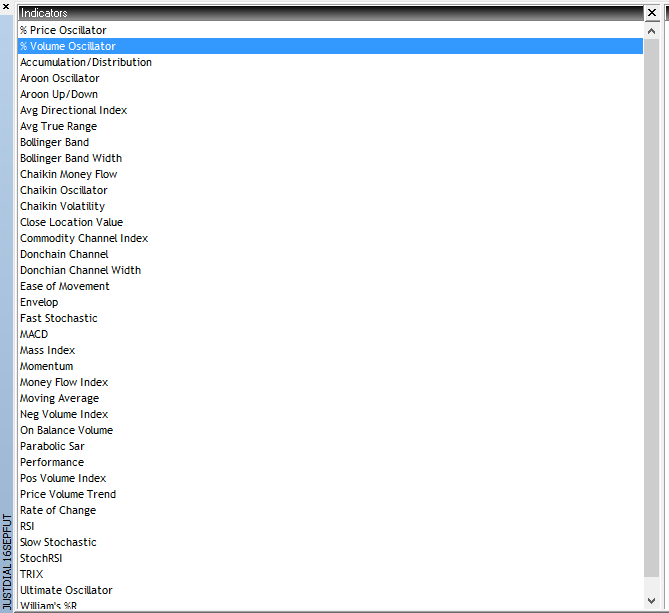
It also provides a lot of technical indicators for assisting the traders. There are various basic as well as advanced indicators available. For eg. It gives by default the support and resistance levels in intraday charts. One can add the moving averages as well to know the trend and the direction of the market. It also displays the Relative Strength Index (RSI) to know whether a scrip is near overbought or oversold levels.
Along with this, it also has advanced technical indicators like – Williams %R, On Balance Volume, Parabolic SAR, etc.
To know more about some of the indicators, kindly visit other articles as follows:
a. Bollinger Bands
b. MACD
c. Moving Averages
d. RSI
e. Stochastic – Fast & Slow
 Easy & quick
Leave A Comment?