

Stock Market Updates for December, 2023
29th December, 2023
2023 Recap: Lessons Stock Market Investors Learnt
As we bid adieu to 2023, several pivotal events defined the year’s narrative. From witnessing soaring inflation, record-high bond yields and the collapse of 3 banks to the indefinable rally of small-cap and mid-cap stocks, the unpredictable twists and turns of the year imparted valuable lessons for investors.
The year 2023 commenced with Adani-Hindenburg saga which shook the Adani group stocks as the group lost about $100 billion in market value in days. Hindenburg released a detailed report alleging various financial and accounting irregularities at Adani Group companies. Supreme Court eventually gave a clean chit to Adani. But the damage was already done. The controversy emphasized that stocks cannot keep on going up always. You must manage your risks well.
In March, 3 banks in the US namely Silicon Valley Bank (SVB), Signature Bank and First Republic Bank collapsed due to a run on their deposits caused by higher interest rates and losses on their bond portfolios. The crisis highlighted how interconnected our financial system is, the failure of one bank, even a seemingly small one, can trigger panic and domino effect, potentially leading to a larger crisis. This crisis underscored the necessity for robust regulatory frameworks, stress testing and liquidity regulations to ensure the resilience of the entire banking system.
The latter part of the year witnessed jitters from surging Inflation which impacted the bond yields as they touched record-high levels of 5% since the Global financial crisis of 2007. As the Fed continued its hawkish stance, market expectations regarding future interest rates shifted, with investors anticipating further rate hikes in 2024 and beyond. While the Fed’s December meeting did cool off the bond yields, it served as a stark reminder that assumptions of “it’s different this time” must be approached with great vigilance. These events highlight the indispensable role that macro dynamics play in shaping market outcomes, surpassing the conventional aspects of valuations, earnings growth, and interest rates.
Coming back to the Indian markets, the year saw the rise of the retailers who stood strong amidst the Foreign Institutional Investors (FII) outflows. The retail investors net invested Rs.1.8 lakh crores while the FIIs withdrew 17,029 crores in 2023. Generally, when FIIs withdraw funds, broader indices tend to fall. Notably, this time around, the markets held firm with a 20% gain, showcasing the robust influence of retail investors and their crucial role in sustaining market strength. This development signifies a shift in the dynamics of Indian markets, suggesting a newfound independence from FIIs flows.
2023's small-cap and mid-cap rally delivered a masterclass in diversifying beyond blue-chips. The retail participation caused remarkable gains in the small-cap and mid-cap stocks as the Nifty Smallcap 100 and the Nifty Midcap 100 rallied 55% and 46% respectively. This exceptional performance of the small-cap and the mid-cap significantly outperformed the benchmark indices. The rally wasn’t confined to a few sectors or stocks, but was broad-based with over 85% of stocks ending on the positive note. The resurgence after a bleak 2022 for these stocks highlighted a fundamental truth: just as the saying goes, "you rise after a fall," markets possess an inherent ability to rebound, regain and flourish.
All of these developments sent shockwaves, but the Indian markets stood high amid the storm of volatility. These developments serve a reminder that in investing, volatility is an inescapable companion and the key lies in maintaining patience and remaining invested in quality names for a long term.One of the valuable lessons learned is the importance of timing in making profitable investments. Seizing the right moment, particularly when a stock is trading significantly below its intrinsic value, can be a catalyst for financial success. The art lies in identifying themes poised for growth and weathering short-term uncertainties with composure.
Ultimately, the year's experiences underscored the timeless wisdom that successful investing involves a combination of resilience, strategic timing, and a discerning focus on long-term value. The market, with its undulating patterns, rewards those who handle its complexities with patience, insight, and an unwavering commitment to enduring principles.
Technical Outlook
_1703845912.png)
The Nifty50 index concluded the year on a triumphant note, delivering an impressive 20% return. A confluence of positive factors fueled a remarkable rally with foreign capital inflows drove the indices to unprecedented record highs.
On the monthly chart, the Nifty50 retains its primary strength forming strong bullish candles. The market's breadth has been consistently strengthening over the past two months, enabling mid-and small-cap stocks to steadily reach new highs.
A closer look at the weekly charts reveals a strong support base at 21,200. Notably, the weekly Relative Strength Index (RSI) stood above 75 which further signals substantial strength. Any minor pullback, possibly near to 21,400-21,500 range would be considered as a healthy correction for the next rally toward 22,000 levels.
The month of January is expected to be volatile, especially leading up to the financial budget in the next month. All eyes are on the 22,000 levels with key events anticipated to sustain the Nifty buoyancy.
All of the major sectors are currently hovering near their all-time highs and the prevailing momentum is expected to persist in the coming weeks. However, for Nifty to remain at all-time high and for stocks to replicate a similar stellar performance may prove challenging.
22nd December, 2023
Market Wonderland: Unwrapping the Small Cap Secrets
As Christmas lights twinkle and the festive vibe kicks in, we approach a widely recognized seasonal phenomenon in global financial markets - the Santa Claus Rally. This trend entails a notable upswing in the stock prices during the last five trading days of December and the first two days of January. Currently, the Indian stock markets are trading at lifetime high levels setting a perfect stage for the eagerly awaited Santa Claus rally.
The table below shows the Nifty 50 returns during this period over the past 22 years.
| Period | Nifty 50 Returns (%) |
| 2021-2002 | 0.93% |
| 2002-2003 | 1.59% |
| 2003-2004 | 2.04% |
| 2004-2005 | 8.81% |
| 2005-2006 | 2.82% |
| 2006-2007 | 4.93% |
| 2007-2008 | 7.07% |
| 2008-2009 | 2.67% |
| 2009-2010 | 5.77% |
| 2010-2011 | 2.21% |
| 2011-2012 | 1.00% |
| 2012-2013 | 2.12% |
| 2013-2014 | -1.20% |
| 2014-2015 | 1.49% |
| 2015-2016 | -1.24% |
| 2016-2017 | 2.85% |
| 2017-2018 | -0.14% |
| 2018-2019 | 0.11% |
| 2019-2020 | 0.11% |
| 2020-2021 | 3.37% |
| 2021-2022 | 5.12% |
| 2022-2023 | 2.26% |
| 2023-2024 | ? |
The table below shows the returns of Nifty SmlCap 100 during these seven days over the past 11 years.
| Period | Nifty SmlCap 100 Returns (%) |
| 2012-2013 | 3.89% |
| 2013-2014 | 1.06% |
| 2014-2015 | 5.73% |
| 2015-2016 | 1.33% |
| 2016-2017 | 6.24% |
| 2017-2018 | 2.50% |
| 2018-2019 | 0.46% |
| 2019-2020 | 4.81% |
| 2020-2021 | 5.32% |
| 2021-2022 | 5.73% |
| 2022-2023 | 7.07% |
| 2023-2024 | ? |
History tells us that the smallcap index tends to catch up during the Santa Claus rally. The above data reveals a consistently positive trend for the index over the past 11 years. Remarkably, this index has delivered positive returns every single year during the last five trading days of December and the first two days of January.
We can say that, during this period, retail investors enthusiastically engage in a buying spree, dancing to the merry tunes of the Santa Claus Rally.
The charts below showcase the fortnightly returns of Nifty SmlCap 100 for the latter half of December and the first half of January over the past 11 years. The index concluded positively in 9 instances during the second half of December and 7 instances during the first half of January within the same period.
_1703247327.jpg)
_1703247327.jpg)
While recent market fluctuations have seen a dip, including the small-cap segment, historical trends suggest a potential resurgence during the upcoming rally. Nifty SmlCap 100 has historically showcased resilience during this period. In essence, as we unwrap the layers of data and insights behind Small Caps’ December performance, we can say that the financial markets often present a gift in the form of the Santa Claus Rally, with small-cap stocks positioned to give a positive conclusion for the year.
Technical Outlook
_1703247328.jpg)
The Nifty settled at 21,349.40 down by 0.50% in a week.
Nifty ended its seven-week winning streak, signaling a pause in its upward movement. At the same time, global indices also displayed a slight slowdown in bullish momentum ahead of Christmas.
Technically, Nifty exhibited resilience by holding onto the crucial 21,000 mark following a sharp one-day decline and this level is now perceived as a strong support. The 20-day Simple Moving Average (SMA) is hovering around the 20,830 level providing additional support. On the higher side, if it breaks 21,600 then Nifty might attempt to test new highs around the 21,750-21,800 zone.
15th December, 2023
Don’t Make This Mistake While Buying Stocks at Nifty 21,300
Markets soar to new record highs thrilling all the stakeholders with an adrenaline rush. Post the state elections results, all the market participants are optimistic about India’s growth story catalyzing the Nifty- 50 ride.
In this hype, many retail investors are rushing into the market. They may be influenced by the euphoria of Nifty at all-time highs and fear of missing out. However, in this rush to participate and benefit from the markets they are ignoring the risks associated with it. Risk is inseparable from the world of investing.
Creating fresh positions in haste without considering a vital factor - the margin of safety would lead to unbearable losses. It's crucial to weigh potential drawdowns before impulsively investing in stocks that are already in the limelight.
Stocks can fall at any time. The reason for the fall might not be in the control of the company management. The reason could be margin contraction because of a rise in raw material prices, changes in government regulations, peer competitors' moves, etc. leading to the erosion of the wealth of investors.
Usually, the recovery from such a drawdown requires greater momentum and percentage points for the fallen stock to reach its breakeven.
Here’s a simple math for the same:
| Drawdown (%) | To Breakeven (%) |
| 10% | 11% |
| 25% | 33% |
| 50% | 100% |
| 75% | 300% |
Recovering 300% after a drawdown of 75% needs a lot of micro and macro factors to be aligned for the company which may take several months to a few years. Meanwhile, ordinary retail investors lose their patience and exit from the stock at worst possible time.
A stock has fallen by certain percentage points as indicated above it is wise to square off and search for some other better opportunities. If the reason for investment isn’t valid any more than one must not buy just to average down the investment. Several investors lost their fortunes just to catch such falling knives.
The same concept applies to broader indices too. Sensex has witnessed several drawdowns of approximately 25% in every 3.5 to 4 years from its previous all-time highs. Such a major drawdown was recently seen in the year 2020 due to Covid and history may repeat itself any time soon.
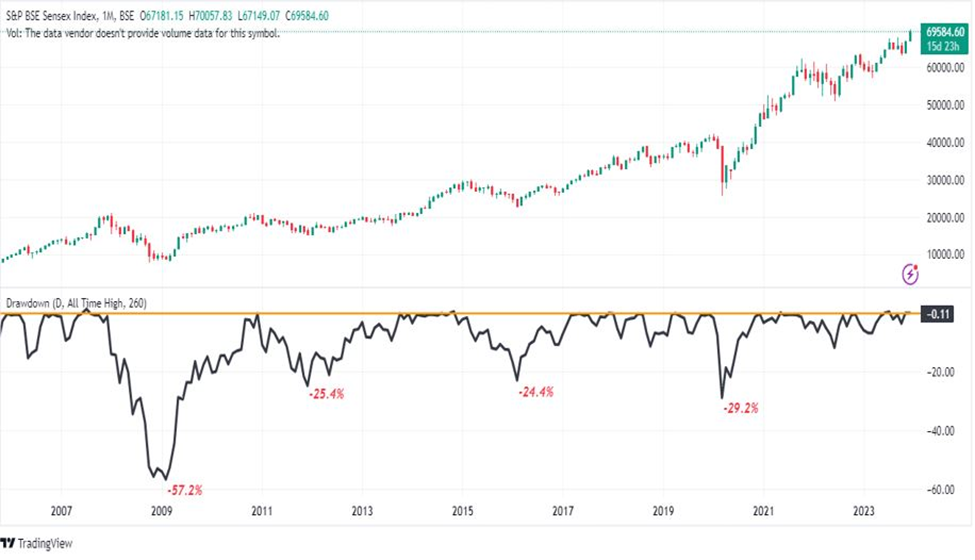
An investor with the flexibility to shift their allocations among different asset classes in response to changing market conditions must take advantage of such opportunities.
When one type of asset class performs poorly another asset class often provides steady returns resulting in stability during market turmoil. Diversification of portfolio is an important method to mitigate the risk of drawdown from one asset class.
A proper blend of allocation among these financial assets would act as a hedge against market volatility and help investors manage their risks efficiently or exit from the markets when the time is right to achieve their financial goals peacefully.
Technical Outlook:
Nifty marked a new record high propelled by active buying from Foreign Institutional Investors (FIIs).
The RBI and the Fed kept rates unchanged and the sentiment continued to push the stocks on the higher side. Nifty rallied 2.32% this week while in the Dec series, it shot up by 6.25%.
All sectors have participated in this rally namely Nifty IT, Metal, and PSU Bank.
Technically, the weekly chart recorded its 7th consecutive bullish close. Nifty is trading above all key moving averages. Although daily RSI remains in the oversold zone, however this might continue to remain in this zone for quite some more time. Generally, the bull run continues with a rapid and blitzing pace.
Technically, the weekly chart recorded its 7th consecutive bullish close. Nifty is trading above all key moving averages. Although daily RSI remains in the oversold zone, however this might continue to remain in this zone for quite some more time. Generally, the bull run continues with a rapid and blitzing pace.
India VIX, the fear gauge, stayed calm throughout the week and ended at 12.58.
The Nifty is counting on gaps with moderate volatility and this indicates strength in the prevailing trend.
8th December, 2023
The Best Investing Opportunity at 21,000 Nifty
As we enter the last month of 2023, the key market indices hit record highs setting in a festive mood. Santa has already paid a visit to D-street, boosting the spirits of Nifty50 bulls, and now the anticipation is building for Santa to bring joy to the Nifty Bank.
Bank Nifty has grappled with underperformance in the past 5 years compared to the benchmark Nifty50. The banking index recorded a growth of 78%, notably trailing behind Nifty50, which witnessed a 96% surge during the same period. This performance gap has sparked curiosity among market enthusiasts, prompting a pivotal question: Can Bank Nifty reverse the trend and outperform the benchmark?
_1702036439.png)
History implies that it has a good chance of beating the benchmark.
The price-to-book ratio of Bank Nifty has dipped lower to 2.72 levels, closely aligning with its 5-year average of 2.69x. This signals attractive valuations for the entire index.
_1702038569.png)
Furthermore, the decadal-low Foreign Portfolio Investors (FPI) equity holdings are bound to make a comeback sooner than later. This suggests that darlings of FPI aka Banking and Financial Services may witness inflow of hot money due to their reasonable valuations.
The chart below reveals the spread of 4 Year rolling returns of Bank Nifty over Nifty50. It is hovering around its lowest level since the global financial crisis. This suggests a potential bottoming out of the underperformance.
_1702038644.png)
We have also observed that the last calendar quarter of the year is strongest for Bank Nifty.
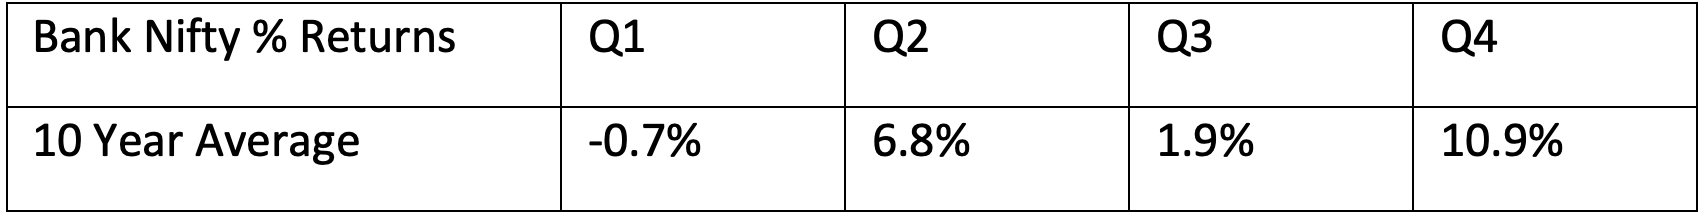
Here’s the returns that Bank Nifty has generated from October to December for the last 10 years. You can notice that seven out of 10 quarters Bank Nifty has generated a positive return.
_1702038886.png)
This year, too, Bank Nifty has delivered a solid 5% return so far in the October-December period, indicating a potential strong finish to the year 2023
From where we stand now, banks are poised to drive the next leg of growth, supported by a benign asset quality environment, moderation in slippages, growth in advances, and credit expansion, leading to a stronger balance sheet.
Investors should keep an eye out for further signs of outperformance from Bank Nifty, keeping in mind the wise words of Charlie Munger: "Opportunity comes to the prepared mind."
Technical Outlook
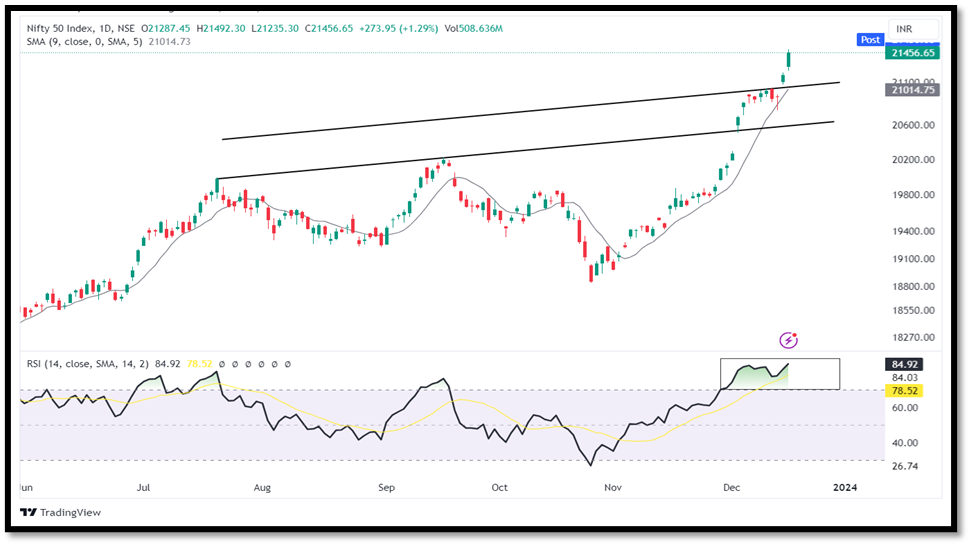
_1702039034.png)
RBI maintained the repo rate at 6.5% for the 5th consecutive time, leading Nifty50 to mark an all-time high of 21,006.10.
In fact, Nifty50 rose by 3.46% in the week, marking the 6th straight weekly winning streak.
A gap up observed on the weekly chart signals robust relative strength. The index is likely to maintain its strength unless it closes below the critical level of 20,500.
Until RSI is holding above 80 levels, the Nifty50 primarily remains sideways to bullish; however minor correction cannot be ruled out. Nifty50 is trading above all key moving averages. Donchian Channel, which looks for bullish and bearish extremes, is also exhibiting a bullish signal.
In the past, the month of December preceding an election year has yielded significant returns.
Furthermore, the FPI positioning will be closely monitored for the next leg rally and to ascertain the direction of the market.
The IT and Realty indices signal strength, indicating that heavyweight stocks in these sectors might continue to outperform.
1st December, 2023
Beyond The Listing Day: Understanding the Short-Term Dynamics of Mega Listing IPOs
In recent days, the conventional greetings among friends and colleagues have shifted from "Namaste" and "Kaise Ho" to a new trend centered around "IPO Allotment Laga kya" due to the heightened excitement surrounding initial public offerings (IPOs) and their remarkable market debuts. This enthusiasm is fueled by a pervasive Fear of Missing Out (FOMO) among investors, leading to unprecedented levels of oversubscriptions. In the midst of this frenzy, investors are applying indiscriminately for major IPOs in the hopes of capitalizing on their lucrative listings. Given the substantial gains witnessed on listing days for recent IPOs, it's understandable why investors are eager to participate. Once investors successfully secure allotments, the next dilemma arises—whether to swiftly sell the shares at the peak of their listing gains or to ride the momentum for a while longer. This article delves into an analysis of the top-performing IPOs with bumper listings over the past eight years, aiming to unravel their short to medium-term performance trends.
The Year 2023 has been a fantastic year for IPO investors, with its top 10 listing IPOs reporting an average listing gain of 83.2%. However, it might surprise you that this is actually the second-best year in the past decade. The best year has been 2021, where the top 10 IPOs reported average listing gains of a mammoth 127.7%.
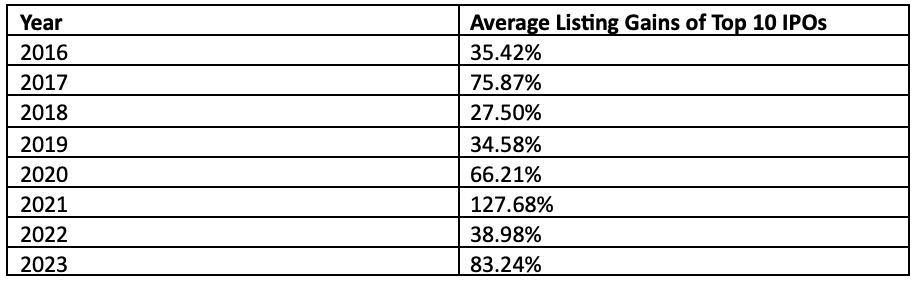
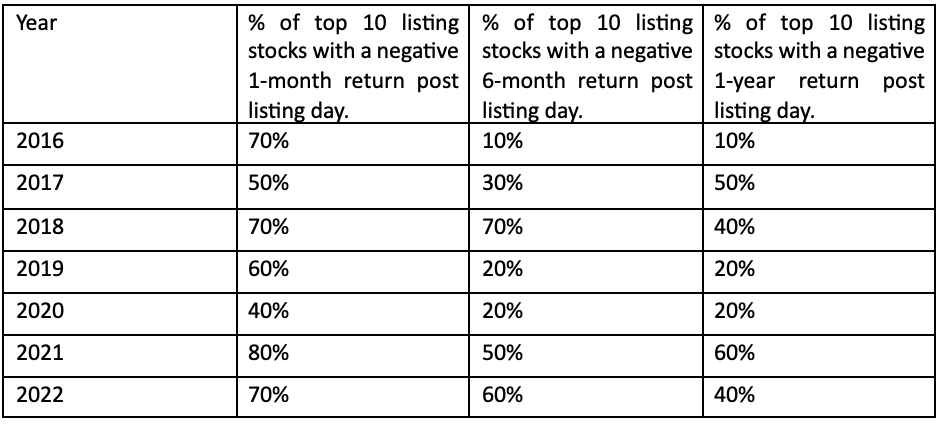
Further it is interesting to note that, after massive listing gains, the stocks historically have gone on a little correction or have remained sideways for the next one month. From 2016 to 2022, the average one-month gains of the top 10 listing IPOs, have been in negative four times, flat for one and positive for only two times.
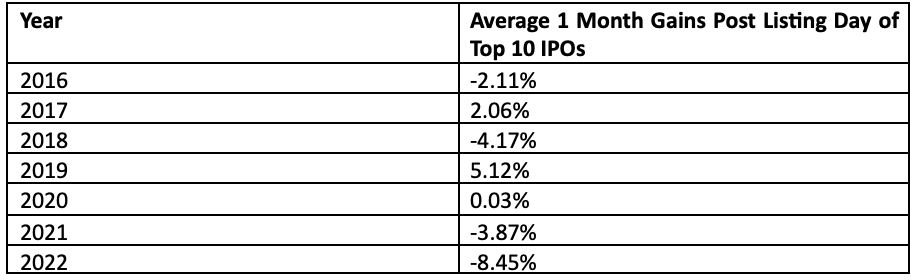
This underperformance of the mega listing IPOs in the short period is further highlighted by the fact that in the current calendar year 2023, 83% of the top 10 listings have reported a negative one month return post the listing day. This trend holds true for other years as-well.
The observed underperformance of mega listing IPOs in the short term can be attributed to various factors, primarily stemming from the speculative nature of investor behaviour driven by the FOMO. Investors hastily engage in IPOs, driven by the expectation of immediate listing gains, resulting in inflated valuations detached from a company's intrinsic value. Following the initial listing day excitement, market dynamics shift as IPO allottees seek to capitalize on significant gains, triggering a stock sell-off and contributing to corrections or sideways movements. This phenomenon reflects the influence of short-term trading sentiments over the company’s fundamentals. Furthermore, the post-listing period serves as an opportunity for market forces to realign stock prices with realistic valuations, as inflated initial gains may prove unsustainable without solid financial performance. Investors initially attracted by the prospect of quick profits may exit positions, adding to downward pressure.
Thus, investors should exercise caution, conduct thorough due diligence, and consider a more long-term perspective when participating in IPOs to navigate the volatile initial phases of newly listed stocks. It's crucial for investors to let the dust of euphoria settle and, when clarity emerges, make informed decisions regarding their positions.
Technical Outlook
_1701430173.png)
Nifty marked an all-time high of 20,267.90 breaking its previous high of 20,222.45. It took nearly 77 days to attain a new high from the previous high.
Nifty gained 5.18% in November and formed a bullish candle that has engulfed its previous four months candles while on a daily chart, index is exhibited unwavering bullish momentum as well.
Nifty is trading above all key moving averages and holds strong support around 20,000 levels. RSI is comfortable holding 74 levels, indicates overall strength.
According to the Fibonacci retracement, if index crosses 20,350 levels, we could expect 20,550-20,620 levels in coming week.
After a three-month sell-off, Foreign Institutional Investors (FII) turned net buyers, worth Rs. 3875.8 crore, while Domestic Institutional Investors (DII) also bought Rs. 14,253.6 crore in the month of November.
We anticipate that Nifty FMCG and Metal will continue to outperform in the coming week.
 Easy & quick