

Stock Market Updates for January, 2024
25th January, 2024
Caution in the Capital Goods Sector Boom
The capital goods sector was the center of attraction last year...flaunting impressive numbers and catching the attention of many investors. Before enthusiastically diving into what looks like a great chance to make money, it is important to be cautious. For the year ended December 31, 2023, the S&P BSE Capital Goods Index experienced a remarkable surge of 66.89%, outpacing the Nifty 50 and Sensex by a considerable margin.
This exuberant growth may spark excitement, but beneath the surface lies a market that might be getting a bit too frothy for comfort. Overconfident investors, perhaps overlooking essential market fundamentals, have contributed to pushing the prices of securities well beyond their intrinsic values. In this article, we will explore three reasons why caution should be taken by investors eyeing the capital goods sector.
Rich Valuations
As of January 24, 2024, the S&P BSE Capital Goods index had a PE ratio of 48.31 (Source: Trendlyne). Many companies within the capital goods sector are showing PE ratios that go well beyond their 10-year average. This indicates the high valuations of some companies compared to the overall index. Companies having excessively high PE ratios have little margin of safety. There is a high probability of a fall in prices if the expected growth doesn’t materialize.
Excessive Speculation
A key metric that can be used for gauging market perception is the ratio of turnover to market capitalization. This ratio is calculated by dividing the total turnover of a stock over a specific period by its market capitalization. So if the turnover of a company’s shares is greater than its market cap then it means that people are not holding on to the company for too long. They are churning the stock more often. The stock is in the hands of speculators rather than investors.
Several companies in the S&P BSE Capital Goods index have high turnover compared to their market cap. This indicates the entire sector is in the grip of speculators rather than investors at the moment.
Reversion to the Mean
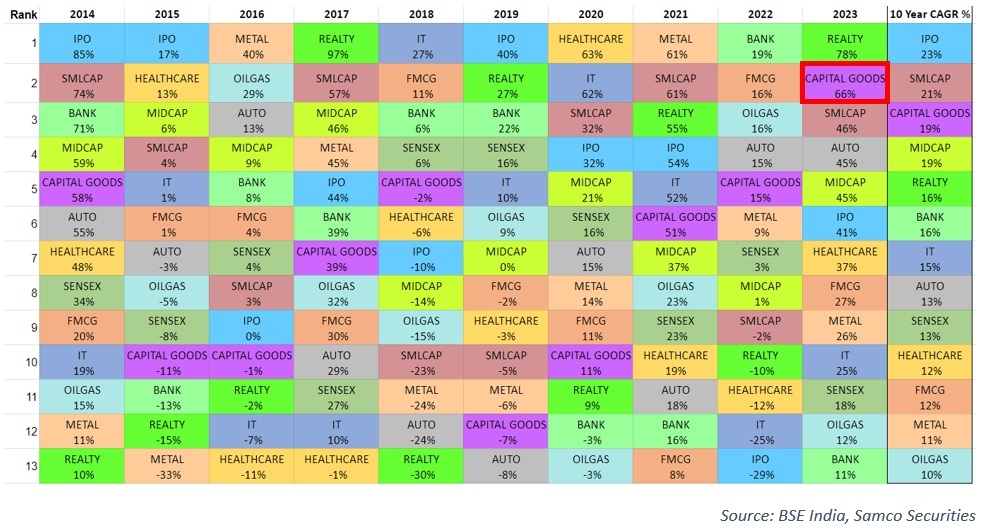
With a staggering surge of 66%, the S&P BSE Capital Goods Index has undeniably been the star performer in 2023, marking its most significant surge in the past decade. This stellar performance outpaced major indices, further fueling the excitement around the sector. However, it would be naïve to think that the sector will deliver similar returns in 2024. This raises concerns also because the sector’s current valuations is currently at its peak. Investors looking to add capital goods stocks to their portfolios must balance enthusiasm with prudence, and a wise move is to wait for a correction before they can enter.
Technical Outlook
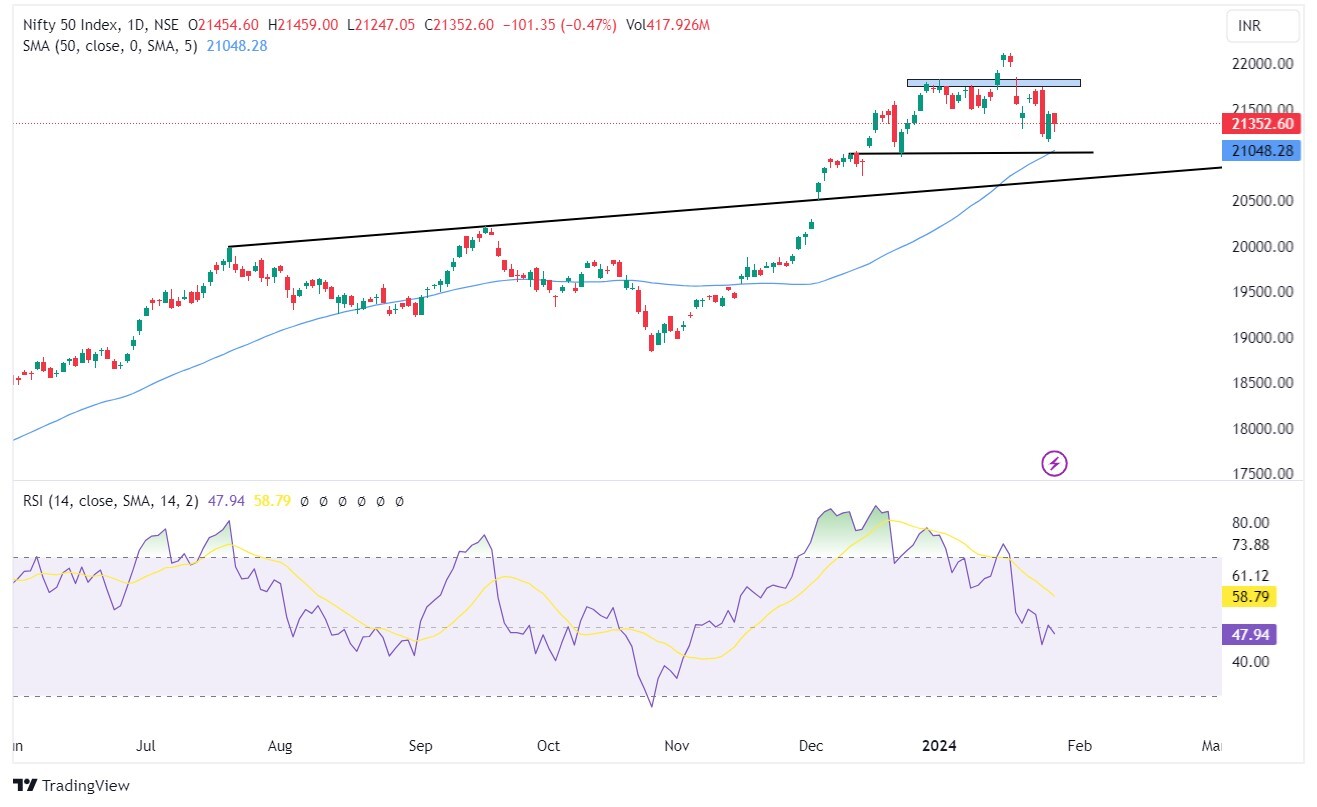
In the weekly wrap, Nifty concluded at 21,353 marking a 1.02 % decline.
Sectorally, Nifty Media, Realty, and FMCG were the top underperformers. Despite persistent attempts to breach crucial resistance, each effort resulted in a sell-off. The Nifty oscillated in a broad range of 21,138 to 21,750 levels.
Technically, the Nifty has formed consecutive bearish weekly candles falling nearly 3.5% from its all-time high of 22,124.
In the daily chart, the RSI remains weak, staying below the average level of 50. The index has fallen below the 20 DMA and holds minor support at the 50 DMA. However, weekly support stands firm at 20,770 followed by 20,500 levels while the upper Bollinger band poses resistance around the 21,750 zone.
In January until the 24th, Foreign Portfolio Investors (FPIs) offloaded equities worth Rs. 33,634 crores, while Domestic Institutional Investors (DIIs) purchased equities amounting to Rs. 16,502 crores, this indicates a discernible shift in change in trend.
As Budget 2024 approaches, various sectors are experiencing momentous upheaval with volatility, as evidenced by the rising India VIX.
19th January, 2024
What Lies Ahead for Nifty IT in a Shifting Landscape
India's dominant position in the global technology landscape has traditionally been fueled by its robust IT services sector. Despite its historical strength, the sector has encountered significant challenges in the past year, primarily due to macroeconomic factors. But, are the signs of worrying over for the Indian IT sector? Let’s have a look.
In a seasonally weak quarter, major Indian IT firms reported robust Q3 numbers. While the US macroeconomic conditions are not yet out of the woods, as reflected in management actions like either tightening or lowering the revenue guidance growth. However, there are green shoots visible with a notable uptick in deal momentum across various markets, and then there is considerable enthusiasm surrounding Generative AI, suggesting potential for future advancements in the sector.
So, will the Nifty IT Sector outperform?
ODidn’t I already tell you that in our article 3 months ago?
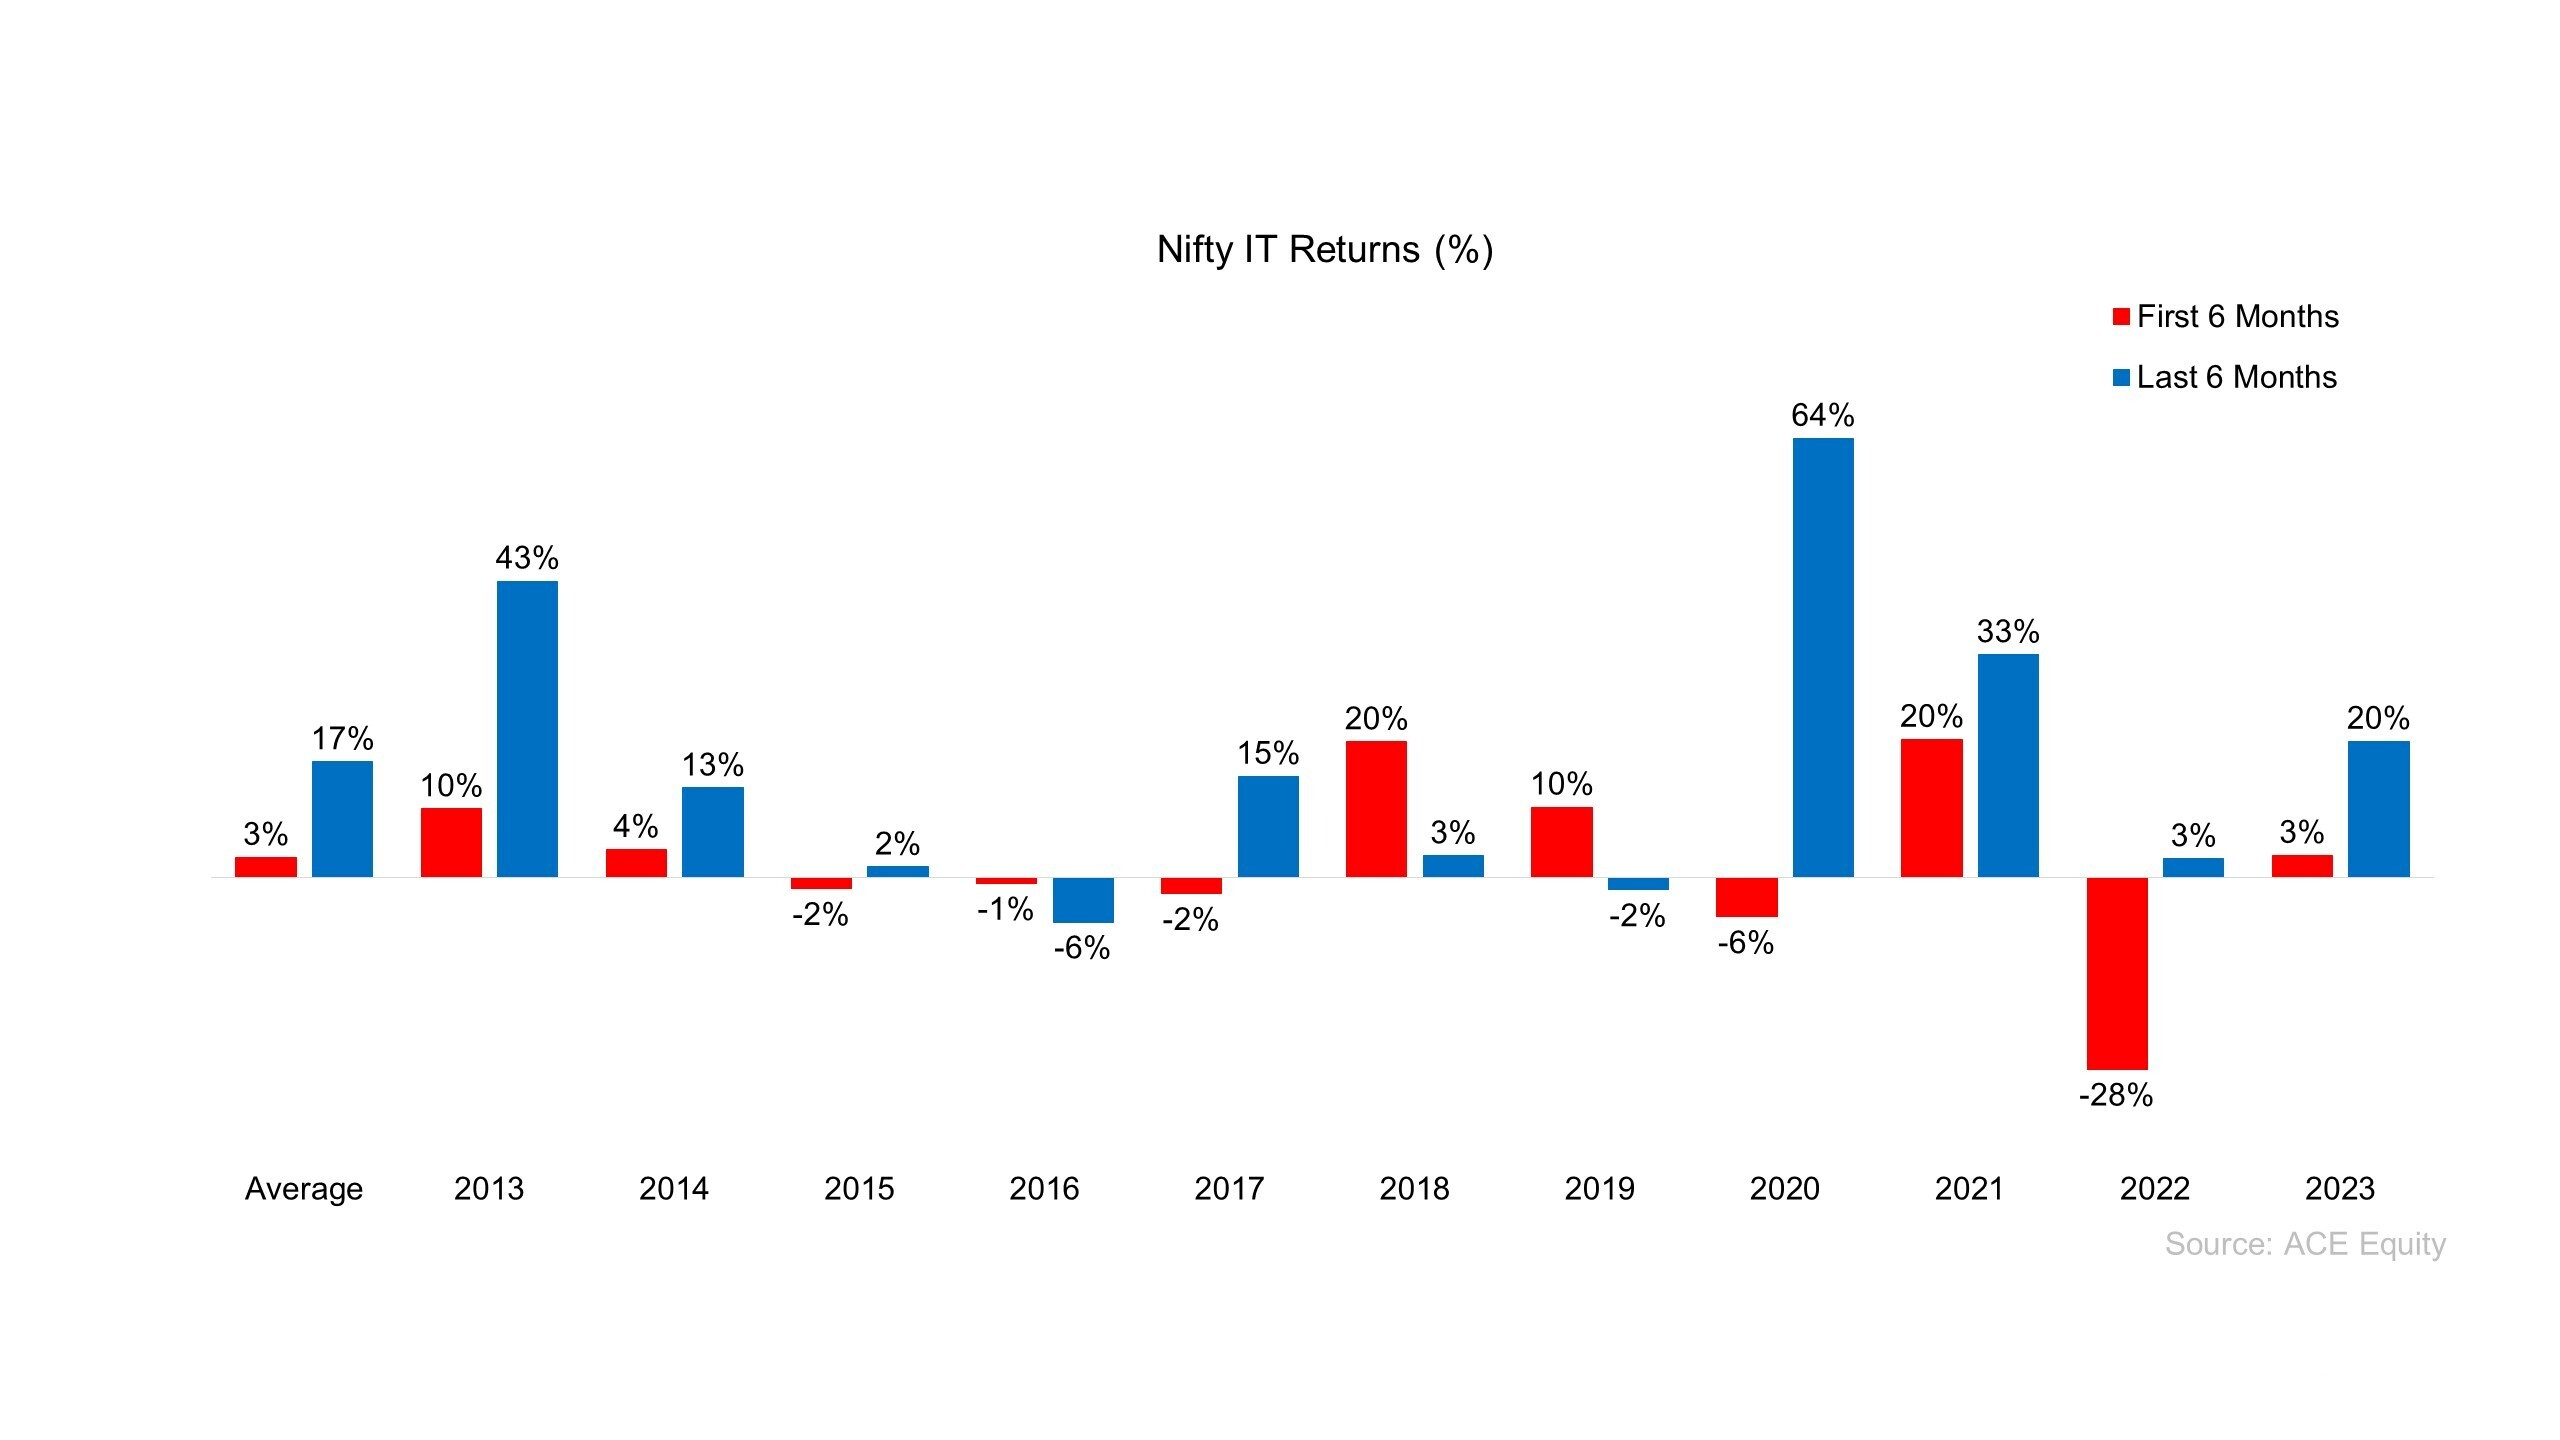
The following chart depicts a decade-long assessment of Nifty IT, highlighting the contrast in its returns between the initial six months and the latter part of each calendar year. Impressively, the IT index demonstrated notably stronger performance during the latter half in 7 out of 10 years. The average return in the first half of the calendar year, spanning from 2013 to 2022, stands at 3%, while in the second half, it surges to an impressive 17%. This consistent trend persisted in 2023, with a 3% return in the first half and a remarkable 20% return in the second half.
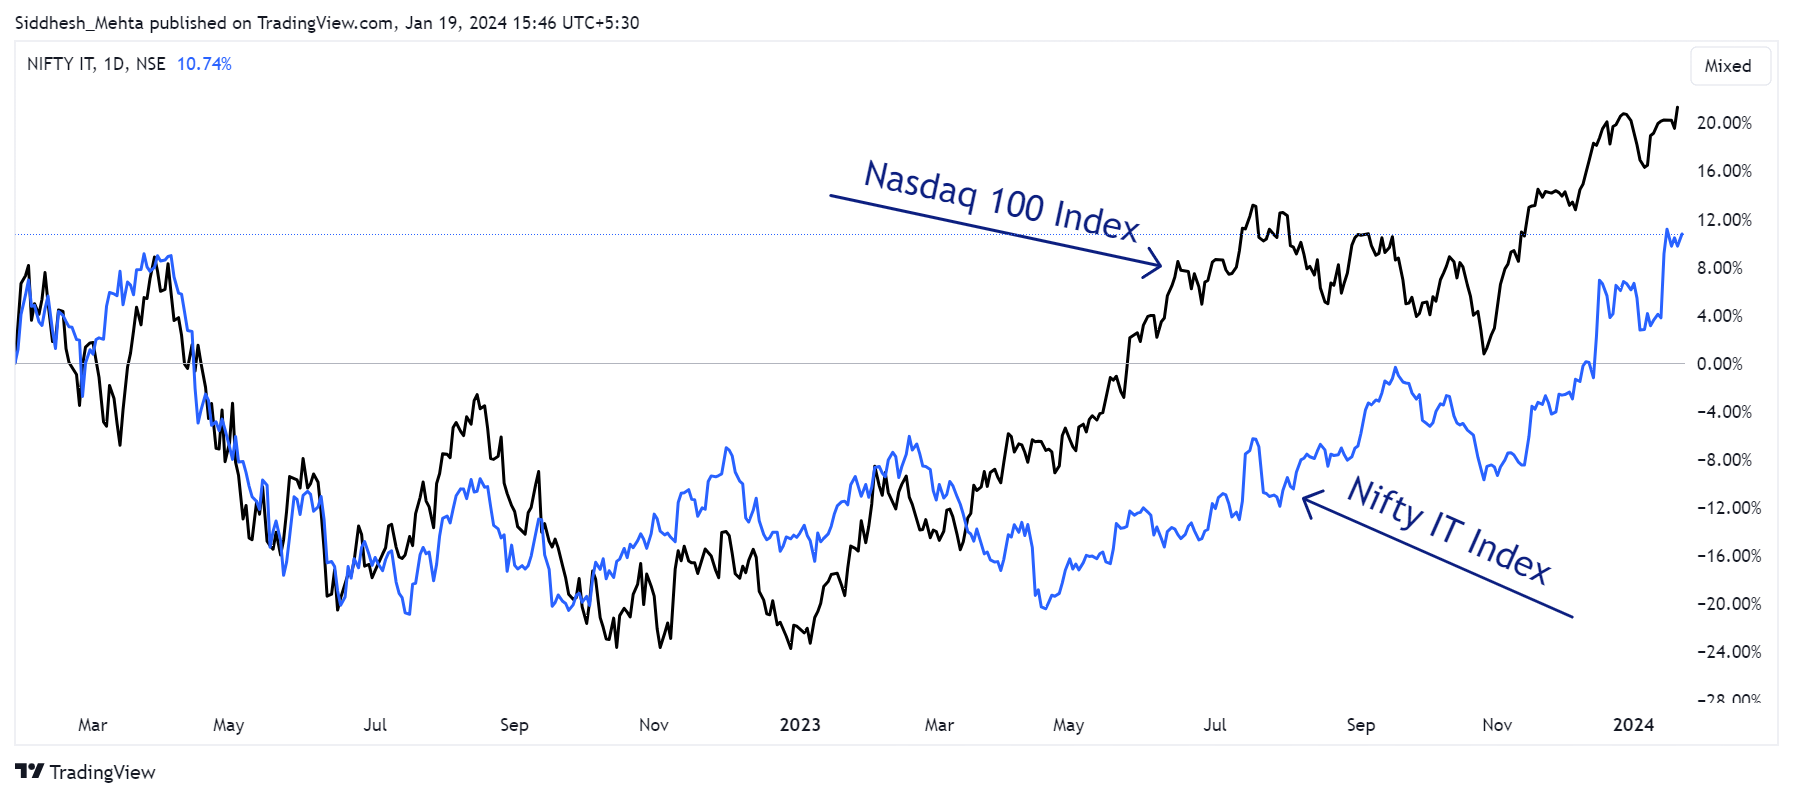
In our article, we also touched upon the correlation between the Nifty IT index and the Nasdaq 100 index, revealing a historical trend of a positive linear relationship between the two. The Nifty IT index which was underperforming the Nasdaq 100 index has gradually converged towards the Nasdaq 100 index. The accompanying chart illustrates the performance of the Nifty IT index and the Nasdaq 100 index up to the present moment.
However, global economic uncertainties have further intensified with two ongoing wars showing no signs of resolution. Additionally, the uncertainty over the future US interest rates still looms. To add insult to injury, the Red Sea crisis has resulted in cargo diversions leading to increased costs.
In this landscape, clients are currently prioritizing the enhancement of existing system efficiencies rather than embarking on new transformational projects. This restrained approach has resulted in less than dramatic topline performance of IT firms with new deals slowing down and firms keeping a sharp eye on headcount and fresh recruitment to secure the bottom line.
Further, the Nifty IT index is presently trading at a Price-to-Earnings (PE) ratio of nearly 31, signifying a notable premium compared to its 5-year average PE of 26.
Considering these factors, it is imperative for stakeholders to diligently track these developments and seize emerging opportunities. By doing so, they can make more informed and rational decisions that align with their financial goals and risk tolerance.
12th January, 2024
Remember This Before You Buy That High-Flying Penny Stock
2024 is anticipated to be a significant year globally with upcoming elections in many countries. The stage is set for noteworthy political developments and potential leadership changes. More than 60 countries including India, the USA, Germany, and the United Kingdom, are set to hold elections in 2024, suggesting prolonged volatility in the global financial markets.
Apart from this, leap years too have seen a lot of volatility. Statistics show that Indian markets face drawdowns of about 25% every 3.5 to 4 years. 2024 is a leap year and this pattern too adds up to the overall market volatility.
Current Euphoria in the markets is evident through the rapid and exponential surge in the share prices of several penny stocks.
Often these companies either lack transparency, a sustainable business model, or management integrity. These factors are overshadowed in a bull run and every company seems to have good prospects where everyone recommending such penny stock has a convincing story.
As a result, an investor ends up adding many such volatile and risky stocks to his/her portfolio without thinking about the position sizing, liquidity, and its influence on the entire portfolio.
An investor having a reasonable number of stocks with a proper position sizing would generate better results than the broader indices. Still many end up adding several penny stocks to their portfolio in such quantities which in no way influences the magnitude of returns but it increases their risk.
Here’s an example to drive this point. Below is an example of how impactful large concentrated bets can be. If a position with 20% allocation of your portfolio moves by 50% then it will add 10% to your portfolio. If a position with a 10% allocation of your portfolio moves by 50% then it will add 5% to your portfolio and so on.
| Large Concentrated Bets | |||
| Maximum No. of Stocks You can add in your portfolio | Allocation | Gains % | Impact |
| 5% | 20% | 50% | 10% |
| 10% | 10% | 50% | 5% |
| 20% | 5% | 50% | 3% |
On the other hand, if a stock holding 2% in your portfolio moves by 100% then it will add 2% to your portfolio and if a position with a 1% allocation moves by 100% then it will add only 1% to the overall portfolio.
| Small Diversified Bets | |||
| Number of stocks in your portfolio | Allocation | Gains % | Impact |
| 50% | 2% | 100% | 2.0% |
| 100% | 1% | 100% | 1.0% |
These days investors have been buying penny stocks in the hope of doubling their money quickly but they are missing out on this important point. Instead of increasing their returns, they are unintentionally taking more risks.
A renowned Professor from Princeton University Burton Markiel states that by the time the portfolio contains 20 equal-sized and well-diversified stocks, the total risk of the portfolio is reduced by 70% and any further addition of stocks doesn't contribute much to the risk reduction.
_1705063319.png)
It is visible that neither return is exponential (from the table) nor does it mitigate risk (from the chart) after a certain number of stocks.
Therefore, over-diversification through the addition of penny stocks with a lower proportion of holdings dilutes the impact of successful stocks. A portfolio stretched too thin diminishes the influence of winners resulting in less significant gains at the overall portfolio level.
Technical Outlook:
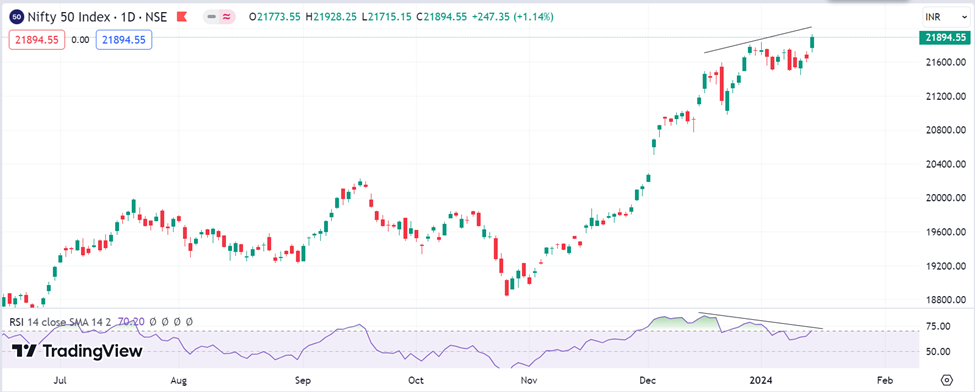
Nifty hit a fresh all-time high of 21,928 on 12th January, 2024. The Index had been consolidating in the 21,500-21,800-range since 28th December 2023. Nifty ended the week, gaining 184 points and closed at 21,895.
Despite the price making higher highs on the daily chart, the Relative Strength Index (RSI) has been moving in a lower high formation, resulting in a bearish divergence. Nifty has formed a hanging man candle on the weekly chart, which is usually considered as a sign of weakness. The put writers (bulls), however, dethroned the call writers (bears) from the maximum call open interest strike of 21,800, which acted as a strong resistance for Nifty. The resistance shifts to 22,500 level after Friday’s closing session.
The Foreign Portfolio Investors (FPIs) Long-Short ratio has been hovering between 60-70% since the start of January Series expiry. It will be interesting to see if Nifty can sustain above the 21,900 levels. A follow-up buying from the current level can push the Nifty beyond 22,000 levels. The level of 21,800, which acted as a resistance earlier, is expected to act as a support for Nifty.
 Easy & quick