

Introduction
Ever wondered how investors decide whether the market is overvalued or undervalued? The answer often lies in one powerful indicator - the Nifty PE Ratio.
The Price-to-Earnings (P/E) ratio is one of the most trusted tools in financial analysis, helping investors understand how much they’re paying for every rupee of a company’s earnings. When applied to the Nifty 50 index, it reflects the collective valuation of India’s top 50 companies - essentially capturing the pulse of the broader market.
Tracking the Nifty PE Ratio isn’t just about numbers; it’s about understanding market sentiment. A rising PE ratio often signals optimism and higher growth expectations, while a declining ratio can indicate caution or undervaluation. By keeping an eye on this metric, investors can make more informed decisions about when to enter, stay invested, or book profits in the market.
What Is the Nifty PE Ratio?
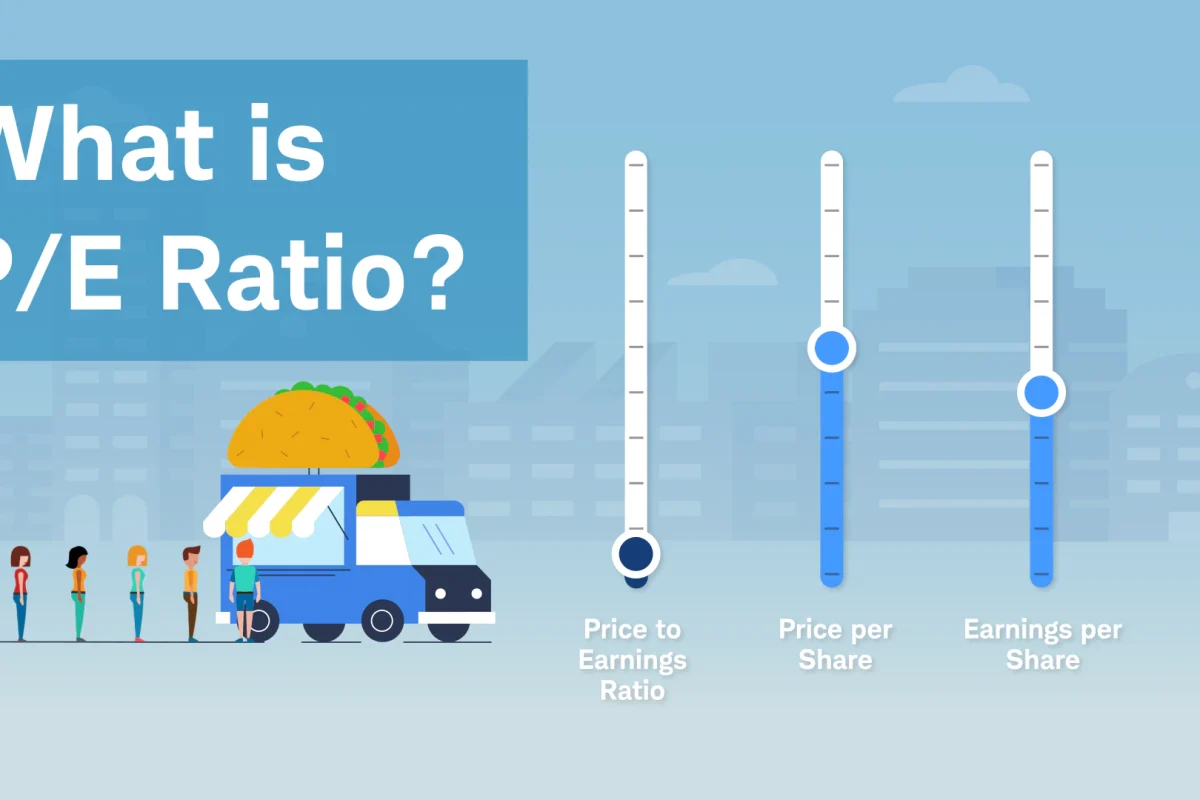
The Price-to-Earnings (PE) ratio is one of the most widely used metrics to understand how expensive or cheap a market or stock is. In simple terms, it tells you how much investors are willing to pay today for each rupee of a company’s earnings. It is calculated by dividing the market price by the earnings per share (EPS). When we talk about the Nifty PE Ratio, we are referring to the weighted average PE of all 50 companies that make up the Nifty 50 index. This means it doesn’t represent a single company’s valuation but rather the collective valuation of India’s largest and most actively traded companies. The Nifty PE serves as a snapshot of the overall market’s valuation and sentiment. A higher P/E generally suggests that investors expect strong earnings growth in the future, while a lower P/E could indicate pessimism or undervaluation. For instance, if the Nifty is trading at 22,000 and the average EPS of the index is ₹1,000, then the Nifty PE = 22,000 ÷ 1,000 = 22. This means investors are currently paying ₹22 for every ₹1 earned by Nifty 50 companies - a quick gauge of how richly the market is valued.
How Is the Nifty PE Ratio Calculated?
The Nifty PE Ratio is calculated to represent the overall valuation of India’s top 50 listed companies. It helps investors understand how the market collectively values earnings, based on the prices of these companies.
Step 1: Identify the 50 Nifty Stocks
The process starts with the Nifty 50 constituents - companies across key sectors like banking, IT, energy, and FMCG. These are reviewed semi-annually by NSE to ensure the index remains a true reflection of India’s equity market.
Step 2: Determine Each Company’s Market Capitalisation and Earnings
For every stock, calculate its free-float market capitalisation (share price × number of freely tradable shares). Then, take the company’s earnings for the last four quarters - also known as Trailing Twelve Months (TTM) earnings.
Step 3: Compute the Weighted Average PE
Each company’s PE ratio is weighted by its free-float market capitalisation. The Nifty PE Ratio is then calculated as:
Nifty PE=Total Free-Float Market Capitalisation of Nifty 50Total Earnings (TTM) of Nifty 50
This ensures that larger companies have a proportionately higher impact on the overall PE.
The NSE updates the official Nifty PE Ratio daily on its website, allowing investors to track real-time valuation trends.
It’s also important to distinguish between Trailing PE (based on past 12-month earnings) and Forward PE (based on projected future earnings). While trailing PE reflects historical performance, forward PE incorporates market expectations - helping investors assess whether current prices are justified by anticipated growth.
Why Is the Nifty PE Ratio Important?
The Nifty PE Ratio acts as one of the most reliable indicators of market valuation and sentiment. It helps investors gauge whether the market as a whole is trading at a premium, fair, or discounted level relative to its earnings. When the Nifty PE is high, it typically signals optimism and elevated valuations - suggesting that investors expect strong future earnings growth. Conversely, a low Nifty PE often indicates pessimism or undervaluation, where market participants are cautious or fearful about future growth prospects.
For professional investors such as mutual fund managers and foreign institutional investors (FIIs), the Nifty PE Ratio is a crucial input in assessing entry and exit points. When valuations appear stretched, they may rebalance portfolios toward debt or defensive sectors. Similarly, when the P/E ratio drops to historically attractive levels, it often signals long-term buying opportunities.
Retail investors also use the Nifty PE as a guide for systematic investment planning, investing more when valuations are low and scaling back when they are high.
Beyond timing, the Nifty PE ratio plays an important role in asset allocation strategies, helping investors decide how much to allocate between equities and other asset classes like bonds or gold. In essence, it serves as a compass for market valuation, sentiment, and long-term return expectations.
Historical Trends of the Nifty PE Ratio
Over the years, the Nifty PE Ratio has captured the ebb and flow of India’s market sentiment — from euphoric bull runs to deep corrections. Studying these historical trends helps investors recognize how valuation extremes often precede major market turning points.
Historically, the long-term median Nifty PE has hovered between 18x and 22x, marking a fair valuation zone for the Indian equity market. Deviations from this range have often signaled significant market events. For instance, during the 2008 global financial crisis, the Nifty PE had surged above 27x, reflecting excessive optimism just before markets crashed. Similarly, in March 2020, as COVID-19 triggered a sharp sell-off, the ratio plunged below 18x, indicating deep undervaluation and panic-driven sentiment.
However, the post-COVID recovery told a different story. Fueled by liquidity and earnings optimism, the Nifty PE briefly soared above 40x, one of the highest levels in Indian market history. Such elevated valuations suggested that prices had run far ahead of earnings — a warning signal for cautious investors.
Including a simple chart or table comparing Nifty PE levels across key events — like the 2008 crash, 2013 taper tantrum, 2017 bull run, 2020 COVID crash, and 2021 rebound — can make this section more insightful. It visually reinforces how extreme valuations tend to revert toward the historical average, helping investors contextualise today’s market levels.
How to Interpret the Nifty PE Ratio
The Nifty PE Ratio is a powerful valuation indicator — but it should be viewed as a guide, not a precise market timing tool. It helps investors understand whether the market is priced attractively or expensively relative to its earnings potential. However, valuations alone cannot predict short-term movements, as market behaviour is often influenced by emotions, liquidity, and global factors.
In general, investors use broad benchmarks to interpret the Nifty PE Ratio:
- Below 15: The market is considered undervalued, often signalling fear or excessive pessimism — a phase that has historically offered attractive long-term entry points.
- 15–22: The market is fairly valued, indicating balanced sentiment and stable growth expectations.
- Above 22: The market is overvalued, suggesting optimism and possibly stretched valuations that warrant caution.
However, these levels are not absolute. Macroeconomic factors like interest rates, inflation, and corporate earnings growth can significantly affect what constitutes a “fair” PE. For example, low interest rates and strong earnings growth can justify a higher PE ratio, while tightening liquidity or inflation can compress it.
A high PE doesn’t always mean the market will fall — it may simply reflect investor confidence in future growth. Similarly, a low PE doesn’t guarantee a rebound but may indicate temporary weakness. Understanding these nuances helps investors make more informed, long-term decisions rather than reacting to short-term fluctuations.
Limitations of the Nifty PE Ratio
While the Nifty PE Ratio is a useful indicator of market valuation, it’s not without its limitations. One of the biggest drawbacks is that it ignores future earnings growth. A high PE may not always signal overvaluation if the underlying companies are expected to deliver strong earnings growth, just as a low PE might not guarantee undervaluation if profits are declining.
The ratio also fails to capture sectoral differences within the Nifty 50. For instance, high-growth sectors like technology naturally trade at higher PEs compared to cyclical or capital-intensive sectors such as metals or utilities. Averaging these together can blur the true picture of valuation.
Additionally, earnings distortions caused by one-time profits, losses, or accounting adjustments can temporarily skew the ratio, making it appear higher or lower than reality.
Hence, the Nifty PE should never be viewed in isolation. It’s best used alongside other valuation metrics such as the Price-to-Book (PB) Ratio, Dividend Yield, and Earnings Per Share (EPS) growth. Combining these indicators provides a more holistic understanding of market conditions and helps avoid misinterpretation based solely on the P/E ratio.
How Investors Can Use the Nifty PE Ratio in Decision-Making
For investors, the Nifty PE Ratio serves as a practical compass to navigate market cycles and make informed investment decisions. A smart approach is to track the Nifty PE daily or weekly, as published by the NSE, to stay updated on how the market’s valuation is evolving.
Before investing, compare the current Nifty PE with its long-term average (typically around 18–22x). If the ratio is significantly above this range, it may suggest stretched valuations, prompting investors to proceed cautiously. Conversely, when the PE is near or below historical lows, it can signal attractive entry points for long-term investments.
However, investors should avoid timing the market solely based on PE levels. Instead, use the ratio to adjust exposure gradually — for instance, increasing equity allocation when valuations are low and reducing it when they’re high.
Combining PE insights with Systematic Investment Plans (SIPs) or asset allocation strategies ensures discipline and consistency. Samco’s research tools and market insights further empower investors to evaluate valuations effectively and align their portfolios with prevailing market conditions.
FAQs
What is a good Nifty PE ratio?
A Nifty PE between 18 and 22 is generally considered fair. Below 15 may indicate undervaluation, while above 22 could suggest overvaluation or heightened optimism.
How often is Nifty PE updated?
The NSE updates the Nifty PE Ratio daily on its official website, reflecting the latest price movements and earnings data.
What does a high PE ratio indicate?
A high PE signals that investors expect strong future earnings growth, though it can also mean the market is becoming expensive.
Can Nifty PE help predict a market crash?
Not precisely. A high PE often precedes corrections, but it shouldn’t be used as a timing tool — markets can stay overvalued for extended periods.
What is the difference between Nifty PE and individual stock PE?
The Nifty PE represents the weighted average valuation of all 50 index companies, while an individual stock PE reflects the valuation of a single company.
Conclusion
The Nifty PE Ratio remains one of the most insightful tools for assessing overall market valuation and sentiment. By tracking it regularly, investors can better understand whether the market is trading at attractive, fair, or stretched levels — helping them make more informed, long-term decisions.
However, it’s essential to remember that the Nifty PE is a guide, not a prediction tool. It works best when combined with other indicators, sound research, and disciplined investing strategies rather than being used for short-term market timing.
Stay updated with Samco’s Market Research insights and learn how to make data-driven investment decisions using valuation indicators like the Nifty PE Ratio to build a smarter, more resilient portfolio.


 Easy & quick
Leave A Comment?