In this article, we will discuss:
- Introduction
- Features and Benefits of Sovereign Gold Bond s (SGBs)
- How have Sovereign Gold Bond s performed in India?
- Steps to Buy Sovereign Gold Bonds Online Through Samco
- Conclusion
Introduction
Sovereign Gold Bonds (SGBs) are government securities denominated in grams of gold. They are issued by the Reserve Bank of India (RBI) on behalf of the Government of India. SGBs offer investors a way to invest in gold without having to buy or store physical gold. They also provide interest income and capital appreciation linked to the market price of gold.
SGBs were first launched in November 2015 as part of the government’s efforts to reduce the demand for physical gold and curb its imports. Since then, the RBI has issued several tranches of SGBs at different prices and tenors. The issue price of SGBs is based on the average closing price of gold of 999 purity published by the India Bullion and Jewellers Association Ltd (IBJA) for the last three working days of the week preceding the subscription period. The investors also get a discount of Rs 50 per gram if they apply online and pay digitally.
Features and Benefits of Sovereign Gold Bonds (SGBs)
- SGBs have an eight-year maturity period, allowing investors the flexibility to exit after the fifth year on interest payment dates.
- Investors can trade SGBs on stock exchanges (NSE and BSE) contingent upon market liquidity.
- The fixed interest rate on SGBs is 2.5% per annum, payable semi-annually.
- SGBs are regarded as a secure and convenient gold investment, mitigating risks and costs associated with physical gold, including theft, storage, making charges, and purity concerns.
- They offer tax benefits, with capital gains from the redemption or transfer of SGBs being exempt from income tax. However, interest income is taxable based on the investor’s tax slab.
- Evaluating SGB performance involves comparing their returns with physical gold and other investment options.
- SGB returns hinge on two factors: changes in the market price of gold and interest income.
- In contrast, returns on physical gold depend solely on fluctuations in the market price of gold.
- Returns on other investment options are contingent on their respective risk and return characteristics.
How have Sovereign Gold Bond s performed in India?
The table below shows the historical issue prices and returns of SGBs for the financial years 2015-16 to 2023-24, as of December 18, 2023. The returns are calculated assuming that the investors bought one gram of SGBs at the issue price and held them till maturity or till the date of calculation, whichever is earlier. The returns also include the interest income accrued till the date of calculation. The returns of physical gold are calculated assuming that the investors bought one gram of gold at the IBJA price on the first day of the subscription period and sold it at the IBJA price on the date of calculation. The returns of other investment options are based on the average annual returns of various asset classes for the same period.
| Financial Year | Series | Issue Price (Rs) | Current Price (Rs) | Return of SGBs (%) | Return of Physical Gold (%) | Return of Other Investment Options (%) |
| 2015-16 | I | 2684 | 5926 | 120.8 | 120.7 | Equity: 15.1; Debt: 8.7; FD: 7.3 |
| 2015-16 | II | 2600 | 5926 | 127.9 | 127.9 | Equity: 15.1; Debt: 8.7; FD: 7.3 |
| 2016-17 | I | 3119 | 5926 | 89.9 | 89.9 | Equity: 18.6; Debt: 10.5; FD: 7.1 |
| 2016-17 | II | 2901 | 5926 | 104.3 | 104.2 | Equity: 18.6; Debt: 10.5; FD: 7.1 |
| 2016-17 | III | 2980 | 5926 | 98.8 | 98.8 | Equity: 18.6; Debt: 10.5; FD: 7.1 |
| 2016-17 | IV | 2893 | 5926 | 104.7 | 104.6 | Equity: 18.6; Debt: 10.5; FD: 7.1 |
| 2017-18 | I | 2795 | 5926 | 111.9 | 111.8 | Equity: 10.2; Debt: 6.7; FD: 6.7 |
| 2017-18 | II | 2908 | 5926 | 103.6 | 103.6 | Equity: 10.2; Debt: 6.7; FD: 6.7 |
| 2017-18 | III | 2943 | 5926 | 101.3 | 101.3 | Equity: 10.2; Debt: 6.7; FD: 6.7 |
| 2017-18 | IV | 2931 | 5926 | 101.9 | 101.9 | Equity: 10.2; Debt: 6.7; FD: 6.7 |
| 2017-18 | V | 2901 | 5926 | 104.3 | 104.2 | Equity: 10.2; Debt: 6.7; FD: 6.7 |
| 2017-18 | VI | 2862 | 5926 | 107.1 | 107 | Equity: 10.2; Debt: 6.7; FD: 6.7 |
| 2018-19 | I | 3194 | 5926 | 85.5 | 85.5 | Equity: 14.9; Debt: 8.6; FD: 6.8 |
| 2018-19 | II | 3183 | 5926 | 86.1 | 86.1 | Equity: 14.9; Debt: 8.6; FD: 6.8 |
| 2018-19 | III | 3150 | 5926 | 88.1 | 88.1 | Equity: 14.9; Debt: 8.6; FD: 6.8 |
| 2018-19 | IV | 3267 | 5926 | 81.3 | 81.3 | Equity: 14.9; Debt: 8.6; FD: 6.8 |
| 2018-19 | V | 3269 | 5926 | 81.2 | 81.2 | Equity: 14.9; Debt: 8.6; FD: 6.8 |
| 2018-19 | VI | 3269 | 5926 | 81.2 | 81.2 | Equity: 14.9; Debt: 8.6; FD: 6.8 |
| 2018-19 | VII | 3214 | 5926 | 84.3 | 84.3 | Equity: 14.9; Debt: 8.6; FD: 6.8 |
| 2018-19 | VIII | 3196 | 5926 | 85.4 | 85.4 | Equity: 14.9; Debt: 8.6; FD: 6.8 |
| 2018-19 | IX | 3220 | 5926 | 84 | 84 | Equity: 14.9; Debt: 8.6; FD: 6.8 |
| 2018-19 | X | 3267 | 5926 | 81.3 | 81.3 | Equity: 14.9; Debt: 8.6; FD: 6.8 |
| 2019-20 | I | 3428 | 5926 | 72.9 | 72.9 | Equity: 4.0; Debt: 11.5; FD: 6.5 |
| 2019-20 | II | 3488 | 5926 | 69.9 | 69.9 | Equity: 4.0; Debt: 11.5; FD: 6.5 |
| 2019-20 | III | 3566 | 5926 | 66.2 | 66.2 | Equity: 4. |
| 2019-20 | IV | 3625 | 5926 | 63.4 | 63.4 | Equity: 4.0; Debt: 11.5; FD: 6.5 |
| 2019-20 | V | 3757 | 5926 | 57.7 | 57.7 | Equity: 4.0; Debt: 11.5; FD: 6.5 |
| 2019-20 | VI | 3820 | 5926 | 55.1 | 55.1 | Equity: 4.0; Debt: 11.5; FD: 6.5 |
| 2019-20 | VII | 4099 | 5926 | 44.6 | 44.6 | Equity: 4.0; Debt: 11.5; FD: 6.5 |
| 2019-20 | VIII | 4267 | 5926 | 38.9 | 38.9 | Equity: 4.0; Debt: 11.5; FD: 6.5 |
| 2019-20 | IX | 4350 | 5926 | 36.2 | 36.2 | Equity: 4.0; Debt: 11.5; FD: 6.5 |
| 2019-20 | X | 4420 | 5926 | 34 | 34 | Equity: 4.0; Debt: 11.5; FD: 6.5 |
| 2019-20 | XI | 4570 | 5926 | 29.6 | 29.6 | Equity: 4.0; Debt: 11.5; FD: 6.5 |
| 2019-20 | XII | 4620 | 5926 | 28.3 | 28.3 | Equity: 4.0; Debt: 11.5; FD: 6.5 |
| 2020-21 | I | 4670 | 5926 | 26.9 | 26.9 | Equity: 66.1; Debt: 13.5; FD: 5.4 |
| 2020-21 | II | 4820 | 5926 | 22.9 | 22.9 | Equity: 66.1; Debt: 13.5; FD: 5.4 |
| 2020-21 | III | 4892 | 5926 | 21.1 | 21.1 | Equity: 66.1; Debt: 13.5; FD: 5.4 |
| 2020-21 | IV | 5049 | 5926 | 17.4 | 17.4 | Equity: 66.1; Debt: 13.5; FD: 5.4 |
| 2020-21 | V | 5117 | 5926 | 15.8 | 15.8 | Equity: 66.1; Debt: 13.5; FD: 5.4 |
| 2020-21 | VI | 5300 | 5926 | 11.8 | 11.8 | Equity: 66.1; Debt: 13.5; FD: 5.4 |
| 2020-21 | VII | 5400 | 5926 | 9.7 | 9.7 | Equity: 66.1; Debt: 13.5; FD: 5.4 |
| 2020-21 | VIII | 5550 | 5926 | 6.8 | 6.8 | Equity: 66.1; Debt: 13.5; FD: 5.4 |
| 2020-21 | IX | 5689 | 5926 | 4.2 | 4.2 | Equity: 66.1; Debt: 13.5; FD: 5.4 |
| 2020-21 | X | 5817 | 5926 | 1.9 | 1.9 | Equity: 66.1; Debt: 13.5; FD: 5.4 |
| 2020-21 | XI | 5893 | 5926 | 0.6 | 0.6 | Equity: 66.1; Debt: 13.5; FD: 5.4 |
| 2020-21 | XII | 5943 | 5926 | -0.3 | -0.3 | Equity: 66.1; Debt: 13.5; FD: 5.4 |
| 2021-22 | I | 5988 | 5926 | -1 | -1 | Equity: 23.4; Debt: 12.1; FD: 5.1 |
| 2021-22 | II | 6093 | 5926 | -2.7 | -2.7 | Equity: 23.4; Debt: 12.1; FD: 5.1 |
| 2021-22 | III | 6149 | 5926 | -3.6 | -3.6 | Equity: 23.4; Debt: 12.1; FD: 5.1 |
| 2021-22 | IV | 6213 | 5926 | -4.6 | -4.6 | Equity: 23.4; Debt: 12.1; FD: 5.1 |
| 2021-22 | V | 6300 | 5926 | -5.9 | -5.9 | Equity: 23.4; Debt: 12.1; FD: 5.1 |
| 2021-22 | VI | 6393 | 5926 | -7.3 | -7.3 | Equity: 23.4; Debt: 12.1; FD: 5.1 |
| 2021-22 | VII | 6453 | 5926 | -8.2 | -8.2 | Equity: 23.4; Debt: 12.1; FD: 5.1 |
| 2021-22 | VIII | 6549 | 5926 | -9.5 | -9.5 | Equity: 23.4; Debt: 12.1; FD: 5.1 |
| 2021-22 | IX | 6627 | 5926 | -10.6 | -10.6 | Equity: 23.4; Debt: 12.1; FD: 5.1 |
| 2021-22 | X | 6700 | 5926 | -11.6 | -11.6 | Equity: 23.4; Debt: 12.1; FD: 5.1 |
| 2021-22 | XI | 6777 | 5926 | -12.6 | -12.6 | Equity: 23.4; Debt: 12.1; FD: 5.1 |
| 2021-22 | XII | 6850 | 5926 | -13.5 | -13.5 | Equity: 23.4; Debt: 12.1; FD: 5.1 |
| 2022-23 | I | 6927 | 5926 | -14.5 | -14.5 | Equity: 15.7; Debt: 9.8; FD: 5.0 |
| 2022-23 | II | 7000 | 5926 | -15.3 | -15.3 | Equity: 15.7; Debt: 9.8; FD: 5.0 |
| 2022-23 | III | 7077 | 5926 | -16.3 | -16.3 | Equity: 15.7; Debt: 9.8; FD: 5.0 |
Steps to Buy Sovereign Gold Bonds Online Through Samco
Step 1. Access Samco Star Platform

Begin by accessing the Samco Star platform. Head to Samco Star and log in to your account.
Step 2: Navigate to the Investment Section and Select SGBs
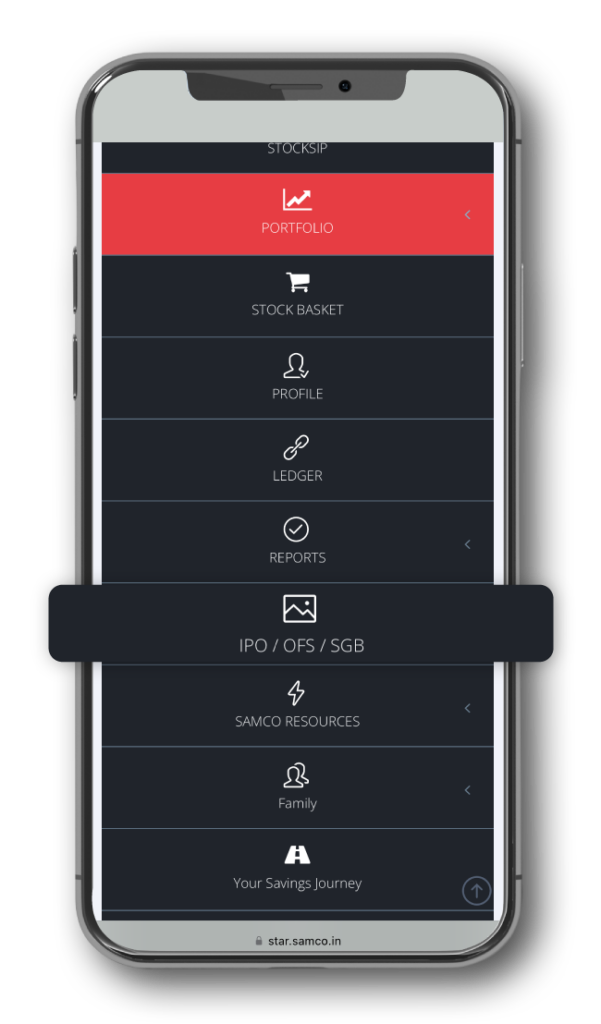
Move to the Investment Section. Locate the “IPO/ OFS/ SGB” tab situated in the main menu of the platform. Within the options available, click on the one specifically related to Sovereign Gold Bonds to proceed.
Step 3: Apply for the SGB
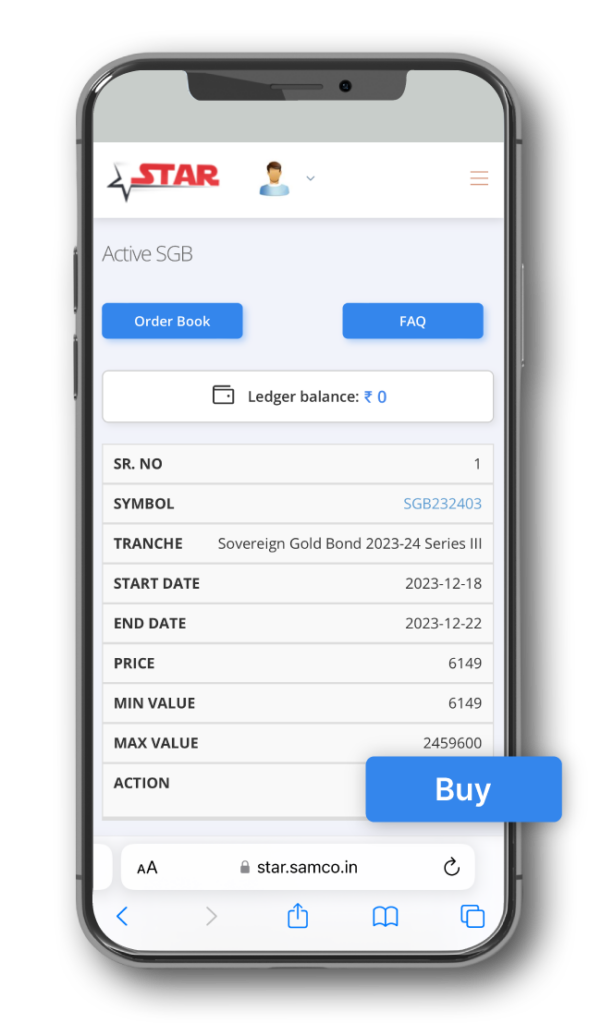
Having selected your preferred sovereign gold bonds, click on the ‘Buy’ button. This initiates the application process for the chosen offering.
Step 4: Add Quantity
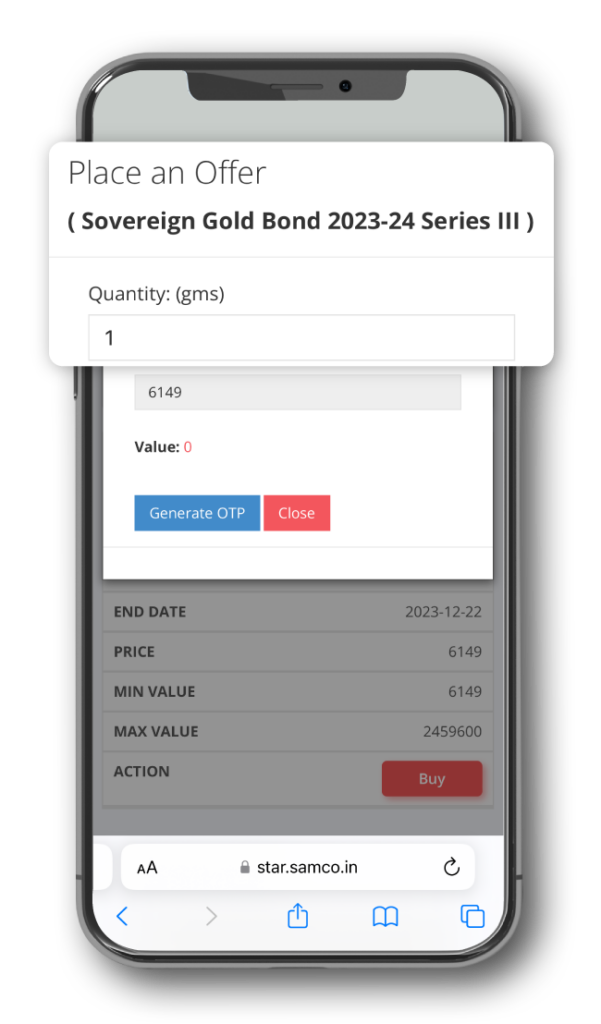
Enter the preferred quantity for purchasing.
Step 5: Generate and Submit OTP
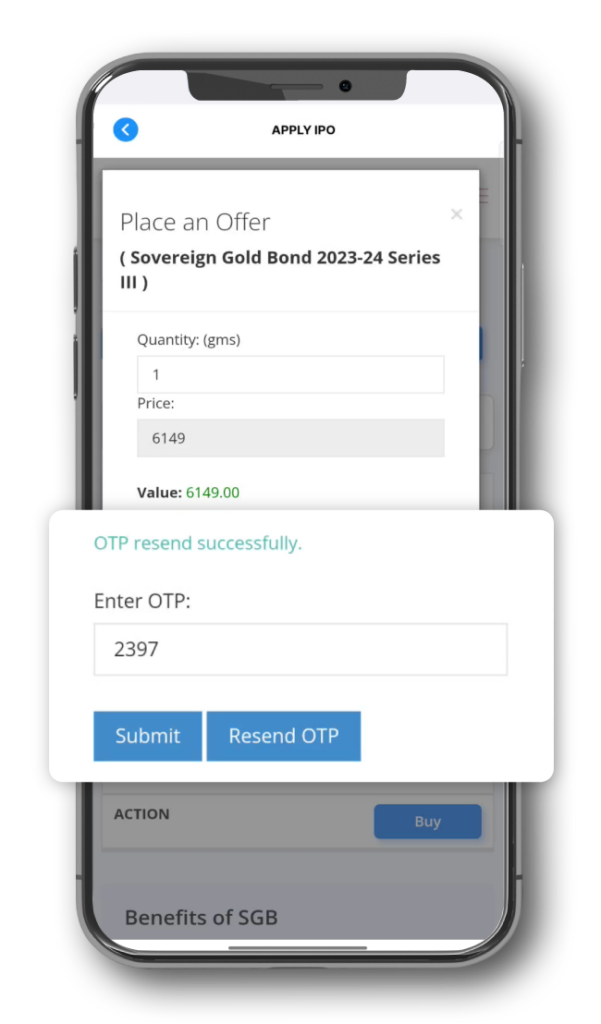
Security is a priority, and Samco ensures a secure transaction. To proceed, you’ll need to generate a One-Time Password (OTP). Click on the ‘Generate OTP’ option. The OTP is sent to your registered mobile number. Enter the OTP in the designated space and submit. This additional layer of authentication safeguards your transaction.
Step 6: Confirmation and Success
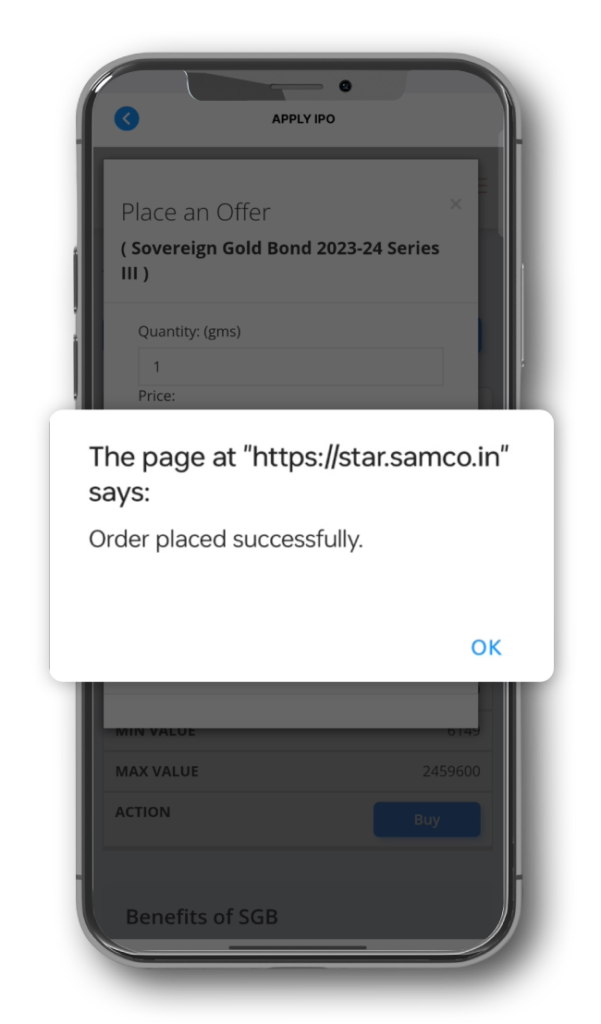
With the OTP submitted, your order is ready for processing. Samco’s user-friendly interface ensures a seamless experience. Once submitted, you’ll receive a confirmation message indicating that your order has been placed successfully.
Conclusion
Sovereign Gold Bonds are an attractive investment option for those who want to invest in gold without the hassles of physical gold. They offer several benefits such as safety, convenience, interest income, capital appreciation, and tax exemption. However, they also have some drawbacks such as price volatility, liquidity risk, lock-in period, and opportunity cost.
The historical performance analysis of SGBs shows that they have delivered impressive returns in the past, especially in the initial years of their launch. However, in the recent years, their returns have declined due to the fall in the market price of gold. Moreover, they have underperformed other investment options such as equity and debt in terms of risk-adjusted returns.
Therefore, investors should consider their risk appetite, time horizon, and financial goals before investing in SGBs. They should also diversify their portfolio across different asset classes to reduce the overall risk and enhance the returns. SGBs can be a part of the portfolio, but not the whole portfolio.
Disclaimer: INVESTMENT IN SECURITIES MARKET ARE SUBJECT TO MARKET RISKS, READ ALL THE RELATED DOCUMENTS CAREFULLY BEFORE INVESTING. The asset classes and securities quoted in the film are exemplary and are not recommendatory. SAMCO Securities Limited (Formerly known as Samruddhi Stock Brokers Limited): BSE: 935 | NSE: 12135 | MSEI- 31600 | SEBI Reg. No.: INZ000002535 | AMFI Reg. No. 120121 | Depository Participant: CDSL: IN-DP-CDSL-443-2008 CIN No.: U67120MH2004PLC146183 | SAMCO Commodities Limited (Formerly known as Samruddhi Tradecom India Limited) | MCX- 55190 | SEBI Reg. No.: INZ000013932 Registered Address: Samco Securities Limited, 1004 – A, 10th Floor, Naman Midtown – A Wing, Senapati Bapat Marg, Prabhadevi, Mumbai – 400 013, Maharashtra, India. For any complaints Email – grievances@samco.in Research Analysts -SEBI Reg.No.-INHO0O0005847