


January has traditionally been a challenging month for Indian equity markets, particularly for the Nifty 50 index. Historical data over multiple decades shows a clear seasonal pattern where January often delivers muted or negative returns. However, prolonged periods of weakness have, in the past, been followed by strong rebounds—raising an important question for investors as 2026 approaches: Is the market setting up for a seasonal turnaround?
January Performance of Nifty 50: A Historical Overview
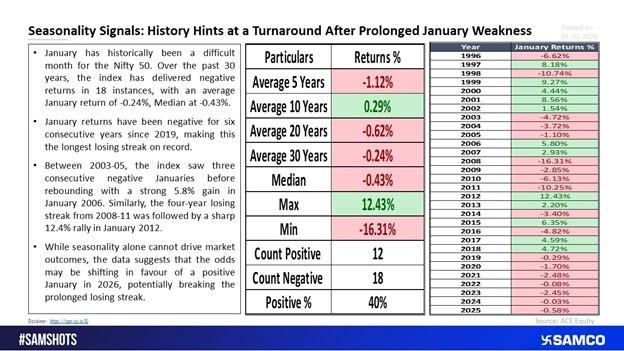
Over the last 30 years, January has produced negative returns in 18 instances, making it one of the weakest months on a seasonal basis for the Nifty 50. During this period:
- Average January return: -0.24%
- Median January return: -0.43%
- Negative outcomes: 60% of the time
These figures highlight that January weakness is not an anomaly but a recurring trend in Indian equities.
A Record-Breaking Losing Streak Since 2019
What makes the current cycle particularly noteworthy is the six consecutive years of negative January returns since 2019, marking the longest losing streak on record for the month. This prolonged underperformance stands out even when compared to earlier weak phases.
For perspective:
- 2003–2005: Three consecutive negative Januaries, followed by a strong 5.8% rebound in January 2006
- 2008–2011: Four-year losing streak, followed by a sharp 12.4% rally in January 2012
In both cases, extended pessimism eventually gave way to above-average gains.
Do Extreme Streaks Signal a Reversal?
Market history suggests that extreme seasonal pessimism often precedes mean reversion. When negative streaks stretch well beyond historical averages, the probability of a reversal tends to increase. While seasonality alone cannot dictate market direction, it provides valuable context, especially when combined with improving macro conditions, valuation comfort, or policy support.
Statistically, despite a higher count of negative January outcomes, periods following extended weakness have delivered outsized positive returns, indicating that markets may already be pricing in pessimism.
What This Means for January 2026?
As markets head into 2026, the data indicates that odds may be gradually shifting in favour of a positive January, potentially breaking the long-standing losing streak. Investors should note, however, that:
- Seasonality is a supporting indicator, not a standalone signal
- Market outcomes depend on multiple variables including global liquidity, interest rates, earnings growth, and geopolitical stability
That said, from a historical and probabilistic standpoint, the current setup appears more favourable than in recent years.
Key Takeaways for Investors
- January has historically been weak, but prolonged losing streaks often precede rebounds
- The current six-year negative streak is unprecedented, increasing the chances of mean reversion
- While not guaranteed, historical patterns suggest improving odds for a positive January in 2026
- A balanced approach—combining seasonality with fundamentals and technicals—remains crucial
Conclusion
Markets rarely move in straight lines. While January’s seasonal weakness is well documented, history shows that extended negative phases often sow the seeds for recovery. As 2026 approaches, investors would do well to stay vigilant, data-driven, and prepared for potential shifts in market sentiment. Whether the upcoming January marks a turnaround or merely a pause will unfold with time—but history suggests the risk-reward equation may be improving.


 Easy & quick
Leave A Comment?