
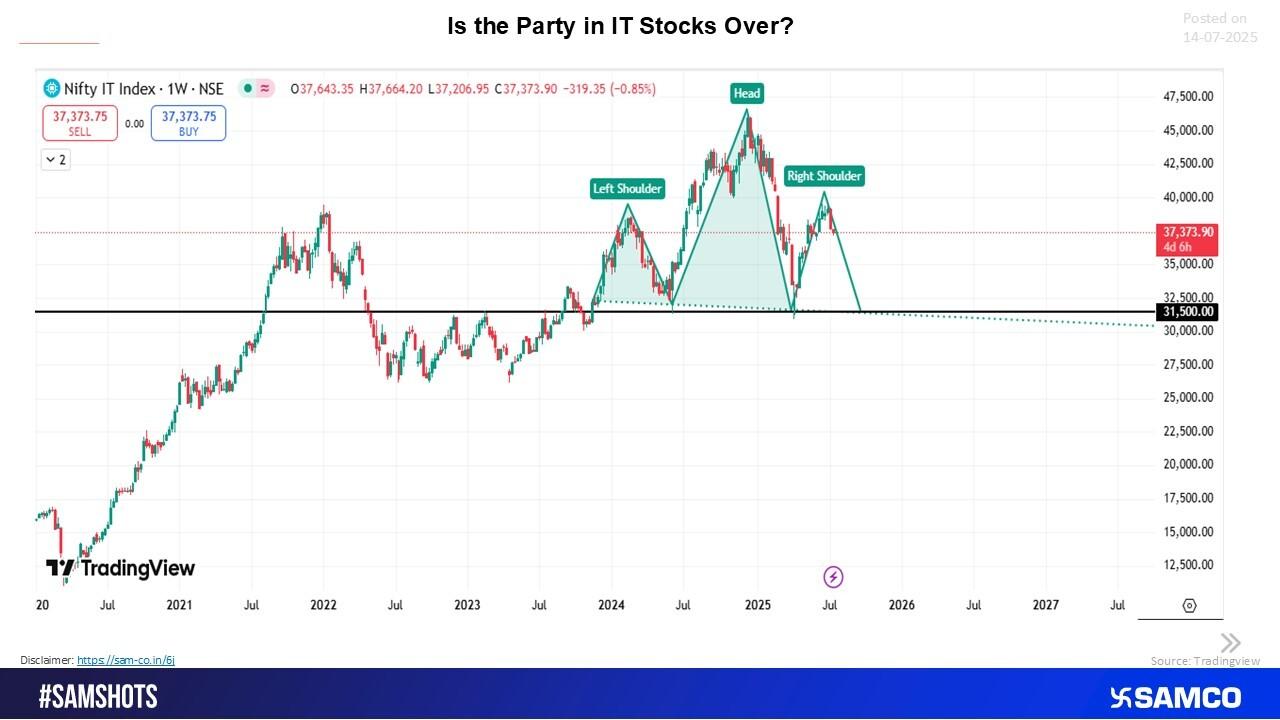
The Nifty IT index—a bellwether for India's technology sector—may be at a critical turning point. After a multi-year rally, the index is now forming a classic "Head and Shoulders" pattern, a widely respected technical indicator that often signals the end of a bullish trend.
As the right shoulder begins to form, technical analysts are paying close attention to the neckline around 31,500, which has historically acted as a strong support level. A breakdown below this level could trigger a much deeper correction in IT stocks.
Understanding the Pattern: What Is a Head & Shoulders Formation?
A Head and Shoulders (H&S) pattern consists of three peaks:
- Left Shoulder: The first rally was followed by a decline
- Head: A higher peak that shows bullish strength
- Right Shoulder: A lower high, indicating waning momentum
The neckline connects the low points between the shoulders and the head. When the price breaks below this support line, it typically confirms a trend reversal and often leads to a sharp decline.
Currently, the Nifty IT index is hovering near 37,373, but the chart suggests that if 31,500 breaks, we could see levels as low as 30,000–31,000 in the coming weeks.
Global Headwinds Compound the Risk
This technical pattern isn't forming in isolation. Global pressures are mounting:
- US Tech Tariffs: Rising protectionism and import duties on tech equipment could squeeze margins for Indian IT exporters.
- Macro Weakness: Weak demand from key markets like the US and Europe is starting to show in Q1FY26 earnings reports.
- Hiring Freeze & Margin Pressure: Big IT players have signaled caution in hiring and project budgets, adding to the bearish undertone.
Together, these fundamental issues validate the bearish structure being formed on the charts.
What Should Investors Do?
While this is not a call to panic, prudence is advised. If you're heavily allocated to IT stocks, especially those that have underperformed in recent quarters, consider these strategies:
- Tighten stop-losses: Especially near key support levels.
- Monitor earnings: Q1FY26 results will provide further clues.
- Stay diversified: Avoid sector-heavy portfolios.
- Wait for confirmation: A neckline breakdown is crucial before making aggressive bearish bets.
What If the Neckline Breaks?
If the 31,500 support breaks convincingly, history and technical theory suggest the downside can be significant. In past cycles, similar H&S patterns have led to declines of 15–20% from the neckline, which could drag Nifty IT down to 30,000 or lower.
This is not guaranteed, but it underscores the importance of staying alert and watching volume and confirmation before reacting.
Final Thoughts
The rally in IT stocks may not be done yet, but the momentum is clearly fading as the market prepares to pull the plug.
The Head and Shoulders pattern on the Nifty IT index is not just a chart shape; it reflects deeper underlying trends: slowing growth, margin pressures, and macro uncertainty.
Investors would do well to respect the signals, remain data-driven, and adjust their positions based on upcoming earnings and price action near the critical 31,500 zone.


 Easy & quick
Leave A Comment?