
Periods of extreme market fear often create unexpected opportunities for disciplined investors. A long-term analysis of India VIX spikes—specifically those exceeding 60% on the Rate of Change (ROC) indicator—over the past 15 years reveals a consistent contrarian pattern in the Nifty 50.
Historical data suggests that sharp volatility spikes, while initially unsettling, have frequently been followed by strong short-term rebounds in the stock market.
How Extreme VIX Spikes Impact the Nifty 50?
When the India VIX surges dramatically, it reflects intense fear and uncertainty among investors. Such spikes typically occur during global shocks, macroeconomic stress, or sudden geopolitical developments.
However, the data indicates that these panic-driven moves often mark exhaustion of selling pressure, creating potential entry opportunities for investors who can tolerate short-term volatility.
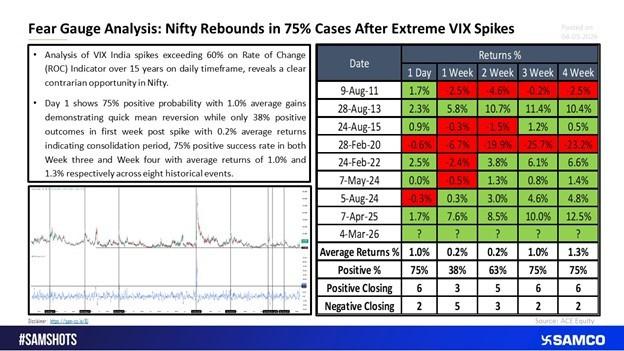
Across eight historical instances of extreme VIX spikes:
- Day 1: Markets delivered a 75% probability of positive returns with an average gain of around 1%.
- Week 1: Returns weakened, with only 38% positive outcomes and an average return of 0.2%, indicating ongoing volatility and consolidation.
This phase often represents the “shakeout period”, where weaker hands exit positions while the market absorbs the shock.
The Turning Point: Weeks Two to Four
Historical performance becomes more favorable as markets move beyond the initial volatility phase.
- Week 2: Positive returns increased to 63% probability.
- Week 3: Success rates climbed further to 75% with improving returns.
- Week 4: Average gains reached around 1.3%, maintaining a 75% probability of positive outcomes.
This pattern suggests that while short-term uncertainty remains high, the probability of recovery improves significantly after the first week.
A Real Example: April 2025 VIX Spike
A notable example occurred in April 2025, when a sharp volatility spike was followed by a strong 12.5% gain in the Nifty over four weeks. The move perfectly illustrated how extreme fear can create powerful rebound setups once selling pressure subsides.
The COVID-19 Exception
One major outlier in the dataset is the COVID-19 market crash in February 2020. During this unprecedented global crisis, markets recorded a -23.2% decline over four weeks, highlighting how rare “black swan” events can disrupt historical patterns.
However, excluding this extraordinary event, the historical data shows remarkable consistency in market recovery following extreme VIX spikes.
What the March 2026 VIX Spike Means for Investors?
The recent March 2026 surge in India VIX reflects heightened geopolitical and macroeconomic uncertainty. Yet history suggests that such spikes often mark peak fear rather than the start of prolonged declines.
For investors with patience and disciplined risk management, these conditions may offer contrarian opportunities with a three-to-four week investment horizon.
Key Takeaway
Extreme volatility spikes rarely last forever. While the first week after a VIX surge tends to remain unstable, historical data indicates that markets frequently stabilize and rebound in the following weeks.
Investors who stay disciplined, manage risk carefully, and maintain a medium-term perspective may benefit from these fear-driven market dislocations.


 Easy & quick
Leave A Comment?