

What is the Full Form of ONGC? ONGC Full Form :
The full form of ONGC is Oil and Natural Gas Corporation. It is the largest crude oil and natural gas company in India. It contributes to around 71% of India’s total crude oil production. It is one of the seven maharatnas of Indian CPSE. 
History of ONGC
- 1955 – The department of Oil and Natural Gas was established under the Ministry of Natural Resources to improve the country’s oil and natural gas sector.
- 1956 – ONGC was restructured as a limited enterprise under the companies act.
- 1994 – ONGC became a public sector company and was renamed to Oil and Natural Gas Corporation (ONGC).
- 1997 – ONGC was recognised as a Navratna by the Government of India.
- 2002-03 ONGC Videsh Ltd. was formed as ONGC’s overseas subsidiary.
- 2010 – ONGC was conferred with Maharatna of Indian CPSE.
- In 2019-20 – ONGC was listed as India’s largest profit-making PSU.
ONGC LOGO
Key Personnel at ONGC
- Mr. Subhash Kumar – Chairman & Managing Director
- Dr Alka Mittal – Director (HR)
- Mr. Rajesh Kumar Srivastava – Director (Exploration)
- Mr. Anurag Sharma – Director (Onshore)
- Mr. Om Prakash Singh – Director (T&FS)
ONGC – Subsidiaries
- HPCL: Hindustan Petroleum Corporation Ltd.
- MRPL: Mangalore Refinery and Petrochemicals Ltd.
- ONGC Videsh limited
- Petronet MHB Ltd
ONGC – Joint Ventures
- OTPC – ONGC Tripura Power Company Limited
- OPaL – ONGC Petro-additions Limited
- MSEZ – Mangalore Special Economic Zone Limited
- OMPL – ONGC Mangalore Petrochemicals Limited
- DSL – Dahej SEZ Limited
- OTBL – ONGC TERI Biotech Limited
ONGC Products
- Natural Gas
- Crude Oil
- Motor Spirit
- Superior Kerosene Oil
- Aromatic Rich Naptha
- LPG (Liquefied Petroleum Gas)
- HSD (High-Speed Diesel)
- Ethane.
Latest Shareholding Pattern (%) of ONGC (As on 9th September 2021)
| Mar 2020 | Jun 2020 | Sep 2020 | Dec 2020 | Mar 2021 | |
| Promoters | 60.41% | 60.41% | 60.41% | 60.41% | 60.41% |
| FIIs | 7.62% | 8.10% | 7.69% | 7.67% | 8.08% |
| DIIs | 17.87% | 17.37% | 17.54% | 17.71% | 17.48% |
| Public | 14.10% | 14.13% | 14.36% | 14.21% | 14.03% |
Latest Profit and Loss Account of ONGC (As on 9th September 2021)
| Mar 2018 | Mar 2019 | Mar 2020 | TTM | |
| Sales | 322,706 | 421,624 | 396,753 | 3,03,958 |
| Expenses | 265,817 | 346,826 | 344,627 | 2,54,492 |
| Operating Profit | 56,889 | 74,797 | 52,125 | 49,466 |
| OPM | 18 | 18 | 13 | 16 |
| Other Income | 10,429 | 9,589 | 577 | 11,261 |
| Interest | 4,999 | 5,837 | 7,000 | 5,079 |
| Depreciation | 23,112 | 23,704 | 26,635 | 25,538 |
| Profit before tax | 39,208 | 54,846 | 19,068 | 30,110 |
| Tax | 34 | 38 | 39 | 29 |
| Net Profit | 22,106 | 30,546 | 10,907 | 16,249 |
[Read More: How to Read an Income Statement of a Company]
Latest Balance Sheet of ONGC (As on 9th September 2021)
| Mar 2019 | Mar 2020 | Mar 2021 | |
| Share Capital | 6,290 | 6,290 | 6,290 |
| Reserves | 210,644 | 200,678 | 2,14,691 |
| Borrowings | 107,742 | 128,693 | 1,33,187 |
| Other Liabilities | 167,667 | 166,585 | 1,87,518 |
| Total Liabilities | 492,343 | 502,246 | 5,41,686 |
| Fixed Assets | 86,011 | 103,848 | 1,04,466 |
| Cwip | 69,056 | 83,832 | 1,00,332 |
| Investments | 66,909 | 50,640 | 60,022 |
| Other Assets | 270,367 | 263,926 | 2,76,867 |
| Total Assets | 492,343 | 502,246 | 5,41,686 |
| Inventories | 35,949 | 34,065 | 45,689 |
| Trade Receivables | 15,396 | 9,173 | 16,016 |
| Cash & Bank | 4,820 | 5,704 | 7,192 |
| Loans and Advances | 29,258 | 30,114 | 22,679 |
| Trade Payables | 30,557 | 22,968 | 27,449 |
[Read More: How to Read a Balance Sheet of a Company]
Latest Key Financial Ratios of ONGC (As on 9th September 2021)
| Market Cap (Cr): 1,49,642 | Face Value (₹): 5 | EPS (₹): 17.69 |
| Book Value (₹): 176 | Roce (%): 9.95 | Debt to Equity: 0.62 |
| Stock P/E: 7.19 | ROE (%): 7.39 | Dividend Yield (%): 2.95 |
| Revenue (Cr): 3,60,048 | Earnings (Cr): 41,441 | Cash (Cr): 7,192 |
| Total Debt (Cr): 1,33,187 | Promoter’s Holdings (%): 60.41 |
Latest Mutual Funds Holdings & Trends of ONGC
| Schemes | Quantity | As on |
| CPSE ETF | 281,266 | 31-08-2021 |
| HDFC TOP 100 FUND – REGULAR PLAN – GROWTH | 13,750 | 31-08-2021 |
| HDFC FLEXICAP FUND – GROWTH OPTION | 11,601 | 31-08-2021 |
| ADITYA BIRLA SUN LIFE FRONTLINE EQUITY FUND – GROWTH | 6,108 | 31-08-2021 |
| NIPPON INDIA ARBITRAGE FUND – GROWTH | 4,818 | 31-08-2021 |
| SBI CONTRA FUND – REGULAR PLAN – IDCW REINVESTMENT | 3,618 | 31-08-2021 |
| SBI LONG TERM EQUITY FUND – IDCW PAYOUT | 3,509 | 31-08-2021 |
| UTI DIVIDEND YIELD FUND – GROWTH OPTION | 3,364 | 31-08-2021 |
| AXIS QUANT FUND REGULAR GROWTH | 3,265 | 31-08-2021 |
| KOTAK EQUITY ARBITRAGE FUND – REGULAR PLAN – GROWTH | 3,119 | 31-08-2021 |
Valuation Analysis of ONGC (As on 9th September 2021)
Valuation analysis helps you analyse how overvalued or undervalued a stock is using the margin of safety index. Watch this video to know how to find undervalued stocks in the market. It is the difference between the intrinsic value and the current value of a share. Intrinsic value is the true value of a share.
From the investor’s perspective –
If the market price is significantly lower than the stock’s intrinsic value, the stock has a high margin of safety. It is a buy signal.
From a seller’s point of view –
If the market price is significantly higher than the intrinsic value, it is a short sell opportunity. ONGC has a high margin of safety. 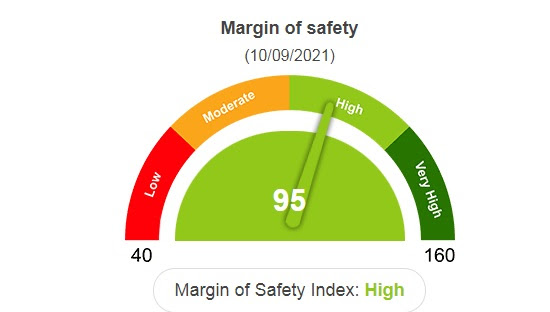
Latest Samco Stock Ratings of ONGC : 2 out of 5 Stars (As on 9th September 2021)
PROS
- Great Cash Conversion of Profits: ONGC has a great cash conversion ratio. It converts 77.73% of its operating earnings into operating cash flow. This implies a great working capital cycle and large cash flows for either funding growth or dividends. This will have a positive impact on shareholder returns.
CONS
- Low Sustainable RoE: ONGC’s sustainable return on equity is lower than the expected cost of capital. This implies that the underlying business will destruct value over a period of time due to its inability to generate superior returns on capital.
- Low Interest Coverage: ONGC has a low interest coverage ratio of 9.74 times which implies that a large portion of operating profits are getting attributed to payment of interest to debtholders. This can leave lower earnings and cash flows for equity shareholders.
- Highly Cyclical Industry: ONGC operates in a highly cyclical industry with unpredictable earnings and cash flows. This can result in high stock price volatility and impact shareholders negatively.
- Capital Intensive Business: ONGC has a low asset turnover ratio of 1.71. This has a negative impact on ROE. Also, due to low asset turnover ratio, business’s growth will need to be funded by either increasing borrowings or diluting shareholders. Both of these will have a negative impact on shareholders’ value.
- Extremely Speculative Stock: ONGC’s stock is extremely speculative in nature and can negatively impact long-term shareholders.
Competitor Analysis of ONGC (As on 9th September 2021)
| Company | Price (Rs) | Market Cap (Cr) | P/E | EPS (Rs) | Dividend Yield (%) | ROE (%) |
| Asian Oilfield Services Ltd | 143.7 | 552 | 11 | 10.01 | 0 | 17.6 |
| Jindal Drilling Industries Ltd | 134.5 | 389 | 34.4 | 3.9 | 0.37 | -0.49 |
| Aban Offshore Ltd | 44.24 | 260 | 0 | -345.22 | 0 | 0 |
Visit Samco’s share pages to check the star ratings for every listed company. Search for stocks to get live prices, ratings, valuation and analysis. Open a FREE Demat account with Samco and experience world class trading.


 Easy & quick
Leave A Comment?